High Frequency Conductivity in the Quantum Hall Regime
Abstract
We have measured the complex conductivity of a two-dimensional electron system in the quantum Hall regime up to frequencies of 6 GHz at electron temperatures below 100 mK. Using both its imaginary and real part we show that can be scaled to a single function for different frequencies and for all investigated transitions between plateaus in the quantum Hall effect. Additionally, the conductivity in the variable-range hopping regime is used for a direct evaluation of the localization length . Even for large filing factor distances from the critical point we find with a scaling exponent .
pacs:
73.40.Hm, 71.23.An, 72.20.My, 71.30.+hIt is widely accepted that the understanding of the integer quantum Hall effect (QHE) is closely related to a disorder driven localization-delocalization transition occurring in two-dimensional electron systems (2DES) in high magnetic fields review . Many experimental and theoretical works approve the interpretation of the transition between adjacent QHE plateaus as a quantum critical phase transition. It is governed by a diverging localization length which scales with the distance of the energy from the critical energy in the center of a Landau band. The exponent is believed to be a universal quantity independent of disorder. For finite systems with effective size theory predicts that the conductivities follow scaling functions resulting in a finite width of the transition region. The effective system size is determined by the physical sample size, the electron temperature or the frequency .
The most common test of scaling uses an analysis of the temperature or frequency dependence of the conductivity peak width in the QHE plateau transition. However, lacking an exact expression for , this method does not allow to access the scaling behavior of the localization length directly.
An alternative approach to scaling was proposed by Polyakov and Shklovskii polyakov93 . Using the fact that the conductivity in the QHE plateaus at low temperatures is dominated by variable-range hopping (VRH) vrh1 , they analyzed the temperature, current, and frequency dependence of in order to gain direct access to the localization length . The temperature dependence of in the VRH regime was also investigated experimentally vrh2 . However, due to an unknown theoretical prefactor, could only be estimated from these experiments.
In contrast, the frequency driven variable-range hopping conductivity (in the limit ) is given by polyakov93
| (1) |
linearly depending on both frequency and localization length with no unknown prefactors.
Here we report on measurements of the complex conductivity up to frequencies GHz at low temperatures down to below 100 mK. We will show that can be scaled with a single-parameter function to , independent of temperature, frequency, and filling factor. Secondly we will use Eq. (1) to directly measure the localization length deep into the variable-range hopping regime for several QHE plateau transitions. Its filling factor dependence follows a scaling behavior with up to large distances from the critical point . In the center of the QHE plateaus is found to be limited by the magnetic length, the natural length scale of the quantum Hall state.
The two-dimensional electron system used in our experiments was realized in an AlGaAs/GaAs heterostructure grown by molecular beam epitaxy and lies 75 nm underneath the surface. Its electron mobility and density are m2/Vs and m-2. The sample was patterned into Corbino geometry with contacts fabricated by standard Ni/Au/Ge alloy annealing. This geometry allows a direct two-point measurement of the longitudinal conductivity at high frequencies. For an ideal Corbino geometry is given by . is the two-point conductance with current and voltage measured at the same contacts. The sample dimensions of our Corbino ring are m for the outer and m for the inner radius.
The conductance measurement at high frequencies is realized by a reflection measurement setup: The sample acts as load of a high frequency coaxial line with a characteristic impedance of . A load impedance deviating from leads to reflection of an incident wave at the load with a complex reflection coefficient . The total reflection coefficient of the loaded line is made up of the sample reflection and of properties of the line itself such as phase shifts, losses and reflections at interconnections. A careful calibration of these frequency dependent contributions of the line allows the extraction of and therefore of the complex sample conductivity from the direct accessible quantity . The sample dimensions were chosen as compromise between sensitivity, which is largest for a sample impedance close to , and the avoidance of size effects for too small ring widths koch91 .
Sample and coaxial line where fitted into a dilution refrigerator with base temperature mK using a multi step thermal sinking of the line. The sample is situated in the center of a super-conducting solenoid capable of producing magnetic fields up to T. The reflection of the coaxial line terminated with the sample is measured with a network analyzer with a frequency range kHz to 6 GHz using power levels dBm which were checked not to influence the measured conductivity. The analyzer was used in continuous wave mode with fixed frequency while stepping the magnetic field.
Figure 1 shows the real part of the measured conductivity as function of the filling factor . It shows well pronounced Shubnikov-de Haas oscillations with zero conductivity at integer filling factors and maxima near half integer . Every peak corresponds to the transition between adjacent quantum Hall states with a critical point at maximum conductivity. The transition within the lowest Landau level deviates from the other transitions by form and amplitude of the peak and shows a shoulder possibly originating from the presence of an impurity band kuchar00 .
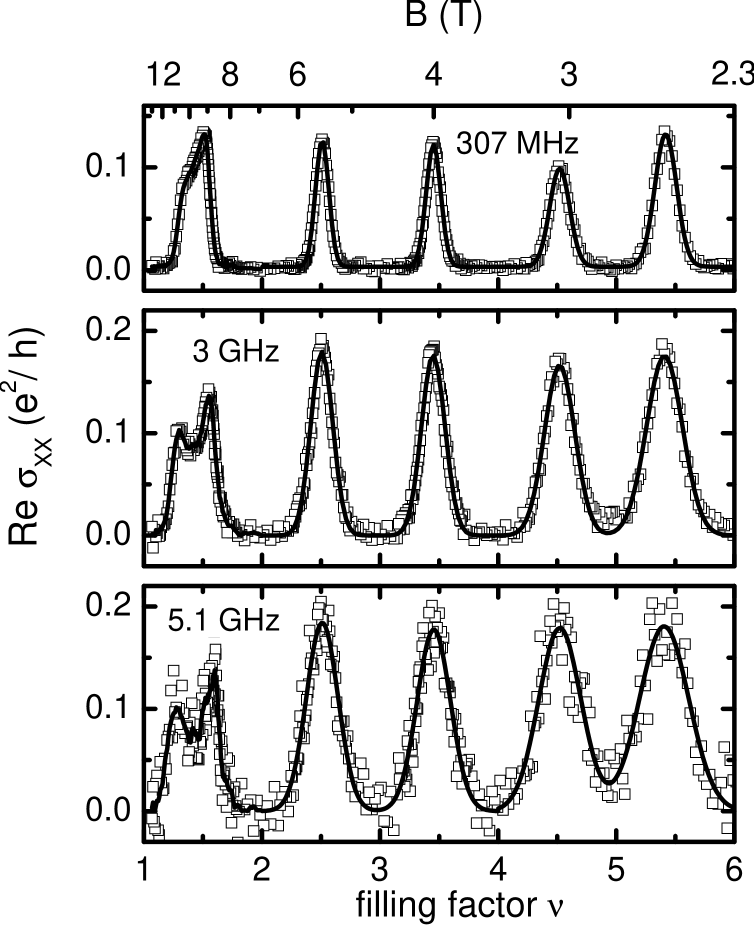
The other transitions are very symmetric and can be fitted by Gaussians. This fit is used to derive the position of the critical filling factors and the critical conductivities . For GHz and its value is the same for all transitions and independent of frequency as expected by scaling theory, but deviates from the proposed universal value sigma . A possible explanation for this discrepancy was given by Ruzin et al. ruzin96 who proposed fluctuations in the carrier density as cause of non-universal critical conductivity values.
Previous experiments by Engel et al. engel93 and Balaban et al. balaban98 were restricted to a measurement of the real part of whereas our technique gives access to both the real and imaginary part. This allows an additional test of universal frequency scaling. As an example we show the real and the imaginary part of the complex conductivity for GHz in Fig. 2a. and display a similar symmetry around the critical points, which are marked by the maxima of the conductivity. In the QHE plateau centers between two critical points tends to zero (except for where spin splitting is no longer fully resolved). Approaching the critical points both and start to rise to positive value. While to our knowledge there is no published theoretical prediction of the imaginary part of the hopping conductivity of interacting electrons in high magnetic fields this behavior agrees qualitatively with the theory of Efros efros85 for low magnetic fields. He calculated with the characteristic phonon frequency, which gives a linear dependence between and at fixed frequency.
When moving closer towards the critical point starts dropping back to a a value near zero whereas continues increasing up to for the sample investigated. This agrees with the expectation for a quasi metallic behavior of a 2DES at the critical point. The crossover between the variable-range hopping regime and the metallic regime occurs at a conductivity , independent of frequency ( GHz) and temperature.

The extra information gained from the imaginary part allows a new test of the applicability of scaling theory. The theory predicts a complex conductivity following a scaling function pruisken88 , where is the deviation to the nearest critical point and is the frequency dependent dynamic length. Since depends monotonically on we can invert and replace the argument in with some function . Doing this we expect an explicit, transition and frequency independent function . In Fig. 2b, where vs. at GHz is shown for different transitions, such a universal scaling is indeed observed. We find a similar agreement for all frequencies GHz. As an example the comparison of the filling factor range is shown for frequencies of GHz and GHz in the inset of Fig. 2b. Although the transition width for the two frequencies differs by a factor of the shape in this kind of plotting of versus agrees. This insensitivity on filling factor and frequency confirms the scaling behavior of the sample.
Let us now turn to the second central topic of this Letter, namely a direct experimental access to the localization length . To test for conventional scaling behavior we have investigated the temperature and voltage dependence of the plateau transition width . Both follow power-laws and with exponents and as found in most previous experiments review . The frequency dependence of is also found to be in agreement with scaling, however with a scaling exponent which is larger than the value proposed by Engel et al. () engel93 . A more detailed analysis of the plateau transition width can be found in Ref. hohls00a, .
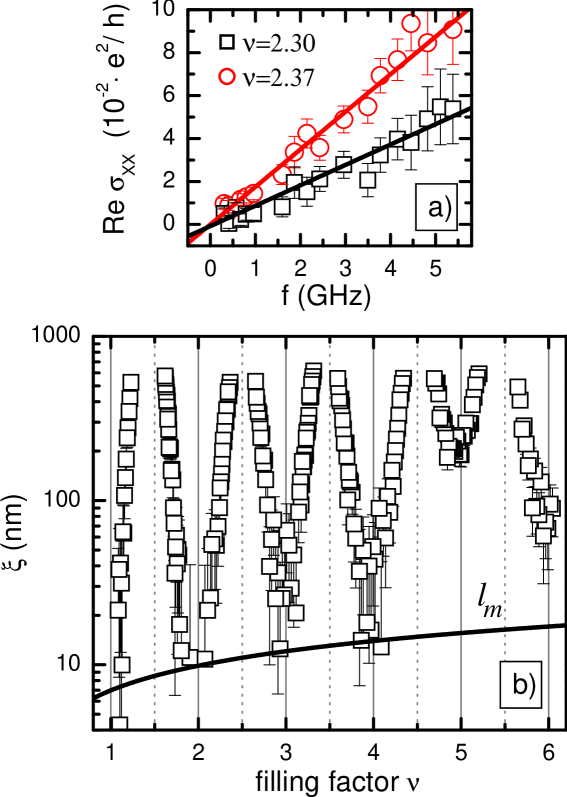
Though the conventional analysis of the width of the plateau transition is a powerful tool for the test of scaling, it is only an indirect approach to the localization length. Using Eq. (1) our high frequency measurements allow a direct evaluation of this length, provided that for a fixed filling factor. Examples for linear fits of our data to Eq. (1) are shown in Fig. 3a. Using Eq. (1) with for GaAs the localization length can be directly extracted from the slope of these linear fits. The resulting dependence of on is plotted in Fig. 3b.
In the same graph the filling factor dependence of the magnetic length is drawn. Though the error bars are rather large compared to this length the plot shows qualitatively, that the magnetic length, which is the shortest possible length scale of the electron system in a high magnetic field, sets the order of magnitude for the localization length in the middle of the quantum Hall plateaus. The plateaus for show a larger localization length because the energy gaps are no longer fully resolved at low magnetic fields.
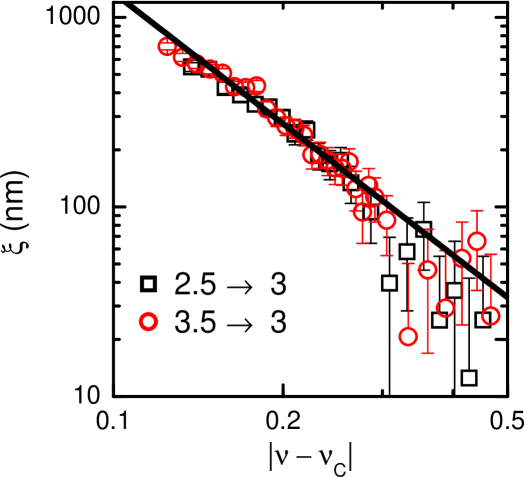
With this direct measurement of the localization length it is possible to test the scope of the power law when approaching the QHE plateau. This is shown in Fig. 4 for both sides of the plateau. Data and power law with agree well over the complete range. Because of the rather large distance from the critical point this is, on a first glimpse, rather astonishing. However, numerical calculations of Huckestein et al. huckestein90 also show a power law down to a localization length of a few magnetic lengths .
In conclusion we measured the frequency dependence of the longitudinal conductivity for frequencies up to 6 GHz. We were able to access both the real part and the imaginary part of which allowed us to perform a new test of scaling behavior. Using the theory of Polyakov and Shklovskii on variable-range hopping in the QHE we were able to deduce the localization length. Its filling factor dependence is consistent with universal scaling behavior far into the QHE plateau.
We thank F. Evers, B. Huckestein, B. Kramer, F. Kuchar, J. Melcher, D. G. Polyakov and L. Schweitzer for useful discussions. The sample was grown by K. Pierz at the Physikalisch-Technische Bundesanstalt in Braunschweig.
References
- (1) recent reviews: B. Huckestein, Rev. Mod. Phys. 67, 357 (1995); S. L. Sondhi, S. M. Girvin, J. P. Carini, and D. Shahar, Rev. Mod. Phys. 69, 315 (1997).
- (2) D. G. Polyakov and B. I. Shklovskii, Phys. Rev. B 48, 11167 (1993); D. G. Polyakov and B. I. Shklovskii, Phys. Rev. Lett. 70, 3796 (1993).
- (3) G. Ebert, K. von Klitzing, C. Probst, E. Schuberth, K. Ploog, and G. Weimann, Solid State Commun. 45, 625 (1983); A. Briggs, Y. Guldner, J. P. Vieren, M. Voos, J. P. Hirtz, and M. Razeghi, Phys. Rev. B 27, 6549 (1983).
- (4) S. Koch, R. J. Haug, K. v. Klitzing, and K. Ploog, Semicond. Sci. Technol. 10, 209 (1995), M. Furlan, Phys. Rev. B 57, 14818 (1998).
- (5) S. Koch, R. J. Haug, K. v. Klitzing, and K. Ploog, Phys. Rev. Lett. 67, 883 (1991).
- (6) F. Kuchar, R. Meisels, K. Dybko, and B. Kramer, Europhys. Lett. 49, 480 (2000).
- (7) e.g. M. P. A. Fisher, G. Grinstein, and S. M. Girvin, Phys. Rev. Lett. 64, 587 (1990); Y. Huo, R. E. Hetzel, and R. N. Bhatt, Phys. Rev. Lett. 70, 481 (1993).
- (8) I. M. Ruzin, N. R. Cooper, and B. I. Halperin, Phys. Rev. B 53, 1558 (1996).
- (9) L. W. Engel, D. Shahar, C. Kurdak, and D. C. Tsui, Phys. Rev. Lett. 71, 2638 (1993).
- (10) N. Q. Balaban, U. Meirav, and I. Bar-Joseph, Phys. Rev. Lett. 81, 4967 (1998).
- (11) A. L. Efros, JETP 62, 1057 (1985).
- (12) A. M. M. Pruisken, Phys. Rev. Lett. 61, 1297 (1988).
- (13) F.Hohls, U. Zeitler, R. J. Haug, and K. Pierz, cond-mat/0010417, accepted for publication in Physica B.
- (14) B. Huckestein and B. Kramer, Phys. Rev. Lett. 64, 1437 (1990).