Sensitive methods for estimating the anchoring strength of nematic liquid crystals on Langmuir-Blodgett monolayers of fatty acids
Abstract
The anchoring of the nematic liquid crystal N-(p-methoxybenzylidene)-p-butylaniline (MBBA) on Langmuir-Blodgett monolayers of fatty acids (COOHCnH2n+1) was studied as a function of the length of the fatty acid alkyl chains, (). The monolayers were deposited onto ITO-coated glass plates which were used to assemble sandwich cells of various thickness that were filled with MBBA in the nematic phase. The mechanism of relaxation from the flow-induced quasi-planar to the surface-induced homeotropic alignment was studied for the four aligning monolayers. It was found that the speed of the relaxation decreases linearly with increasing the length of the alkyl chains which suggests that the Langmuir-Blodgett film plays a role in the phenomenon. This fact was confirmed by a sensitive estimation of the anchoring strength of MBBA on the fatty acid monolayers after anchoring breaking which takes place at the transition between two electric-field–induced turbulent states, denoted as DSM1 and DSM2. It was found that the threshold electric field for the anchoring breaking, which can be considered as a measure of the anchoring strength, also decreases linearly as increases. Both methods thus possess a high sensitivity in resolving small differences in anchoring strength. In cells coated with mixed Langmuir-Blodgett monolayers of two fatty acids ( and ) a maximum of the relaxation speed was observed when the two acids were present in equal amount. This observation suggests an efficient method for controlling the anchoring strength in homeotropic cells by changing the ratio between the components of the surfactant film.
1 Introduction
For the operation of liquid crystal displays and devices (LCDs) the alignment of the liquid crystal (LC) plays a vital role. In the absence of an external electric or magnetic field (field-free condition) the liquid crystal alignment is entirely dictated by the LC/substrate interactions. These interactions have been a subject of intensive study for more than two decades with surface anchoring being one of the highlights of the surface physics of liquid crystals. Although the LC/substrate interactions are to a large extend understood, the lack of sensitive and reliable techniques for measuring the anchoring strength is an obstacle for a fast progress of our knowledge in the field.
There are various techniques for measuring the anchoring strength[1, 2, 3]. In general, they can be divided in two major groups depending on whether the measurements have been carried out in a filed-free condition or not. One of the most frequently and widely used method is the Frederiks transition[2]. Although it gives satisfactory results, in some cases it is not sensitive enough to resolve small differences in anchoring strength.
The effort in the development of liquid crystal displays has been focussed, generally speaking, on improving the image contrast, the resolution, the number of gray levels as well as on increasing the size of the display and shortening the response time. Recently [4, 5], the so called vertical mode (VA) display has begun to attract the interest of researchers and engineers mainly for two reasons. First, the homeotropic (vertical) alignment of the liquid crystal required by the VA mode can be easily controlled by an electric field, due to the weak anchoring conditions. Second, the contrast is very high and the response time is short. To realize the VA mode, however, it is necessary to align the liquid crystal homeotropically, i.e. with the nematic director perpendicular to the confining substrates. Also, the homeotropic anchoring strength is an important parameter that influences the device performances.
There are a number of methods for obtaining homeotropic alignment [6]. Among them, the most used one is that of treating the substrate with a surfactant. It is known that very densely packed surfactant layers do not give homeotropic alignment of good quality. A looser packing of the surfactant molecules usually gives good homeotropic alignment since it allows a certain degree of penetration (interdigitation) of the liquid crystal molecules in the surfactant layer [7, 8]. Homeotropic alignment obtained with different agents differs not only by the degree of uniformity, but also by the magnitude of the strength of the liquid crystal anchoring, which varies between 10-5 and 10-6 J m-2 (weak anchoring).
In this work the anchoring of MBBA (N-(p-methoxybenzylidene)-p-butylaniline) on Langmuir-Blodgett (LB) monolayers of fatty acids (COOHCnH2n+1) is studied as a function of the length ( = 15, 17, 19, 21) of the fatty acid alkyl chains. Generally, the nematic liquid crystal anchoring is characterized by two parameters, and , the polar and the azimuthal anchoring strength, respectively. Here only will be considered and we will refer to it as .
In previous studies [9] we have shown that the liquid crystal nematic capillary flow has a strong impact on the surfactant LB monolayer. The LB molecules are oriented in the azimuthal direction of the flow with a large pretilt which results in a quasi-planar NLC alignment with splay-bend deformation and preferred orientation along the flow direction[10, 9, 11]. Once the flow ceases the LB film relaxes to the equilibrium orientation in which the LB molecules present a tilt (about 40 degrees) isotropically distributed in the plane of the cell which induces homeotropic alignment in the NLC bulk. Here we will show that the dynamics of this process depend on the length of the surfactant molecules. Also, in [12] we have shown that above a certain electric field threshold a turbulence-to-turbulence (DSM1-DSM2) transition occurs in MBBA, which is related to breaking of the anchoring. The threshold was found to be proportional to the anchoring strength, (about 10-6 J m-2) being thus a measure of it. Here we will show that this turbulence-to-turbulence transition is very sensitive to , and it can resolve even the very small differences due to the use of slightly different surfactants. Since homeotropic alignment is generally weak these differences can be extremely small. In this context it is important to underline that the Fredericks transition method, the most widely used method for evaluating , does not possess the same sensitivity.
2 Experiment and results
2.1 Film preparation
The long chain fatty acids used in this experiment are listed in Table 1.
| Common name | Formula | Abbreviation |
|---|---|---|
| Palmitic | C15H31COOH | C16 |
| Stearic | C17H35COOH | C18 |
| Arachidic | C19H39COOH | C20 |
| Behenic | C21H43COOH | C22 |
They were spread from chloroform solutions on the surface of ultrapure Milli-Q water in a LB trough held in a cleanroom. The monolayers at the air/water interface were characterized by surface-pressure compression isotherms, which are shown in Figure 1.
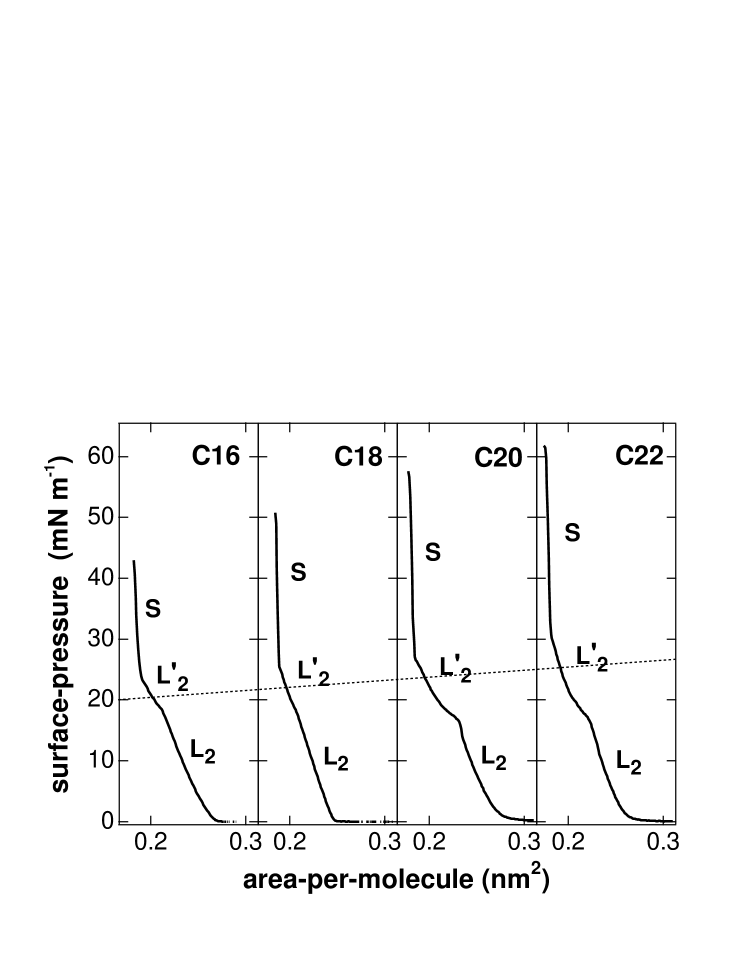
Three condensed phases were observed for all substances, whose characteristics are listed in Table 2.
| Phase | Name | Characteristics |
|---|---|---|
| L2 | liquid-condensed | tilted molecules |
| L | liquid-condensed | almost upright molecules, |
| same compressibility to L2 | ||
| S | solid | upright molecules; high collapse pressure; |
| less compressible than L2 and L |
We chose to deposit the LB films in the L phase, where the molecules are almost upright and still the monolayers are far from collapse [13]. Also, the monolayers were deposited at the same area-per-molecule (0.2 nm2), in order to have the same surface density of molecules on the plates.
We also deposited mixed monolayers of C18 and C22 in different proportions. The miscibility of these two fatty acids at the air/water interface has been studied elsewhere[14]. The isotherms are shown in Figure 2.
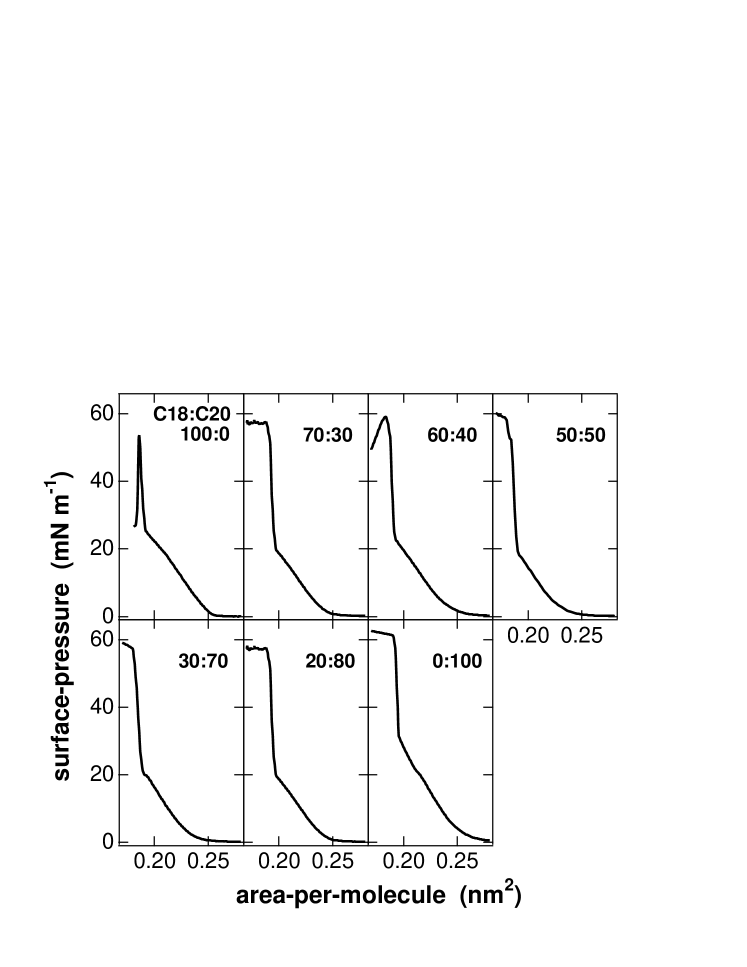
The mixed monolayers were deposited at the fixed surface-pressure of 20 mN m-1. The transfer ratio was always one.
We used ITO coated glass plates, previously carefully cleaned in a clean room environment.
2.2 Alignment dynamics
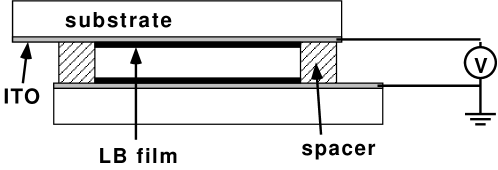
The LB coated plates were used to assemble sandwich cells (Figure 3) of various thickness.
The cells were filled with MBBA in the nematic phase (room temperature). During filling the NLC adopts a bend-splay–deformed quasi-planar alignment with preferred orientation along the filling direction. As soon as the flow stops, homeotropic domains nucleate in the cell and expand until the whole sample becomes homeotropic.
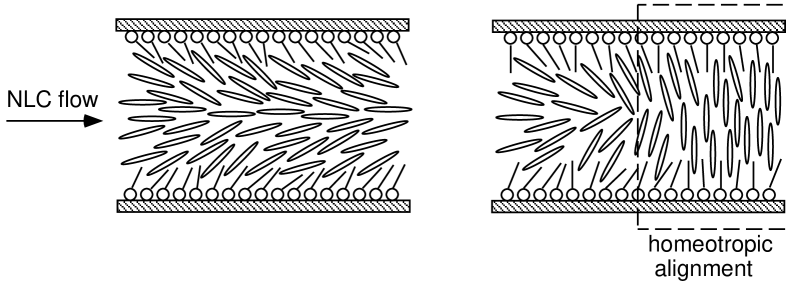
The role of the LB monolayer has been discussed in [10, 9]: during the filling process the chains are distorted by the flow, and relax to the equilibrium position once the flow has ceased (Figure 4).
A time sequence of pictures of a homeotropic domain expanding in the quasi-planar structure is shown in Figure 5.
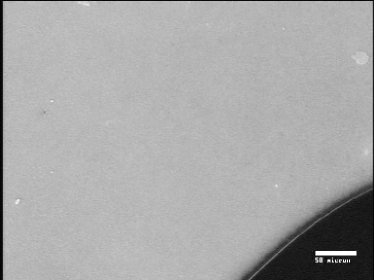
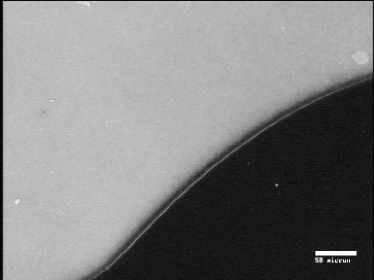
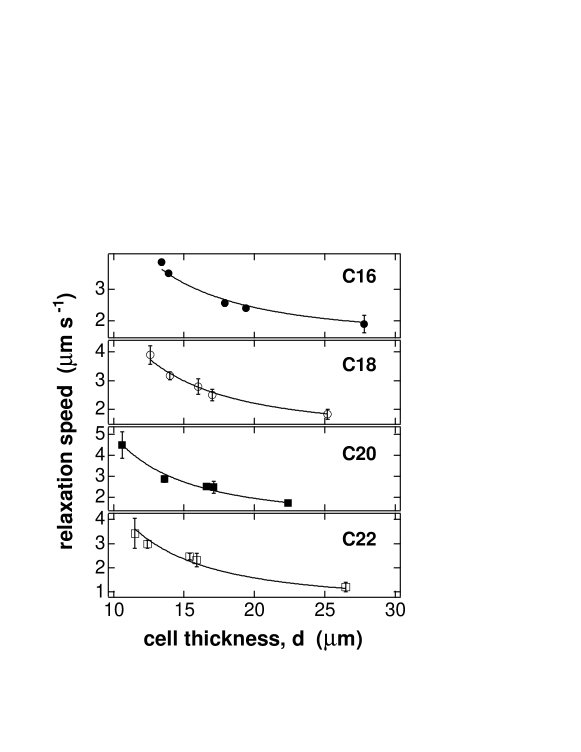
The pictures refer to a cell whose plates had been coated with a monolayer of C18. The procedure was repeated for the four aligning fatty acids listed in Table 1 and the speed of expansion of the homeotropic domains was found to depend on the length of their alkyl chains and on the cell thickness, as shown in Figure 6.
The dynamics of the process is governed by surface and bulk effects. Here we present a simple model in which only two contributions are taken into account, namely, a rapid relaxation in the boundary LB monolayer (whose characteristic time is ) followed by the elastic relaxation of the splay-bend deformation in the bulk (whose characteristic time is ). The total relaxation time, , is given by:
| (1) |
For a (small) deformation (see Figure 4) the surface process is determined by the balance between the anchoring, the elastic, and the surface viscosity forces and reads[1]
| (2) |
where is the characteristic elastic constant of the splay-bend deformation in the one-constant approximation, is the anchoring strength, and is the surface viscosity[15]. The characteristic time is given by:
| (3) |
where is a characteristic length given by
| (4) |
where is the cell thickness. In the case of weak anchoring and thus , the extrapolation length[2]. In this case the surface relaxation time becomes
| (5) |
The bulk process is determined by the balance between the elastic torque and the bulk viscous torque and reads[1]
| (6) |
where is the bulk viscosity. The characteristic time of the bulk relaxation is then[10]
| (7) |
In our experiment we measured directly the speed with which the homeotropic domains expand in the quasi-planar state, i.e. the speed with which the quasi-planar domain relaxes to homeotropic. The speed of the surface (bulk) relaxation, () is inversionally proportional to the surface (bulk) relaxation time, i.e. (). Thus, using Equation 1, the total speed of relaxation , is given by:
| (8) |
Due to the selective adsorption of ions present in the NLC bulk at the surface [16, 17], depends on the cell thickness. This ionic charge attracts ions of the opposite charge and a double layer of charges is formed which depends only on the substrate and on the NLC used. As a consequence, a surface electric field is created, which extends in the bulk over the Debye screening length, . For symmetry reasons the field is normal to the substrate and has an orienting effect on the NLC through the coupling to the dielectric anisotropy. The anchoring strength thus appears to be thickness dependent because the amount of ions present in the liquid crystal depends on the sample volume which is proportional to the cell thickness . This effective anchoring strength can be written as[17]
| (9) |
where the flexoelectric effect has been neglected. In Equation 9 is the Rapini-Papoular anchoring strength[18] which does not depend on the cell thickness. is the dielectric anisotropy, is the average dielectric constant of the liquid crystal, and is the vacuum dielectric constant. is the electric charge density adsorbed at the surface:
| (10) |
where depends on the conductivity of the liquid crystal and on the characteristics of the surface.
Using Equations 9 and 10, Equation 8 becomes:
| (11) |
where
| (12) |
is a constant characteristic of the liquid crystal and the substrate. Generally [16] and the second term of the right-hand side of Equation 11 varies very little with as compared to the third term. Thus, the surface speed can be considered essentially constant with respect to the bulk speed in the range of cell thickness used in this work. Equation 11 can thus be rewritten as
| (13) |
where constant and is a proportionality factor which depends on and .
The data in Figure 6 where fitted to the function in Equation 13 and the fits are shown in the figure. The fitting parameter was found to depend on the LB aligning monolayer, as shown in Figure 7, which is in agreement with our interpretation of it as characteristic of the surface. The fitting parameter was found to be essentially constant in the error bar (s s-1) independent of the aligning monolayers.

The surface relaxation is faster for shorter chains, and seems to follow a linear relation with the number of carbon atoms in the chain. Moreover, the quality of the homeotropic alignment itself is higher for shorter chains. These two observations together suggest that the anchoring of MBBA is quite sensitive even to small differences in the length of the surfactant. For instance, the anchoring strength is expected to be affected by the presence of chains of different length in the same monolayer.
The relaxation process was also studied in cells of fixed thickness (15 m) coated with mixed LB films of C18 and C22 in different ratios. Figure 8 shows the speed of relaxation of the homeotropic domains as a function of the percentage of C18 in the LB aligning monolayer.

The relaxation is faster for the mixed layers in which the proportions of the two compounds are similar. In particular, the highest speed is obtained for the 50:50 mixture. Also in this case the quality of the homeotropic alignment was higher in those cells where the relaxation process was faster.
2.3 Anchoring strength
The anchoring strength MBBA on the fatty acid LB monolayers has been measured with the Frederiks transition method[2]. MBBA possesses negative dielectric anisotropy and thus a vertical electric field destabilizes MBBA’s homeotropic alignment. Homeotropic alignment appears dark between crossed polarisers. Above a certain electric field threshold (Frederiks transition threshold) the molecules in the bulk are tilted by the electric field and some light is transmitted through the crossed polarisers. Here we defined as threshold field the one at which 20% of the saturated value of the transmitted light intensity was reached. The anchoring strength can then be calculated as[12, 11]:
| (14) |
In Figure 9 the dependence of on the cell thickness is presented.
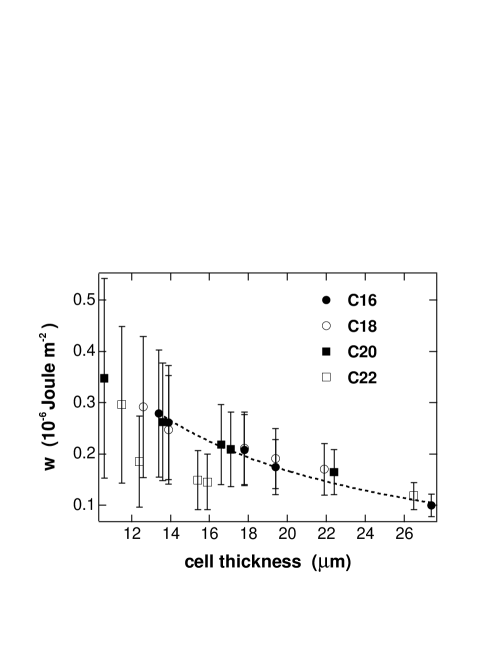
Because of the weak anchoring the small differences in anchoring strength due to the different aligning layers cannot be resolved using this method.
The data in Figure 9 are fitted very well by Equation 9 (in Figure 9 only the fit for the C16 data is shown). and are the fitting parameters. was found to be C m-2 independent on the cell thickness. Instead, was found to decrease with increasing the chain length of the surfactants, as shown in Figure 10.

This dependence reminds that of the relaxation speed of the homeotropic alignment (Figure 7): the agreement with a linear decrease of with increasing the length of the chain is rather good.
2.4 Anchoring breaking
Recently[12] we have shown that an alternative method for measuring/comparing anchoring strengths is the mechanism of anchoring breaking due to the onset of an electric-field–induced turbulence-to-turbulence transition in the sample. Above the Fredericks transition threshold initially homeotropic MBBA (aligned by a fatty acid monolayer) is essentially quasi-planarly oriented. Increasing the field above the Fredericks threshold one observes first modulate structures (William rolls [1]), then their destabilization, and then the transition to a weakly turbulent state, called DSM1 (Dynamic Scattering Mode 1). All these electric-field–induced instabilities do not affect the anchoring of MBBA on the fatty acid monolayer, and the homeotropic alignment is immediately restored once the electric field is switched off [12]. Increasing the electric field further above the DSM1 threshold, one observes the transition to another turbulent state, denoted as DSM2: domains of DSM2 nucleate in the nematic layer which is in the DSM1 state, and expand over the whole sample area in form of circular domains[12, 19] (Figure 11).
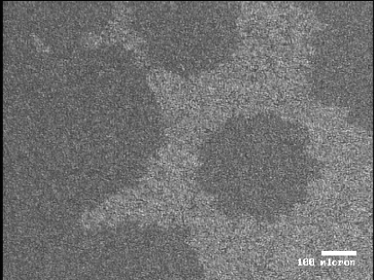
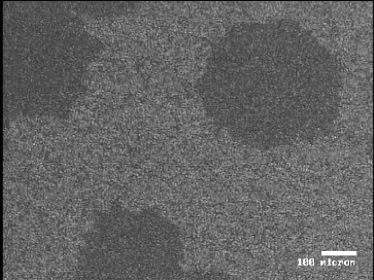
In [12] we demonstrated that DSM1-to-DSM2 transition is due to the breaking of the surface anchoring: switching off the electric field above the DSM2 transition, the homeotropic alignment is not immediately restored. Instead, the sample is in a metastable quasi-planar state which relaxes to homeotropic as the flow-induced quasi-planar state does (in form of circular homeotropic domains that expand until the whole sample becomes homeotropic again). Thus, the electric field threshold of DSM2 is proportional to the anchoring strength and can be considered as a measure of it.
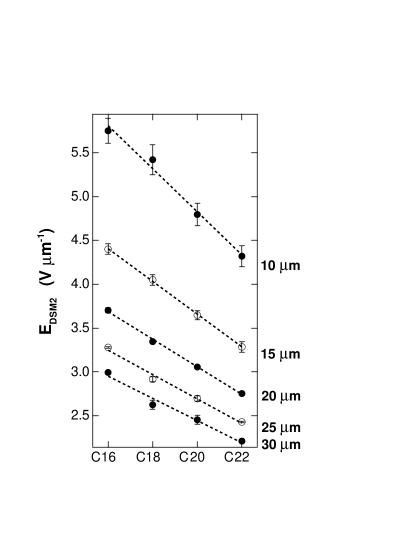
In Figure 12 the electric field threshold for DSM2, , in MBBA cells are shown as a function of the cell thickness for the four fatty acid LB aligning layers.
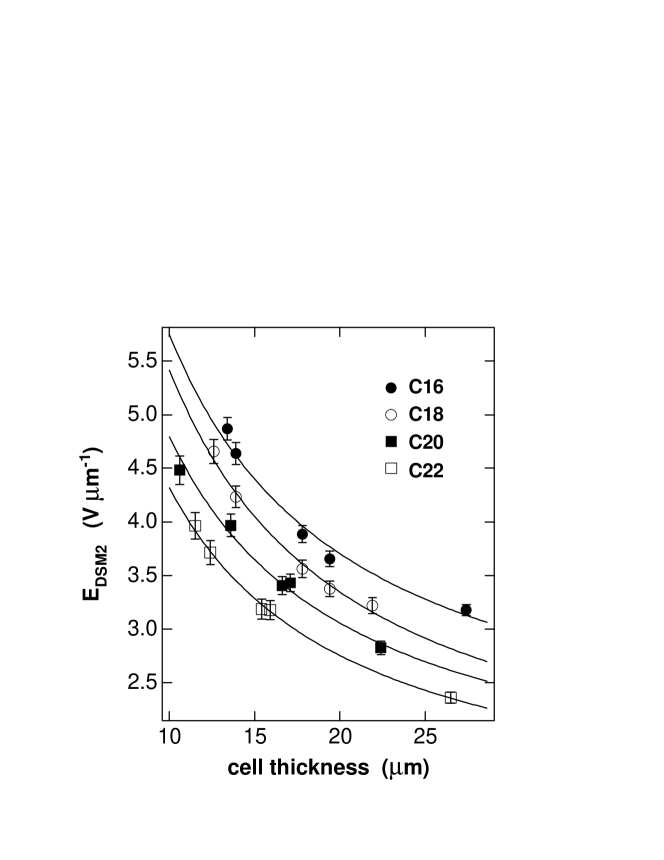
There is a clear dependence on the nature of LB monolayer which demonstrates how sensitive this method is in resolving the small differences arising from the different thickness of the aligning monolayers. Since the threshold for DSM2 is proportional to the anchoring strength, the data were fitted with a function proportional to the anchoring strength in Equation 9:
| (15) |
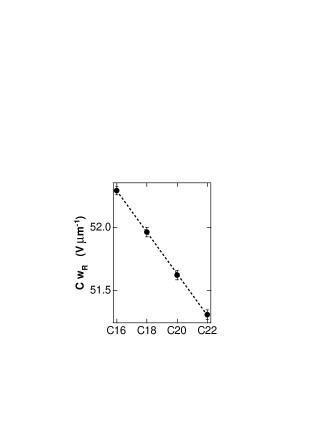
where is a constant of proportionality. The fitting parameter is proportional to and thus decreases linearly with increasing the length of the alkyl chains (Figure 13) as (Figure 10).
From the fits it is possible to extrapolate the value of as a function of the LB chain length for different cell thicknesses, which are plotted in Figure 14.
is linearly decreasing with increasing the chain length, as and .
3 Discussion and conclusions
Whereas the present knowledge about alignment of liquid crystals (especially nematics) may be considered as sufficient for achieving a desired kind of alignment, the tuning of the anchoring strength is a very difficult task, if not impossible. The difficulties in controlling the anchoring strength arise not only from the lack of proper aligning materials, but also from the lack of sensitive enough methods to resolve small variations in anchoring strength.
In this work, two methods for estimating the anchoring strength of homeotropically aligned NLCs on LB monolayers of fatty acids have been presented. One of them is field-free, whereas in the other one an external electric field is necessary.
In the field-assisted method, the threshold for the onset of the DSM2 turbulent state can be interpreted as a measure of the anchoring strength, because above that threshold the anchoring of the liquid crystal to the substrate is broken. For a fixed cell thickness decreases linearly with increasing the length of the surfactant chains. The “surface speed” of relaxation from flow-induced quasi-planar to surface-induced homeotropic alignment also decreases linearly with increasing the length of the surfactant chains, and can thus as well be interpreted as a measure of the anchoring strength. The two methods not only present a quite high sensitivity, as they can resolve very small differences in anchoring strength due to the use of slightly different surfactants, but give also independent and consistent results.
In cells treated with mixed C18:C22 LB monolayers it was found that the relaxation speed, and thus the anchoring strength, strongly depend on the mixture used and it is correlated with the quality of the homeotropic anchoring. In particular the relaxation speed is maximum for similar concentrations of the two fatty acids in the mixed monolayer. In this case, in fact, not only the LC is aligned by penetration into the surfactant chain region, but also by the penetration into the “holes” created by the differences in chain lengths (interdigitation). A schematic picture is shown in Figure 15.
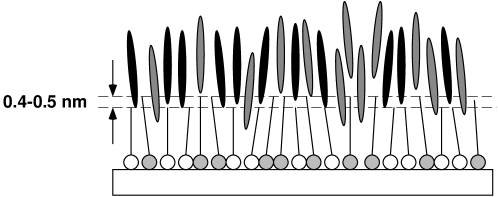
This suggests a way of “tuning” the anchoring strength: can be changed by varying the ratio of the components of the LB film, and thus the density of “holes” . That the LB film density influences the anchoring of nematics is known [22], but the phenomenon of interdigitation has yet not been addressed.
In conclusion, the methods presented in this work make it possible to carry out detailed studies on the anchoring of nematic liquid crystals on surfactants. Their sensitivity allows the use of a great variety of surfactants or, more generally, materials that induce homeotropic alignment. On the basis of the obtained results new theoretical models can be developed in order to reach a deeper understanding of the microscopic LC-surfactant interactions.
4 Acknowledgments
Valentina S. U. Fazio acknowledges the TMR European programme (contract number ERBFMNICT983023) for financial support. Francesca Nannelli acknowledges the Lerici Foundation for financial support.
References
- [1] L. M. Blinov and V. G. Chigrinov. Electrooptic effects in liquid crystal materials. Springer Study, 1995.
- [2] A. A. Sonin. The surface physics of liquid crystals. Gordon and Breach, 1995.
- [3] H. Yokohama. Interfaces and thin films. Oxford University Press, Oxford, 1997.
- [4] N. Koma, Y. Baba, and K. Matsuoka. SID Int. Symp. Digest Tech. Papers, page 869, 1995.
- [5] Y. Koike, S. Kataoka, and T. Sasaki. The 4th Display Workshop, page 159, 1997.
- [6] B. Jérôme. Rep. Prog. Phys., 54:391, 1991.
- [7] K. Hiltorp and H. Stegemeyer. Ber. Buneges. Phys. Chem., 85(7):582, 1981.
- [8] Liquid crystals and ordered fluids, volume 85, 1984. K. Hiltorp and H. Stegemeyer. Proceedings of the American Chemical Society Symposium.
- [9] V. S. U. Fazio, L. Komitov, C. Radüge, S. T. Lagerwall, and H. Motschmann. 2000. Submitted. http://xxx.lanl.gov/abs/cond-mat/0011075.
- [10] V. S. U. Fazio, L. Komitov, and S. T. Lagerwall. Liq. Cryst., 24(3):427, 1998. http://xxx.lanl.gov/abs/cond-mat/9707043.
- [11] Valentina S. U. Fazio. Thin liquid crystal films. Anchoring on Langmuir-Blodgett monolayers and nonlinear optics. PhD thesis, Chalmers University of Technology and Göteborg University, Göteborg, Sweden, 2000.
- [12] V. S. U. Fazio and L. Komitov. Alignment transition in a nematic liquid crystal due to field-induced breaking of anchoring. Europhys. Lett., 46(1):38, 1999. http://xxx.lanl.gov/abs/cond-mat/9810293.
- [13] M. C. Petty. Langmuir-Blodgett films: an introduction. Cambridge University Press, 1996.
- [14] V. S. U. Fazio, L. Komitov, and S. T. Lagerwall. Thin Solid Films, 327–329:681, 1998. http://xxx.lanl.gov/abs/cond-mat/9709180.
- [15] S. A. Pikin. Structural transformations in liquid crystals. Gordon and Breach, New York, 1991. Chapter 5.
- [16] G. Barbero and G. Durand. J. Physique, 51(4):281, 1990.
- [17] A. L. Alexe-Ionescu, G. Barbero, and A. G. Petrov. Phys. Rev. E, 48(3):R1631, 1993.
- [18] A. Rapini and M. Papoular. J. Physique, C4:54, 1969.
- [19] D. E. Lucchetta, N. Scaramuzza, G. Strangi, and C. Versace. Phys. Rev. E, 60(1):610, 1999.
- [20] N. Scaramuzza, C. Versace, and V. Carbone. Mol. Cryst. Liq. Cryst., 266:85, 1995.
- [21] G. Strangi, C. Versace, N. Scaramuzza, V. Carbone, D. Lucchetta, and R. Bartolino. Phys. Rev. E, 59(5):5523, 1999.
- [22] A. L. Alexe-Ionescu, R. Barberi, G. Barbero, G. Bonvent, and M. Giocondo. Appl. Phys. A, 61(4):425, 1995.