Quenched Kosterlitz-Thouless Superfluid Transitions
Abstract
Rapidly quenched Kosterlitz-Thouless (KT) superfluid transitions are studied by solving the Fokker-Planck equation for the vortex-pair dynamics in conjunction with the KT recursion relations. Power-law decays of the vortex density at long times are found, and the results are in agreement with a scaling proposal made by Minnhagen and co-workers for the dynamical critical exponent. The superfluid density is strongly depressed after a quench, with the subsequent recovery being logarithmically slow for starting temperatures near TKT. No evidence is found of vortices being ”created” in a rapid quench, there is only decay of the existing thermal vortex pairs.
pacs:
64.60.Ht, 67.40.Fd, 67.40.Vs, 05.70.LnThere is considerable current interest in the properties of quenched superfluid transitions, since they may have relevance to cosmic-string phase transitions in the rapidly-cooling early universe kibble . Experiments mcclintock have been carried out in superfluid 4He attempting to observe vortex structures ”created” in rapid pressure quenches through the transition, but no vortices have been observed, which is a puzzle he3 .
To try to understand these quenched transitions we have constructed ktq an analytic formulation of the quenched Kosterlitz-Thouless (KT) superfluid transition in two dimensions (2D). Although not the three-dimensional (3D) realm of the experiments, the simplicity of the KT vortex renormalization scheme allows insights into the vortex dynamics that should be useful in extending the calculations to 3D dyn . Previous studies of quenched 2D transitions have included computer simulations sim ; luo ; minn and dynamic scaling theories bray ; bray1 ; minn1 , but there is still considerable controversy over the physics involved. The various dynamic scaling theories give quite different predictions for the temperature dependence of the dynamic scaling exponent , and Bray and co-workers bray1 have even suggested that there may be violations of dynamic scaling. Unfortunately the computer simulations are not able to resolve the questions in the field, since it has recently been shown minn that different boundary conditions in the simulations give different results for the dynamics.
We consider a thin superfluid helium film on a flat substrate, which is coupled to a thermal reservoir at temperature . The vortex pairs in the film are characterized by the distribution function , which is the density of pairs of separation between and d. It is determined from the 2D Fokker–Planck equation ahns ,
| (1) |
where with the vortex core radius, is the pair interaction energy, and is the diffusion coefficient characterizing the mutual friction drag force on the vortex cores of a pair. It can be seen that the time in this equation is scaled by , the diffusion time of the smallest pairs of separation . In common with the scaling theories and simulations, we assume that any renormalization of D can be neglected. At equilibrium where the solution of Eq. (1) is just the usual Boltzmann distribution, where is the core energy of a pair.
The vortex interaction energy in Eq. (1) is determined using the Kosterlitz-Thouless (KT) vortex renormalization methods kt . The Kosterlitz recursion relations can be written in the form
| (2) |
and
| (3) |
where / is the dimensionless areal superfluid density. We take the core energy to be the Villain-model value , where is the starting value of K at . In thermal equilibrium Eqs. (1–3) lead to the well-known result that the superfluid density has a universal jump to zero just above the transition temperature kosterlitz .
To study the quenched transition ktq the film is first equilibrated with the heat bath at temperature , generating an equilibrium distribution of vortex pairs. The top curve in Fig. 1 at = 0 is the distribution at ; it varies asymptotically as . The temperature of the heat bath is then reduced abruptly to a low temperature, 0.1 , where in equilibrium the vortex density is over 20 orders of magnitude smaller. However, due to the Kelvin circulation theorem the pairs cannot suddenly disappear, since the only way they can be extracted by the heat bath is if the plus-minus pairs annihilate at , where the remaining core energy is converted to phonons. This can take quite a long time to occur, however, since the pairs only slowly lose kinetic energy to the diffusive frictional force of the heat bath as they move together towards annihilation comment .
To solve for the time dependence of the distribution function after the quench we combine Eqs. (1) and (2), which become
| (4) |
We solve this in conjunction with Eq. (3) using the method of lines with a third-order Runge-Kutta technique on a finite domain, to a maximum pair separation = e10 = 2.2104. The boundary conditions used are that the flux of pairs be continuous across the boundary , and that drop abruptly to zero at , which is equivalent to putting a delta-function sink term at on the right-hand side of Eq. (4) to generate the annihilation at that point.
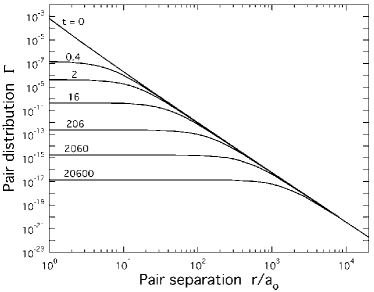
Figure 1 shows the time dependence of the distribution function for an instantaneous quench to 0.1 from a starting temperature barely below (from = 0.747853, compared to the critical value 0.747852 at ). As expected for the annihilation process the smallest pairs decay away first, in the classic pattern of a phase-ordering transition where at long times the largest scales become more dominant. By integrating the distribution function over d the pair density is obtained, shown as the top curve in Fig. 2a. At long times the density decreases nearly as , in agreement with the scaling theories bray ; bray1 ; minn1 at . We find, however, that the slope only approaches -1 logarithmically slowly, being -1.12 at = 100 and -1.09 at = 2104, and more detailed fits show that the density is varying as . This is a consequence of the slow recovery of the superfluid density after the quench (bottom curve of Fig. 2b ), which has a logarithmic approach to its equilibrium value. The substantial drop in the superfluid fraction just after the quench (from an initial value 0.89) is due to the increased polarizability of the pairs at low temperature. Their density is unchanged immediately after the quench, but they screen more effectively due to the lack of thermal fluctuations.

Quenches from starting temperatures below also display power-law variation of the vortex density, since the KT transition is a line of critical points. The plots in Fig. 2 show this for a series of initial temperatures between 0.8 and . At the lower starting temperatures the superfluid density recovers more quickly, and the vortex decay then varies accurately with the form , where the constant agrees with the scaling prediction of Minnhagen and co-workers for the dynamic exponent minn1 ,
| (5) |
Figure 3 shows the values of extracted from the slopes of the curves in Fig. 2a, which are compared with , with a dynamic exponent predicted in Ref. ahns , and with simulation results. It has recently been shown minn that the simulations of the vortex dynamics can be misleading, since different results for are obtained depending on the boundary conditions used: periodic boundary conditions (PBC) yield luo only the spin-wave result = 2 at all temperatures, while fluctuating-twist boundary conditions (FTBC) give minn . Our results in agreement with (except near where the logarithmic corrections enter) provide further support that this is the correct exponent characterizing the vortex dynamics. Unlike the simulations our formulation does not contain spin waves, and this allows a direct probe of the vortices, without their behavior being obscured by the slower dynamics of the spin waves.

Bray and co-workers bray1 have predicted the appearance of a logarithmic term in the decaying vortex density for quenches starting above , but with a form that differs from ours. In their calculation they assume, however, that the superfluid density is a constant in time. As seen in Fig. 2b this may be a reasonable approximation for quenches starting well below , but it appears to fail near because of the logarithmic recovery of the superfluid density. The log term in our vortex density arises entirely from this variation. In Ref. bray1 the appearance of the logarithm is ascribed solely to the presence of free vortices, and this is cited as a violation of dynamic scaling. This is not the case in our calculation, where no free vortices at all are present. It appears that the development of the log term only depends on a sufficient density of pairs of large separation; for quenches starting from = 0.98 we find that the deviations from the power-law decay are already strong, but not quite the logarithmic behavior found right at .
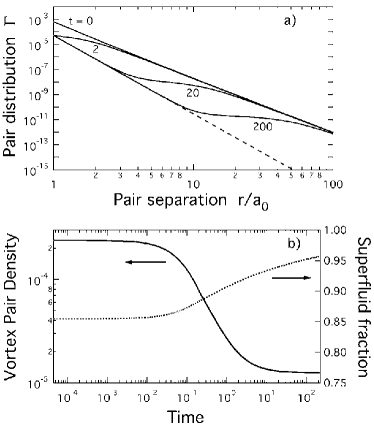
Figure 4 illustrates the approach to equilibrium following an instantaneous quench from to 0.75 . In the distribution function the smallest pairs quickly come to thermal equilibrium (the dashed line) at the new temperature, while the larger pairs only slowly readjust. The vortex density levels off near the equilibrium value, since it is dominated by the smaller pairs. The superfluid density, determined by the larger pairs, recovers more slowly, although because of the higher temperature its initial reduction is considerably smaller than that in Fig. 2b.
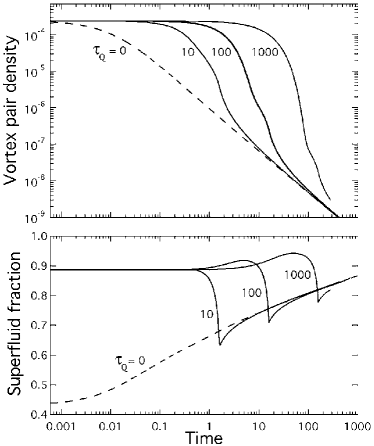
From Fig. 2a it is clear that no vortices are being ”created” in the instantaneous quenches from and below; there is only decay of the existing thermal vorticity. We have looked at the effect of the quench time on this decay, shown in Fig. 5. This shows the vortex density and superfluid fraction for the case of a linear ramp of the temperature from to 0.1 in a time . We assume for convenience that D is independent of temperature, although in a real helium film it would vary during such a finite-time quench heD . It can be seen in Fig. 5a that for a finite quench time the vortex density decreases more slowly than for the instantaneous quench (dashed curve), since the system spends more time at higher temperatures where the thermal density is higher. As the temperature falls and the smaller pairs that had been able to stay in quasi-equilibrium start to annihilate, the more sluggish larger pairs begin to dominate, and the curves revert to the instantaneous-quench result at long times. The slight wiggles in the curves are due to changes in the superfluid fraction, shown in Fig. 5b. The fraction begins to increase slightly as the density of the smaller quasi-equilibrium pairs decreases with the decreasing temperature, but finally the increasing polarizability of the larger pairs overcomes this, driving down the superfluid fraction. Since there are now more pairs remaining than in the instantaneous quench the fraction drops even below the value for that case, and then rejoins it at long times as the smaller pairs decay completely and the larger pairs dominate.
The behavior of the vortex density in Fig. 5 is the opposite of the Kibble-Zurek predictions of Ref. kibble , which postulate that the faster the quench is performed the more vortices will be created. Since these theories do not take into account the thermal vortices it is unclear how any extra vortices would be formed. Of course, our calculations cannot be extended to starting temperatures above , since the KT recursion relations become invalid. We doubt, however, that the additional thermal vorticity generated at higher temperatures will do anything but add smoothly to the decaying curves of Fig. 5. The 2D quench simulations from above sim show no evidence of any additional vortex creation. Even simulations of quenched 3D transitions show (in Fig. 1 of Ref. antunes ) only a smooth and monotonic decay of the thermal vorticity starting from above , with no extra vorticity being generated.
In summary, an analytic formulation of 2D quenched superfluid transitions shows a power-law decay of the vortex density with time, in agreement with the predictions for the dynamic scaling exponent of Minnhagen and co-workers. Quenches starting near show an additional logarithmic variation resulting from the slow recovery of the superfluid density to its equilibrium value. The strong depression of the superfluid density following a quench has not been previously been taken into account, though it plays a major role in the quench dynamics, as seen in Fig. 5. It will be important that any future simulations of quenched transitions (in both 2D and 3D) include computations of the superfluid fraction (the helicity modulus) as well as the vortex density, and also study the effect of changing the boundary conditions. Experimental tests of these vortex dynamics should also be possible: measurements on Josephson-junction arrays have been able to determine = 1.98 0.03 at clarke , and experiments on liquid-crystal films are able to visualize the pair-defect annihilation process following a quench clark .
This work is supported by the National Science Foundation, DMR 97-31523.
References
- (1) A. Gill and T. Kibble, J. Phys. A 29, 4289 (1996); W. Zurek, Phys. Rep. 276, 177 (1996). Extension of this theory to 2D superfluids is found in A. Yates and W. Zurek, Phys. Rev. Lett. 80, 5477 (1998).
- (2) M. Dodd et al., Phys. Rev. Lett. 81, 3703 (1998).
- (3) Very different experiments in 3He have claimed results consistent with the Kibble-Zurek predictions of Ref. 1: V. Ruutu et al., Phys. Rev. Lett. 80, 1465 (1998); C. Bäuerle et al., Nature 382, 332 (1996).
- (4) H. Chu and G. A. Williams, Physica B 284-288, 115 (2000).
- (5) G. A. Williams, J. Low Temp. Phys. 93, 1079 (1993); G. A. Williams, Phys. Rev. Lett. 82, 1201 (1999).
- (6) R. Loft and T. DeGrand, Phys. Rev. B 35, 8528 (1987); M. Mondello and N. Goldenfeld, Phys. Rev. A 42, 5865 (1990); B. Yurke, A. Pargellis, T. Kovacs, and D. Huse, Phys. Rev. E 47, 1525 (1993).
- (7) H. Luo and B. Zheng, Mod. Phys. Lett. 11, 615 (1997).
- (8) B. Kim, P. Minnhagen, and P. Ollson, Phys. Rev. B 59, 11506 (1999); L. Jensen, B. Kim, and P. Minnhagen, Phys. Rev. B 61, 15412 (2000).
- (9) A. Rutenberg and A. Bray, Phys. Rev. E 51, R1641 (1995).
- (10) A. Bray, A. Briant, and D. Jervis, Phys. Rev. Lett. 84, 1503 (2000).
- (11) P. Minnhagen, O. Westman, A. Jonsson, and P. Olsson, Phys. Rev. Lett. 74, 3672 (1995).
- (12) V. Ambegaokar, B. Halperin, D. Nelson, and E. Siggia, Phys. Rev. B 21 1806 (1980).
- (13) J.M. Kosterlitz and D. Thouless, J. Phys. C 6, 1181 (1973); J.M. Kosterlitz, J. Phys. C 7, 1046 (1974).
- (14) D. Nelson and J. M. Kosterlitz, Phys. Rev. Lett. 39, 1201 (1977).
- (15) In this formulation it is not necessary to follow the complex motion and reconnection of the pairs with each other, as such motion is reflected statistically in the change of the distribution function after each time step. Our recombination process at is the same as the “bulk recombination” process discussed by other authors who follow the collision of individual pairs ahns .
- (16) H. Yano, T. Jocha, and N. Wada, Phys. Rev. B 60 543 (1999).
- (17) N. Antunes, L. Bettencourt, and W. Zurek, Phys. Rev. Lett. 82, 2824 (1999).
- (18) T. Shaw et al., Phys. Rev. Lett. 76, 2551 (1995).
- (19) C. Muzny and N. Clark, Phys. Rev. Lett. 68, 804 (1992); N. Clark, private communication.