[
Transient current spectroscopy of a quantum dot in the Coulomb blockade regime
Abstract
Transient current spectroscopy is proposed and demonstrated in order to
investigate the energy relaxation inside a quantum dot in the Coulomb blockade regime.
We employ a fast pulse signal to excite an AlGaAs/GaAs
quantum dot to an excited state, and analyze the non-equilibrium transient
current as a function of the pulse length. The amplitude and time-constant of the
transient current are sensitive to the ground and excited spin states.
We find that the spin relaxation time is longer than, at least, a few s.
PACS numbers: 73.61.Ey, 73.23.Hk, 85.30.Vw
]
Electron spin in a semiconductor quantum dot (QD) has been intensively studied as a candidate for quantum information storage in the solid state and single spintronics in which a single spin state determines the transport through the dot.[1, 2, 3] Electronic QDs, in which discrete energy states are filled up with a controllable number of electrons, show various spin-related phenomena, including spin degeneracy, exchange interaction, spin blockade, and Kondo physics. [4, 5, 6, 7] These conventional dc transport studies measure the overlap of the dot state to the reservoir. However, the transitions between these dot states, which are responsible for the coupling to the environment, should strongly reflect the characteristics of the states by analogy with the selection rules for absorption and emission processes in real atoms. Electronic states in a solid are easily coupled to the lattice environment, while atomic states couple strongly to an electromagnetic environment. Theory predicts that the energy relaxation time of an excited state (ES) in a QD is of the order of nanoseconds if the transition is accompanied by acoustic phonon emission, provided the spin is neglected.[8] By contrast, it should be extremely long if the transition involves a spin flip.[9] Spin conservation during a transition is a selection rule for artificial atoms. Several experimental reports address the relaxation in QDs, however, the relaxation is considered to be an electron-phonon interaction without spin-flip.[10, 11, 12]
Here we report on a pulse-excited transport measurement designed to estimate the energy relaxation time from an ES to the ground state (GS) in a QD. We find that the relaxation time is short (less than a few ns) if the transition conserves the total spin, while it is very long (more than a few s) if the transition involves a spin-flip. We also find that the spin state can be investigated using transient current spectroscopy because of the spin conservation rule.
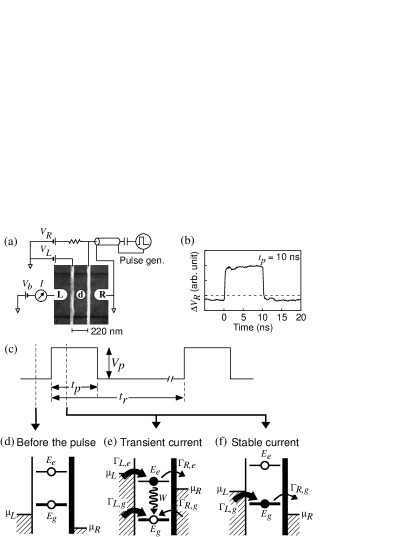
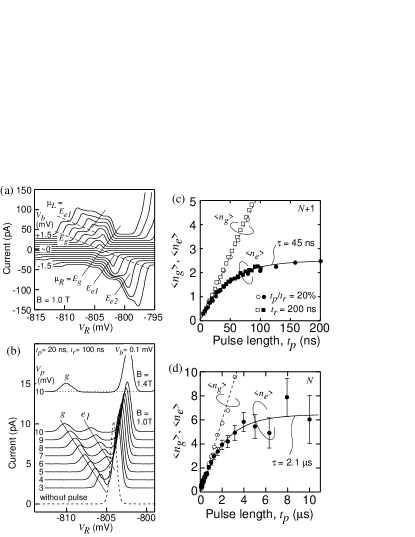
A QD (addition energy of about 2 meV, single particle energy spacing of 100 - 300 eV, number of electrons 50) is weakly coupled to the left and the right leads [see Fig. 1(a)].[12, 13, 14] We made the tunneling rate of the left barrier, , much larger than that of the right barrier, , by roughly tuning the gate voltages, and . Fine tuning of effectively changes the electrostatic potential of the dot allowing us to see one of the Coulomb blockade (CB) oscillations, as shown in Fig. 2(a). If the incoming tunnel rate is smaller than the outgoing tunnel rate (negative bias voltage, , in our experiments), the current, , is given by the rate through the thick barrier to the -th empty state located in the transport window (between the left and right Fermi energies, and , respectively); . The current increases stepwise when an energy level, , enters the transport window at , as indicated by the solid lines. All the energy states in a QD can be detected in this way, unless the coupling to the leads is too weak. We can also estimate each rate from the appropriate current step heights.[4]
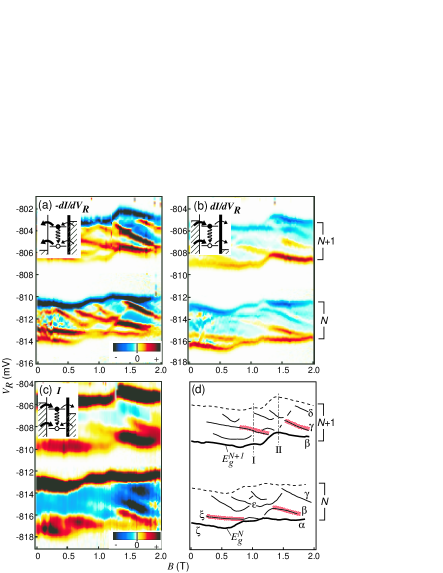
The magnetic field () dependence of the excitation spectrum at = -1 mV (small incoming rate) is shown in Fig. 3(a). The GS and ESs appear as positive peaks, which are plotted separately in Fig. 3(d). The orbital characteristics of the states are manifested by the dependence on energy and the current amplitude (“magnetic fingerprint”).[5, 6, 15] The complicated dependence is a result of crossings or anti-crossings between different energy states in the QD. The first ES in the -electron stripe has the same dependence as the GS of the ()-electron stripe. Similar correlations in neighboring stripes between and , and no even-odd effects due to spin degeneracy are seen in the spectrum, as reported for low-symmetry QDs.[15] Even though the Zeeman energy (about 20 eV/T) is much smaller than , many-body effects give rise to the appearance of spin-polarized states even in a weak magnetic field. The energy relaxation from an ES to the GS strongly depends on their spin states.
In order to investigate the energy relaxation time from such ESs to the GS, we use a pulse excitation to push the system out of equilibrium. We apply a pulse signal to the right gate to modulate the electrostatic potential of the dot [see Figs. 1(a)-1(c)], and measure the non-equilibrium transient current in the following way. During the steady state before the pulse [Fig. 1(d)], both the ES and the GS for a particular number of electrons are located above and for a sufficiently long period to ensure that these states are completely empty. The positive pulse lowers the potential of the dot by 100 - 800 eV, which is smaller than . This means the GS and the ES cannot be simultaneously occupied due to CB. If the potential is lowered so that only the ES is located in the transport window [Fig. 1(e)], transport through the ES continues until the GS becomes occupied. First, an electron tunnels into the ES or the GS with a probability ratio, . If an electron is injected into the ES, it can relax to the GS, or tunnel to the right lead to give a net current. The transport is transient, being blocked once the GS is occupied. We chose asymmetric barriers, , such that an electron can stay in the ES for a long time. Thus, the decay time, , of the transient current should reflect the energy relaxation rate, , from the ES to the GS.
We can relate and from the rate equations,
| (1) |
by taking into account all the tunneling processes shown schematically in Fig. 1(e). Here and are the average electron numbers in the ES and the GS, respectively ( at the beginning of the pulse , and is satisfied due to CB). We obtain a form ee-Dt, assuming and (valid for the visible current). is the injection efficiency into the ES. The filling rate, , is so large (about 1 GHz in our experiment) that e in our time domain. The decay rate,
| (2) |
contains information about . The average number of tunneling electrons, , can be written as e, and can be compared with the experiments described below.
In addition to the transient current, we can also measure the stable current through the GS as a reference. The ES and GS become empty before the pulse, and only the GS contributes to the stable current during the pulse [Fig. 1(f)]. Because there is no current-blocking for the stable current, the average number of tunneling electrons, , should be .
We apply a square-like pulse waveform through a dc-block (low frequency cut off at 700 Hz) and a low-loss coaxial cable (about 3 m long with a loss of 3 dB for dc - 10 GHz). There is no termination near the sample, and the reflected pulse, as shown in Fig. 1(b), is more or less the actual pulse waveform at the gate. The rise time (about 0.2 ns) of the pulse is faster than (typically about 1 ns), so the GS is not immediately occupied. The pulse, whose length, , is varied from 10 ns to 10 s, is repeated at a repetition time, , and the average current is measured.
Figure 2(b) shows one of the CB oscillations under pulse excitation. The bias voltage ( = 0.1 mV) is sufficiently large to saturate the current, but is still small to enhance energy resolution. The application of the pulse signal splits the single peak into two. Peak corresponds to the stable current through the GS for the duration of the pulse (), and the large peak on the far right is also related to the current through the GS but only for the duration of . The extra peak is the transient current through the first ES, and it appears between the two split peaks when the pulse height, , is increased further. The spacing between peaks and corresponds to the energy spacing between the GS and the ES. Each peak broadens with increasing . Probably this is due to the weak ringing structure seen in the pulse waveform or heating effects. The pulse signal also induces extra pumping current, which is very slightly visible between two peaks in the trace at = 1.4 T in Fig. 2(b) [also visible as blue region in Fig. 3(c)].
We investigated the transient and stable currents as a function of the pulse length, . We can obtain the average numbers of tunneling electrons per pulse, for the stable current through the GS, and for the transient current through the ES from the value for each peak current . Figures 2(c) and (d) are the results from different electron numbers in the dot. For both cases, depends linearly on , indicating a continuous current flow. Because tunneling rates are different, the characteristic time scale is different. For the transient current, shows saturation behavior, which can be fitted well with the single exponential function, e. Data for a constant duty ratio ( = 0.2) and for a fixed repetition time ( = 200 ns) coincide very well [Fig. 2(c)].
In principle, can be derived from using Eq. 2. We can experimentally derive the tunneling rates, and from the dc measurement, but is assumed in order to obtain . The is estimated to be about 20 MHz for 22 MHz in Fig. 2(c), and 0.8 MHz for 0.5 MHz in Fig. 2(d). In both cases and also for most of the ESs that appear in the transient current [see cross-hatch regions in Fig. 3(d)], is too small to estimate with this technique, and we can conclude the relaxation time is longer than, at least, 2 sec for the ES.
By contrast, if the relaxation is very fast ( and ), the transient current, , becomes very small. The upper bound of a measurable is 0.2 - 1 GHz under our experimental conditions (current sensitivity of 50 fA and shortest of 10 ns). We find a small transient current for the specific ES [see Fig. 3(d)] at = 1.1 - 1.2 T, and estimate the relaxation time to be about 3 ns. This is the only case where we were able to determine the actual relaxation time. Other ESs missing in the transient current spectroscopy can have a shorter relaxation time. Note that we cannot rule out other experimental reasons for the absence of other ESs, namely that the injection efficiency can be extremely small, or that the peak is greatly broadened by the pulse.
The relaxation is either too fast or too slow to allow the relaxation time to be estimated by our technique. We argue that the significantly different relaxation times are the result of spin conservation during the relaxation. If the ES and GS have the same spin, the electron in the ES quickly relaxes to the GS as a result of electron-phonon interaction (typically about 1 ns). [8, 11] By contrast, if they have different spins, the relaxation time is limited by the spin-flip process. Spin coherence time in bulk GaAs can exceed 100 ns.[2] Most of the spin relaxation mechanisms discussed for 3D or 2D electrons in GaAs are suppressed for 0D states of QDs. We expect an extremely long spin relaxation time ( 10 s) due to a small admixture of different spin states.[9] This is beyond our experimental limit (a few s), and explains the long-lived ESs we observed. In this case the long-lived ES should have different spins from that of the GS. In our experiment, the Zeeman splitting is small and unresolved. Thus the difference in the total spin is responsible for the long energy relaxation time and for the appearance of the transient current.
We can also confirm the existence of the long-lived ESs qualitatively from the dc current,[16] when the outgoing tunneling rate is much smaller than the incoming tunneling rate (simply making the bias voltage large and positive in our experiment). An electron in the ES escapes to the right lead either directly at rate or via the GS [see energy diagram of inset in Fig. 3(b)]. If , the electrons can always escape from the GS. Thus the current is given by , regardless of whether the ES is located in the transport window or not. If and , the transport through the ES can be distinguished from that through the GS. In this case, another current step appears, for example, at as indicated in Fig. 2(a). It should be noted that the magnitude of a current step for the ES is a complicated function of the tunneling rates,[17] and a simple discussion based on the dc current can sometimes be unreliable. Nevertheless, we believe that a qualitative analysis of the dc characteristics is useful if the tunneling rates are adjusted properly to distinguish the spin states. The -dependence of the spectrum at = 1 mV [Fig. 3(b)] is almost the same as that found from transient current spectroscopy [Fig. 3(c)], although the peaks in Fig. 3(c) are broadened by the pulse irradiation.
We can speculate on the characteristics of the energy states from their -dependence summarized in Fig. 3(d). At = 1.2 - 2 T, where edge states are developing in the dot, some states (, , , , , and ) are energetically decreasing with increasing . These states can be assigned to the lowest Landau level, although they have different angular momentum (slightly different slopes in the -dependence).[6] Some of the ESs ( and ) have an extremely long relaxation time (Fig. 2(d) is taken for the state at = 1.35 T), even though the GS and the ES are spatially overlapped.[18] It has been reported that the relaxation time is long if the two states are spatially separated [12] or when the two states are attributed to different edge states,[19, 20] but this is not the case here.
Although we do not see clear spin-pairing in the GSs, specific ESs are parallel to the GSs (e.g., the GS and the ES at = 0.2 - 0.6 T). A parallel pair of the states is likely to have the same orbital character but with different total spin due to exchange interactions. [5] Actually the ES exhibits a transient current with a relaxation time longer than 70 ns. The signal in the dc transport with small outgoing tunneling rate [Fig. 3(b)] also indicates a long lifetime for the ES . This evidence supports the idea of spin conservation.
Conversely, the QD spin state can be investigated using transient current spectroscopy based on the spin conservation rule. The transient current has a long time constant for the first ES if it has a different total spin from the GS, and also generally for the higher ES if it has a different total spin from any lower-lying states. We see some long lived ESs cross with the GS (e.g. the state becomes GS at 0.9 T), indicating that the total spin of the GS changes at this . The simple spin-conservation model, however, cannot explain the level crossing itself. The long-lived ESs are sometimes terminated by a crossing with the GS or with another (short-lived) ES. If the total spin does not change at the crossing, the long-lived ESs should also remain, but this is not the case. The problem of sensitivity must be studied further.
In summary, we investigated the energy relaxation time of ESs in QDs using a pulse-excitation measurement. We found that the spin relaxation time is longer than, at least, few s, which is attractive for spin-related QD applications.
We thank D. G. Austing, A. V. Khaetskii, L. P. Kouwenhoven, K. Muraki, M. Stopa, and S. Tarucha for valuable discussions and help.
REFERENCES
- [1] D. Loss and D. P. DiVincenzo, Phys. Rev. A 57, 120 (1998).
- [2] D. D. Awschalom and J. M. Kikkawa, Physics Today, June, 33 (1999).
- [3] J. A. Gupta et al., Phys. Rev. B 59, R10421 (1999).
- [4] For a review, see L. P. Kouwenhoven et al., in “Mesocopic Electron Transport” ed. L. L. Sohn, L. P. Kouwenhoven, and G. Schön, NATO ASI series E 345, pp. 105-214.
- [5] S. Tarucha et al., Phys. Rev. Lett. 77, 3613 (1996).
- [6] L. P. Kouwenhoven et al., Science 278, 1788 (1997).
- [7] S. Sasaki et al., Nature 405, 764 (2000).
- [8] U. Bockelmann, Phys. Rev. B 50, 17271 (1994).
- [9] A. V.Khaetskii and Yu. V. Nazarov, Phys. Rev. B 61, 12639 (2000), cond-mat/0003513.
- [10] J. Weis et al., Phys. Rev. Lett. 71, 4019 (1993).
- [11] O. Agam et al., Phys. Rev. Lett. 78, 1956 (1997).
- [12] T. Fujisawa et al., Science 282, 932 (1998).
- [13] T. H. Oosterkamp et al., Nature 395, 873 (1998).
- [14] T. Fujisawa and Y. Hirayama, Appl. Phys. Lett. 77, 543 (2000).
- [15] D. R. Stewart et al., Science 278, 1784 (1997).
- [16] T. H. Oosterkamp and L. P. Kouwenhoven, unpublished.
- [17] We obtain . A detailed analysis of the dc current spectrum is to be submitted.
- [18] The excitation energy spectrum remains unaffected when is changed by 15 mV, so all the states have a common set of gate capacitances. This is also evidence that the GS and the ESs overlap spatially.
- [19] N.C.van der Vaart et al., Phys. Rev. Lett. 73, 320 (1994).
- [20] S. Komiyama et al., Nature 403, 405 (2000).