Permanent address: ]National Center for Physical Acoustics and Department of Physics, The University of Mississippi, Oxford, MS 38677
Slater Transition in the Pyrochlore Cd2Os2O7
Abstract
crystallizes in the pyrochlore structure and undergoes a metal-insulator transition (MIT) near 226 K. We have characterized the MIT in using X-ray diffraction, resistivity at ambient and high pressure, specific heat, magnetization, thermopower, Hall coefficient, and thermal conductivity. Both single crystals and polycrystalline material were examined. The MIT is accompanied by no change in crystal symmetry and a change in unit cell volume of less than 0.05%. The resistivity shows little temperature dependence above 226 K, but increases by 3 orders of magnitude as the sample is cooled to 4 K. The specific heat anomaly resembles a mean-field transition and shows no hysteresis or latent heat. orders magnetically at the MIT. The magnetization data is consistent with antiferromagnetic order, with a small parasitic ferromagnetic component. The Hall and Seebeck coefficients are consistent with a semiconducting gap opening at the Fermi energy at the MIT. We have also performed electronic structure calculations on . These calculations indicate that is metallic, with a sharp peak in the density of states at the Fermi energy. We intepret the data in terms of a Slater transition. In this scenario, the MIT is produced by a doubling of the unit cell due to the establishment of antiferromagnetic order. A Slater transition—unlike a Mott transition—is predicted to be continuous, with a semiconducting energy gap opening much like a BCS gap as the material is cooled below .
pacs:
71.30.+h, 72.80.Ga, 75.40.-sI Introduction
Oxides containing second and third row () transition metals such as Mo, Ru, Re, Os, and Ir display an impressive variety of phenomena and are a good place to search for interesting new materials. Electrically, these materials range from excellent metals such as ReO3 with a room temperature conductivity about the same as Cu Sleight66 , to Mott-Hubbard insulators such as Maeno99 and Cox83 . Magnetically, we find an equally wide range of behavior, from local-moment antiferromagnetism ( Cox83 ) to weak ferromagnetism ( Cao98 ) to spin-glass behavior ( Mandrus99 ) to itinerant ferromagnetism ( Longo71 ). Some novel collective phenomena have also been discovered in materials, such as the definitely unusual (and perhaps -wave) superconductivity in Maeno94 , and the coexistence of antiferromagnetism and superconductivity in Bernhard99 Lynn2000 .
The unique properties of materials stem from the properties of the electrons themselves, which are much less localized than electrons and play a greater role in chemical bonding. Because of the increased hybridization with the coordinating O2- anions, ions are typically found in low-spin (large crystal field) configurations rather than the high-spin configurations typical of ions. The larger spatial extent of wavefunctions also means that the intra-atomic Coulomb repulsion is smaller and therefore materials are generally less strongly correlated than materials. In theoretical treatments of electron correlation, a measure of the degree of correlation is given by the ratio , where is the intra-atomic Coulomb repulsion (“Hubbard ”) and is the bandwidth. Typically, for oxides and these materials are thought to be in the “strong coupling limit.” For simple metals, on the other hand, and the “weak coupling limit” applies. oxides represent an intermediate case, however, with . This “intermediate coupling regime” has been much less studied, both experimentally and theoretically, and the exploration of this parameter space along with the expectation of uncovering new phenomena is the primary motivation for studying this class of materials.
The synthesis and initial characterization of were reported in 1974 by Sleight, et al. Sleight74 , but no subsequent publications have appeared on this compound. The physical properties reported in Ref. Sleight74, are quite intriguiging: was found to crystallize in the pyrochlore structure and to undergo a continuous, purely electronic metal-insulator transition (MIT) near 225 K. It was also found that the MIT was coincident with a magnetic transition that the authors characterized as antiferromagnetic.
In this work, we present a comprehensive re-investigation of the basic physical properties of , and have added considerable detail to the basic picture presented in Ref. Sleight74, . We find that the transition is, indeed, continuous, and that the lattice appears to be playing no discernable role in the transition. The magnetism is clearly more complex than a simple Néel state, and almost certainly involves the formation of a “strong” spin density wave (SDW). The idea that antiferromagnetic ordering can double the unit cell and for a half-filled band produce a metal-insulator transition goes back to Slater, who in 1951 proposed a split-band model of antiferromagnetism Slater51 . In this model, the exchange field favors up spins on one sublattice and down spins on another sublattice and for large reduces to the atomic model of an antiferromagnetic insulator, with a local moment on each site. The thermodynamics of the metal-insulator transition predicted by Slater’s model were worked out in a mean field approximation by Matsubara and Yokota (1954) Matsubara54 , and by Des Cloizeaux (1959) DesCloizeaux59 . In both treatments a continuous metal-insulator transition was predicted, with a semiconducting gap opening much the way a BCS gap opens in a superconductor.
These results have, of course, been largely supplanted by modern SDW theory Fazekas99 , but it must be remembered that SDW theory is unambiguously effective only in the weak coupling limit. For example, at half filling it should be possible to proceed smoothly from a weak coupling SDW state to a Mott insulating state as is increased. Although strong coupling SDW theory gets some of the aspects of the Mott insulating state right, it is wrong in other respects and must be regarded as an incomplete description Fazekas99 .
One of the major failings of strong coupling SDW theory is that the gap is predicted to disappear above the Néel temperature, whereas in true Mott insulators like CoO the gap persists despite the loss of long range magnetic order. In such materials a Mott-Hubbard description is clearly correct, but when the metal-insulator transition temperature and the Néel temperature coincide one should give careful thought as to whether a Mott-Hubbard or a Slater description is most appropriate. In such cases the thermodynamics of the MIT can provide valuable information about the underlying mechanism, because a Mott transition is expected to be discontinuous whereas a Slater transition should be continuous Mott90 . Experimentally, all of the temperature-driven MITs that have been studied in detail (e.g., , , , NiS, NiS2-xSex, PrNiO3) have been found to be discontinuous Imada98 , and this explains—at least in part—why the effects of magnetic ordering on the MIT have been largely discounted in these materials compared to the effects of the Coulomb interaction. In , on the other hand, the MIT is continuous and coincides with the Néel temperature. The Slater mechanism, then, is almost certainly at work in .
II Crystal Chemistry
belongs to a family of cubic materials known as pyrochlores Subramanian83 . Pyrochlores contain 2 nonequivalent anion positions, and so oxide pyrochlores have the general formula . Pyrochlores contain 8 formula units (88 atoms) per unit cell, and belong to the space group . There are two types of coordination polyhedra in the pyrochlore structure, and these are loosely referred to as “octahedral” and “cubic” although this is not exactly correct because the conditions for the existence of perfect octahedral and perfect cubic coordination cannot be simultaneously satisfied. In , our crystallographic results (section IV) indicate that the Os5+ ions have nearly perfect octahedral coordination, whereas the Cd2+ ions are located within scalenohedra (distorted cubes).
Several compounds with the formula are known where M5+ = Nb, Ta, Re, Ru, and Os Subramanian83 ; Donohue65 ; Wang98 . Insulating behavior is found for Nb5+ () and Ta5+ () as would be expected for a compound with no electrons in its manifold. Metallic behavior is observed, however, when M5+ is Re5+ () and Ru5+ (). The physical properties of nearly all of these materials are interesting. is a a complex ferroelectric that undergoes a series of closely spaced transitions Subramanian83 . undergoes a structural phase transition at 204 K that has yet to be fully characterized Sleight76 . is a high pressure phase that displays as yet unexplained anomalies in its resistivity and thermal expansion coefficient Wang98 .
From the discussion above it is clear that the manifold of electrons is intimately involved in the electronic conduction processes in compounds as would be expected from an elementary ionic picture of these materials. Because Os5+ is in the configuration and the manifold holds 6 electrons, it is reasonable to assume that the conduction band in is close to half filling. This condition, of course, is required for a Slater picture of the MIT to be valid.
III Sample Preparation
Both single crystals and polycrystalline material were prepared. All preparations were performed under a fume hood because of the extreme toxicity of OsO4. This oxide of osmium is extremely volatile and melts at about 40 ∘C. Exposure of the eyes to OsO4 should be strictly avoided as permanent blindness can result. Even brief exposure to the vapor is dangerous. According to the MSDS: “If eyes are exposed to the vapor over a short period of time, night vision will be affected for about one evening. One will notice colored halos around lights.”
Single crystals of were grown following a method similar to Ref. Sleight74, by sealing appropriate quantities of CdO, Os, and KClO3 in a silica tube and heating at 800 ∘C for 1 week. Shiny black octahedral crystals, up to 0.7 mm on an edge, grew on the walls of the tube. These crystals presumably grew from the vapor with OsO4 as a transport agent. Crystals from several growths were used in the experiments reported here.
Polycrystalline material was synthesized from CdO and OsO2 powders. These materials were ground together thoroughly, pressed into pellets, and sealed in a silica tubes to which an appropriate amount of KClO3 was added to provide the required oxygen. The tubes were then heated at 800 ∘C for several days. Dense polycrystalline material was produced using this method.
As explained in subsequent sections, some differences were noted in the behavior of the single crystalline vs. the polycrystalline material. Because the crystals were grown from the vapor, it is likely that the stoichiometry of the crystals is slightly different from that of the polycrystalline material. To verify this, electron microprobe measurements were performed on both types of material, and the ratio of the areas under the Cd line and the Os line were compared. The measurements indicated that the ratio of Cd to Os was slightly higher in the crystals. Because a detailed single-crystal refinement found no deviation from stoichiometry, it is likely that the polycrystalline material is slightly Cd deficient, especially given that pyrochlores tolerate significant A site vacancies Subramanian83 . Small differences in oxygen content between the single- and polycrystalline material also cannot be ruled out.
IV Crystallography
X-ray diffraction measurements on were performed using a Nonius 4-circle diffractometer equipped with Mo radiation and a nitrogen gas-stream cryo-cooler. An equant octahedral crystal, diameter 0.084 mm, was mounted on the diffractometer and nearly a full sphere of reflections was collected at 295 K assuming no systematic absences. Two smaller data sets were collected at 250 K and 180 K. Because the crystal is highly absorbing, the diffraction data were corrected for absorption analytically using the Gaussian face-indexed method. The observed systematic absences were consistent with an -centered cell. A combination of Patterson and difference Fourier mapping confirmed the ideal pyrochlore structure type at all temperatures.
The refinement results appear in Table 1. The refined room temperature lattice parameter, 10.1651(4) Å, is in good agreement with the 10.17 Å reported in Ref. Sleight74, . The cell edge exhibits a smooth contraction with temperature and there is little or no change in the structural parameters upon cooling. The refined oxygen position, 0.319(2), is close to the value of 0.3125 that gives the maximum nearest-neighbor anion separation and regular BO6 octahedra for the ideal pyrochlore structure Chako84 . The difference between the volume of the unit cell at 250 K and 180 K is (250 K) = 0.047%. This volume change implies an average linear thermal expansion coefficient (180-250 K) of a = 2.24 through the transition. This is a small but not unreasonable value, and is consistent with the relatively high value of the Debye temperature ( 400 K) estimated below from specific heat measurements. The lattice parameter was measured at a few other temperatures in the vicinity of the transition, and no anomalies were noted. The picture that emerges from the crystallographic data is that of a stiff lattice coupled only weakly to the electronic degrees of freedom.
| 180 K | 250 K | 295 K | |
| a(Å) | 10.1598(4) | 10.1614(4) | 10.1651(4) |
| Å | 1048.7 | 1049.2 | 1050.1 |
| measured reflections | 666 | 1271 | 3589 |
| independent reflections | 139 | 139 | 139 |
| reflections with | 113 | 114 | 113 |
| 0.048 | 0.049 | 0.050 | |
| 0.046 | 0.044 | 0.036 | |
| 0.224 | 0.305 | 0.305 | |
| goodness-of-fit, | 1.83 | 2.60 | 2.75 |
| reflections in refinement | 139 | 139 | 139 |
| parameters refined | 11 | 11 | 11 |
| extinction coefficient | 0.0009(3) | 0.0009(4) | 0.0011(4) |
| (O1) | 0.319(1) | 0.319(2) | 0.319(2) |
| O1 Å | 0.010(6) | 0.009(8) | 0.007(7) |
| O1 Å | 0.008(3) | 0.011(5) | 0.012(5) |
| O1 Å | 0.000(5) | 0.002(8) | 0.002(8) |
| O1 Å | 0.009(2) | 0.010(3) | 0.011(3) |
| Cd Å | 0.008(5) | 0.009(1) | 0.010(1) |
| Cd Å | -0.006(4) | -0.0007(7) | -0.0009(5) |
| Os Å | 0.0055(8) | 0.005(1) | 0.005(1) |
| Os Å | -0.0002(2) | -0.0001(3) | -0.0002(2) |
| O2 Å | 0.008(6) | 0.007(8) | 0.012(9) |
| Cd-O1 (Å) 6 | 2.57(1) | 2.57(1) | 2.57(1) |
| Cd-O2 (Å) 2 | 2.1997(4) | 2.2000(4) | 2.2006(4) |
| Os-O1 (Å) 6 | 1.926(5) | 1.926(8) | 1.928(7) |
| Os-O1-Os (∘) | 137.5(7) | 137.5(7) | 137.5(7) |
V Resistivity
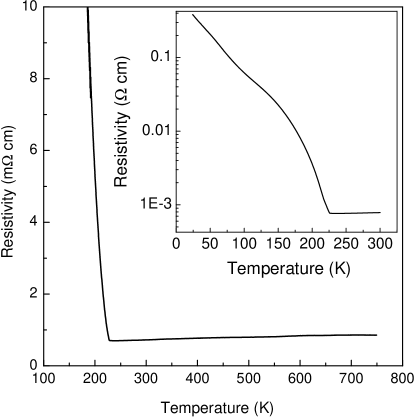
Resistance vs. temperature measurements were performed on both single crystals (SC) and polycrystalline (PC) samples, and all specimens showed a well-defined MIT at approximately 226 K. There was no indication of thermal hysteresis in the resistivity of either the PC or the SC material, consistent with the continuous nature of the MIT in this material. The measurements were performed using a linear 4-probe method, 25 m Pt wire, and Epotek H20-E silver epoxy. The resistivity of two crystals appears in Fig.1 . The room temperature resistivity was about 750 cm in both crystals. When cooled from 226 K to 5 K, the resistivity increases by three orders of magnitude. This large increase makes it likely that the entire Fermi surface has been eliminated. From 226 K to 750 K, the resistivity shows little temperature dependence. This behavior is in striking contrast to the non-saturating, strongly temperature dependent behavior of the resistivity observed in oxides such as the cuprates and in SrRuO3 Allen96 . Given the extremely weak temperature dependence observed in , the mean free path of the carriers has evidently saturated on the order of an interatomic spacing. The source of the strong scattering is evidently coulombic, and likely involves exchange interactions within the manifolds. Hund’s rules favor parallel spins within each manifold; however, for a half-full manifold, the next electron should enter with anti-parallel alignment. Therefore, in an analogy with double exchange, the system will tend toward antiferromagnetism so as to allow the electrons to hop more easily and gain kinetic energy. However, at least for localized moments, the pyrochlore lattice is geometrically frustrated Anderson56 Ramirez94 . Therefore, one possible source of the strong scattering lies in the frustration inherent in the pyrochlore lattice. Reinforcing this notion is the fact that other metallic pyrochlores, such as , also display resistivities that are practically independent of temperature Pike77 .
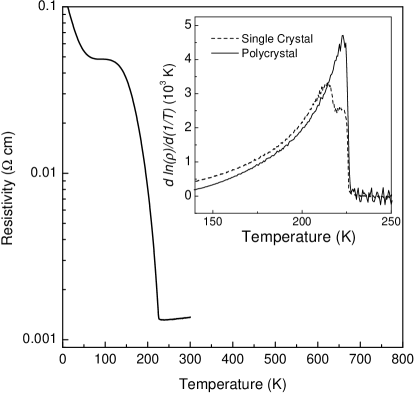
The resistivity of a PC sample of appears in Fig. 2. Qualitatively, the overall temperature dependence of the resistivity of the PC material is quite similar to that of the crystals, although the magnitude of the resistivity is of course higher in the PC material ((295 K)= 1.3 m cm). The change in resistivity upon cooling to 4 K is smaller in the PC material as well, indicating a higher concentration of impurities in this material. In the inset to Fig. 2 we plot the quantity for both SC and PC samples. This quantity has often been used to emphasize the anomalous features in the resistivity of organic conductors and SDW materials Gruner94 . The first point to notice is that although the change in the resistivity itself is smooth, the change in the logarithmic derivative of the resistivity is abrupt and resembles the specific heat anomaly (see Fig. 5). This seems consistent with the continuous (second order) nature of the phase transition. In ferromagnetic metals, for example, the derivative of the resistivity exhibits the same critical behavior as the specific heat Klein96 , and something similar seems to be going on here. The next point to notice is that the SC curve is different from the PC curve in that it displays an additional feature with an onset near 217 K. This feature is robust and has been observed at the same temperature in the 6 crystals we have measured. Furthermore, a feature at the same temperature has been observed in specific heat and magnetization measurements on crystals as described below. Although chemical inhomogeneity is a possible explanation of the 217 K feature, a number of reasons suggest that the feature may well be intrinsic. First, the feature is reproducible in all the crystals measured. Second, thinning the crystal to 50 m did not affect the magnitude or shape of the resistivity. Third, EDX spectra obtained at a number of different places on a crystal showed no differences in the Cd/Os ratio. Fourth, the x-ray refinement showed no evidence for chemical inhomogeneity. Fifth, in the case of chemical inhomogeneity, one would expect the second transition to appear as a pronounced increase in the resistivity itself (at least on a log scale), and not just as a feature in the derivative. Sixth, as discussed below, the magnetization data are more consistent with a homogeneous sample. Seventh, the method used to grow the crystals—vapor transport—is slow, gentle, and well-suited to producing homogeneous samples, although the exact stoichiometry is often difficult to control. Lastly, it should be pointed out that the observation of a second transition in a higher quality sample is not unprecedented. In the case of EuB6, for example, more than 30 years passed before the discovery of the spin reorientation transition occurring a few degrees below Sullow98 . It is possible that some sort of spin reorientation transition is occurring in as well.
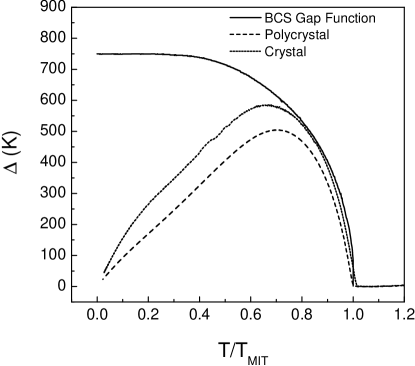
In a Slater picture of an MIT, we expect the resistivity to follow an expression of the form as has been found for quasi 1d SDW materials Gruner94 . We also expect that the temperature dependence of a Slater insulating gap will behave in much the same way as a BCS gap Matsubara54 DesCloizeaux59 . In Fig. 3 we plot the temperature dependence of the activation energy, , calculated from the experimental data using . Here is the resistivity just above the transition. Also in Figure 3 we plot a BCS gap function ( = 750 K) for comparison. As is clear from the Figure, the resistivity of is consistent with this picture at least for temperatures close to the transition. At lower temperatures the influence of extrinsic conduction mechanisms becomes increasingly important and masks the intrinsic behavior. This occurs at a higher temperature in the PC material as compared to the SC material, consistent with the greater impurity concentration in the PC material. Assuming that 750 K, we find that 6.6 . This is considerably higher than the = 3.5 predicted from weak coupling SDW theory, but, interestingly, quite similar to the / values found in cuprate superconductors.
VI Specific Heat
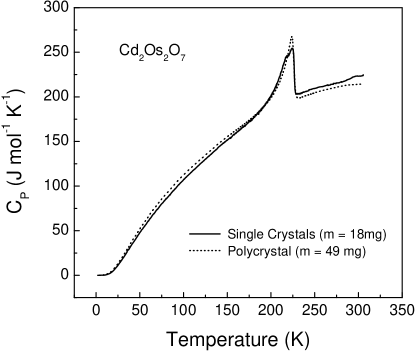
The specific heat of SC and PC from 2 K to 300 K is plotted in Fig. 4. These data were obtained using a commercial heat-pulse calorimeter manufactured by Quantum Design. The calorimeter is periodically tested against a sapphire standard to ensure reliable results.
A plot of vs. indicates that the lattice contribution above about 3.5 K is not well-described by a simple Debye model. This is not surprising because pyrochlores typically have several low frequency optical phonons Subramanian83 McCauley73 which are expected to strongly influence the low temperature heat capacity. If we fit the data between 1.9 K and 3.5 K to the low approximation , we find that for a sample consisting of about 10 single crystals (m = 18 mg) we have = 1.08 mJ/mol-K2 and = 463 K and for a polycrystalline disk (m = 49 mg) we have = 1.4 mJ/mol-K2 and = 354 K, where is the Sommerfeld coefficient and is Debye temperature in the limit . These values are much smaller than those of related (metallic) pyrochlores such as ( = 25 mJ/mol-K2) Blacklock79 and ( = 12 mJ/mol-K2) Blacklock79 and suggest that the Fermi surface is fully gapped below the MIT. This is consistent with the activation energy analysis of the resistivity discussed in the previous section.
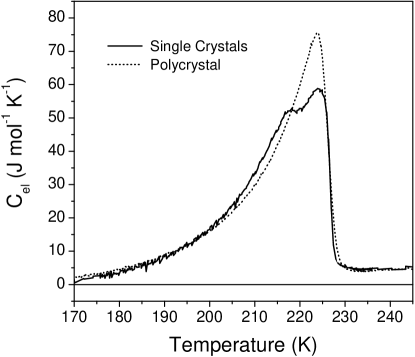
The estimated electronic contribution to the specific heat is plotted in Fig. 5. This estimate was obtained by first assuming a Sommerfeld coefficient above and subtracting off the assumed electronic contribution. Then a smooth polynomial was fitted to the data outside the region of the anomaly as an estimate of the lattice contribution. Then the lattice contribution was subtracted from the raw data. Sommerfeld coefficients between 0 and 30 mJ/mol-K2 were explored, but the entropy analysis described below is relatively insensitive to the precise value of the assumed . A of 20 mJ/mol-K2 was used to produce Fig. 5. This value is in the range of the Sommerfeld coefficients reported on the metallic pyrochlores mentioned above and is meant to provide a reasonable estimate of the entropy of the itinerant electrons at temperatures above the MIT.
The shape of the specific heat anomaly resembles a mean-field, BCS-type transition. In single crystals there are two features in the specific heat analogous to the features in the plots discussed earlier. No hysteresis was observed in the specific heat measurements; the data taken upon cooling or warming, were, within the scatter, indistinguishable. Given that there is no hysteresis, no latent heat, and a volume change of less than 0.05%, we conclude that the MIT in is continuous.
Let us now consider how electronic entropy is eliminated as . A system of localized electrons has a large electronic entropy of order per magnetic ion, where is the degeneracy of the ground state of the atomic electrons subject to Hund’s rule and crystal field interactions. In this case, entropy is typically eliminated as by a transition to a magnetically ordered state. In a system of itinerant electrons, on the other hand, the specific heat is given by , and the Pauli principle ensures that the entropy vanishes as . In , we can estimate the entropy associated with the MIT by integrating from 170 K to 230 K. Depending on the assumed value of above , the answer ranges (in single crystals) from = 5.4 J/mol-K ( mJ/mol-K2) to = 6.6 J/mol-K ( mJ/mol-K2) and (in polycrystals) from = 5.6 J/mol-K ( mJ/mol-K2) to = 6.8 J/mol-K ( mJ/mol-K2). For an assumed of 20 mJ/mol-K2 we have = 6.2 J/mol-K (SC) and = 6.5 J/mol-K (PC).
Localized Os5+() ions are expected to have spin-3/2 and to eliminate = 23.0 J/mol-K via a magnetic transition. This is clearly much higher than the observed value, and suggests that the transition does not involve ordering of localized moments. Even if we assume that spin-orbit coupling breaks the degeneracy of the manifold making the ions effectively spin-1/2, we still expect an entropy of = 11.5 J/mol-K which is again significantly higher than the observed value. It seems more reasonable to identify SMIT with the entropy of an itinerant electron system above the MIT. If we make this association, S(230 K) = 4.6 J/mol-K for mJ/mol-K2 and S(230 K) = 6.9 J/mol-K for mJ/mol-K2. These numbers are much closer to the observed values and support the notion that the entropy associated with the MIT in is simply that of the itinerant electron system above TMIT. This picture is consistent with what we expect from a Slater transition.
VII Magnetization
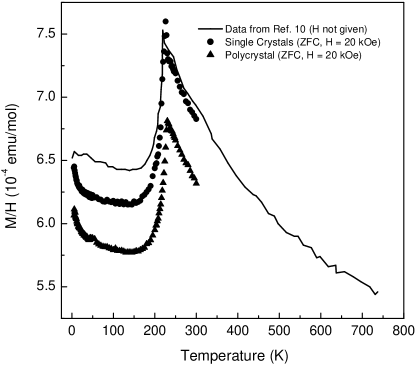
Magnetization measurements were performed on using a SQUID magnetometer from Quantum Design. The measurements were performed by cooling the sample in zero field, turning on the magnet, and then measuring the moment as the sample was warmed (ZFC) and then re-cooled (FC). In Fig. 6 we plot vs. T (ZFC, H = 20 kOe) for SC and PC samples and for comparison we plot the magnetic susceptibility data obtained on single crystals from Ref. Sleight74, . The SC results are in good quantitative agreement. The magnetic response of the PC material is somewhat weaker, but qualitatively the agreement is good. According to Ref. Sleight74, , the data from 226-750 K do not obey a Curie-Weiss law. If, as we concluded from the specific heat analysis, the system above is a moderately correlated metal, we do not expect the magnetic response to obey a Curie-Weiss law. What we expect is an exchange-enhanced Pauli paramagnetic response, and the data are fully consistent with that.
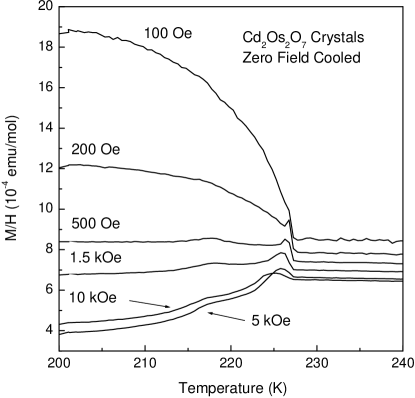
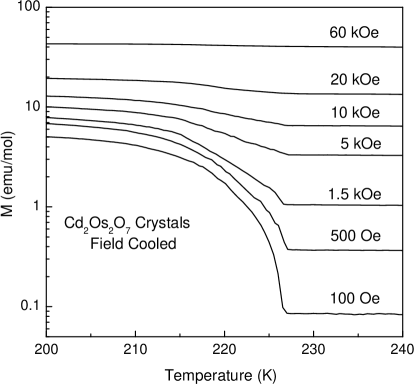
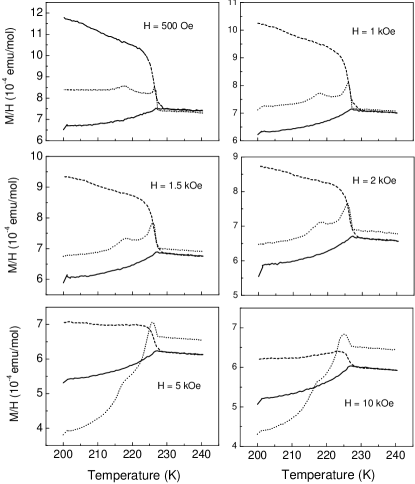
In Figs. 7 and 8 we present ZFC and FC results obtained on SC samples for a number of applied fields. In Fig. 9 we present similar data for the PC material, with the SC ZFC results included for comparison. The magnetic interactions appear to be predominantly antiferromagnetic, although a parasitic ferromagnetic component is clearly present. Parasitic ferromagnetism is observed in many antiferromagnetic materials (including SDW materials like -Mn) and is characterized by small moments and by hysteresis with high coercive forces. Parasitic ferromagnetism is produced by defects in an antiferromagnetic background becoming “frozen-in”. A good phenomenological account of parasitic ferromagnetism is given by Arrott Arrott66 . Isothermal magnetization curves were reversible at all temperatures, except for a narrow interval just below the MIT.
At 5 K and 1000 Oe, the ZFC net moment is 1.0 emu/mol = per formula unit; the corresponding FC moment is 12 times larger. The field dependence of the ZFC magnetization is unusual as shown in Figs. 7 and 9. Note that the SC data obtained in magnetic fields between 500 Oe and 10 kOe show clear evidence of a well-defined transition at 227 K and a broader transition near 217 K. These features correlate with similar features observed in the resistivity and specific heat as discussed earlier. It is interesting that at higher applied fields the 217 K feature becomes weaker and is not visible in the 20 kOe data shown in Fig. 6. The magnetization data provides further evidence that the additional feature at 217 K in the single crystals is likely to be intrinsic. If the SC samples were chemically inhomogeneous, with some portions ordering at 226 K and other portions ordering at 217 K, then one would expect to see an additional feature near 217 K in the FC data in Fig. 8. The lack of a feature near 217 K in the FC data is good evidence that the entire sample has ordered antiferromagnetically at 226 K.
It is difficult to imagine that is simply a local-moment antiferromagnet. In the first place, magnetically ordered Os compounds are extremely rare and materials in general tend to have low ordering temperatures. Secondly, the pyrochlore lattice is known to be geometrically frustrated Ramirez94 Anderson56 and for antiferromagnetic nearest-neighbor interactions no long range order is predicted in the absence of further-neighbor interactions Reimers91 . In fact, antiferromagnetism is quite rare in pyrochlores Subramanian83 . Given all this, a Néel temperature of 226 K is remarkably high and demands explanation.
VIII Electrical and Thermal Transport


Thermopower, Hall, and thermal conductivity measurements were performed only on PC samples due to the difficulty of performing these measurements on extremely small crystals. For the thermopower and thermal conductivity experiments the sample was a dense rod, 20 mm long and 8 mm in diameter. The apparatus used for the thermopower and thermal conductivity measurements has been described previously sales97 . This apparatus has been used extensively in thermoelectrics research and has been tested repeatedly against silica and stainless steel standards. The Seebeck data were corrected for the absolute thermopower of the Cu leads. Hall measurements were performed in a 4-probe geometry at 30 kOe and 80 kOe. At each temperature, the sample was rotated 180∘ and the current reversed in order to eliminate misalignment and thermal voltages, respectively. Checks were made at several temperatures to ensure that the Hall voltage was linear in current.
In Fig. 10 we plot the Seebeck coefficient of vs. temperature. Above , the thermopower is small and positive. As the sample is cooled, the thermopower increases from about 2 V/K at 295 K to 6 V/K at 230 K. Such small Seebeck coefficients are characteristic of metals. As the sample is cooled below , the behavior of the thermopower changes drastically, first increasing to +40 V/K near 200 K, and then changing sign and decreasing to -225 V/K near 90 K. Although this behavior is complicated, it is clearly consistent with a gap opening at the Fermi energy and a change from metallic behavior above to semiconducting behavior below .
The Hall coefficient of appears in Fig. 11. Above the magnitude of is small as expected for a metal. The differing signs of the Hall and Seebeck coefficients indicate that both electrons and holes are participating in the electrical transport and preclude a simple one-band analysis of the data. Even with contributions from two types of carrier, however, the Hall number can still give a useful order-of-magnitude estimate of the carrier concentration. In this spirit, we find that the room temperature Hall number is cm-3 and the room temperature Hall mobility is = 0.6 cm2 V-1 s-1. These values are similar to other metallic oxides such as and are not wildly different from cuprate superconductors Tsuda91 .
Interestingly, no dramatic change in the Hall coefficient occurs until the sample is cooled to 200 K—well below . This is understandable if one imagines that a gap is opening as illustrated in Fig. 3. When then thermal energy ensures that both bands are equally populated and the carrier concentration hardly changes; it is only when that the carrier concentration begins to fall and the magnitude of the Hall coefficient begins to increase. The behavior of the thermopower is also understandable at a phenomenological level. As explained pedagogically by Chaikin Chaikin90 , the thermopower is a measure of the heat carried by the electrons and/or holes. As soon as a gap opens in the excitation spectrum, the thermopower of both the electrons and holes increases because the carriers are now transporting the additional energy required to create an electron-hole pair. The measured thermopower is a weighted average of the electron and hole thermopowers, but if both electron and hole thermopowers increase in magnitude it stands to reason that the weighted average is also likely to increase as the cancellation between the electron and hole contributions is unlikely to be exact.


The thermal conductivity of a polycrystalline sample of appears in Fig. 12. Below 150 K, the thermal conductivity resembles that of an ordinary crystalline solid—rising from zero at low temperature, peaking near 50 K, and falling off as at higher temperatures. However, near 150 K the thermal conductivity begins rising again in an unusual way. Although radiation losses can produce these high temperature “tails” in the thermal conductivity of low materials, is it unlikely that radiation losses are causing the rise here because our apparatus has been optimized for use on low thermal conductivity samples. For example, silica samples roughly the same size as the sample of required no radiation correction in our apparatus even though the thermal conductivity of silica is roughly half that of . A more likely explanation of the data can be understood from the simplest expression of the lattice thermal conductivity of a solid which is given by , where is the heat capacity per unit volume, is an average sound velocity, and is the mean free path. What is likely to be happening in is that the mean free path of the phonons does not decrease any more above 150 K due to strong scattering, and that the rise in thermal conductivity simply reflects the heat capacity which is still increasing due to the relatively high Debye temperature of this material.
The MIT is reflected in the thermal conductivity as shown in the inset to Fig. 12. The effect is remarkably small considering the large changes in the electronic structure that are occurring at the transition. To quantify things, we plot in Fig. 13 the change in thermal conductivity we would expect if the electronic portion of the thermal conductivity were given by the Wiedemann-Franz (WF) law. The WF law states that the ratio between and is given by where W/K2. To produce Fig. 13 we used the WF law to estimate the electronic contribution to the thermal conductivity above , and then used the WF law and the measured resistivity to predict the change in thermal conductivity we would expect if the WF law were obeyed in . As is clear from the Figure, the predicted change is much greater than the measured change. There are three possible reasons for this discrepancy, and all are interesting. The first is that the lattice contribution to the thermal conductivity increases as the sample is cooled below . This possibility is consistent with the overall behavior of the thermal conductivity discussed above. In this scenario the phonons are strongly scattered by some sort of electronic excitations above , but below the transition these excitations disappear and the mean free path of the phonons increases. Elastic modulus measurements can shed some light on the viability of this picture, and these measurements are planned for the near future. The second possibility is that magnetic excitations are contributing to the thermal conductivity below . Measurements of the magnetic structure and dynamics would be useful here. Lastly, the third possibility is that the WF law is simply not obeyed in . The WF law is empirical and is not perfectly obeyed in real materials, although deviations as large as observed here are not common. Calculations by Schultz and Allen Schultz95 show that as the scattering mechanism changes the Lorentz number can vary between 0 (pure Coulomb scattering) and (pure electron-phonon scattering). The Lorentz number we infer from the analysis above is . Further study is required to resolve these matters.
IX Pressure dependence
In the case of the Mott-Hubbard transition, the pressure dependence has helped to understand the underlying physics. To study further the nature of the phase transition in Cd2Os2O7, we have measured the temperature dependence of the resistivity of a single crystal under hydrostatic pressures up to 20 kbar. The pressure cell was a self-clamping piston-cylinder cell using kerosene as pressure medium. An InSb pressure sensor was mounted next to the sample, and pressure was monitored during cooling. Typical pressure drop was 1 to 2 kbar during cool-down.
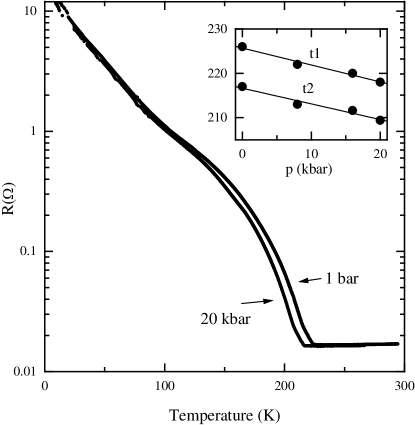
In Figure 14 we show the temperature dependence of the resistivity at ambient pressure and at 20 kbar. The two curves virtually lie on top of one other, except between about 150 K and the MIT transition region. The two transitions shift to lower temperatures at the same rate of about -0.4 K/kbar. This is twenty times smaller than the pressure-induced shift of the Mott-transition in pure V2O3 V2O3carter . We have also measured the pressure dependence of the room temperature resistivity, which is small, -0.18%/kbar (not shown).
These features suggest a rigid lattice to which electrons couple only weakly. In the case of V2O3, the strong pressure dependence of the MIT is due to about 1% volume change at the transition. In our material no change beyond thermal expansion in the unit cell volume was detected at the transition temperature thus the much weaker pressure dependence is natural. Since the Slater transition is not critically sensitive to bandwidth as opposed to the Mott transition, this result is not surprising. In V2O3, pressure also changes the activation energy in the insulating state since for a narrow band the bandwidth increases exponentially with pressure, and the Mott-Hubbard gap decreases linearly with the bandwidth, . Performing the same analysis as described in the previous section, we did not find any change in the gap.
X Electronic Structure

The full-potential linearized augmented plane wave (LAPW) method in the WIEN97 code blaha was used for the electronic structure calculations. In this method the unit cell is partitioned into spheres (with a muffin-tin radius ) centered on the atomic positions. This method is an application of density-functional theory in which the Kohn-Sham equations are solved in a basis of linearized augmented plane waves with local orbital extensions. For the exchange and correlation potential the generalized gradient approximation (GGA) of Perdew-Burke-Ernzerhof was used perdew . The core electrons are treated relativistically, whereas the valence electrons are treated with a scalar non-relativistic procedure. The space group for this cubic pyrochlore compound, , is face-centered and it requires four inequivalent atoms — Cd, Os, O(1) and O(2). The calculation we report here is non-spin-polarized (not magnetically ordered) and the structural parameters from Table I are used. For the Cd the states up to are taken as core states, for Os the core states are up to , and for the O is taken to be the core state. The plane-wave cutoff is and we used 56 points in the irreducible wedge of the Brillouin zone.
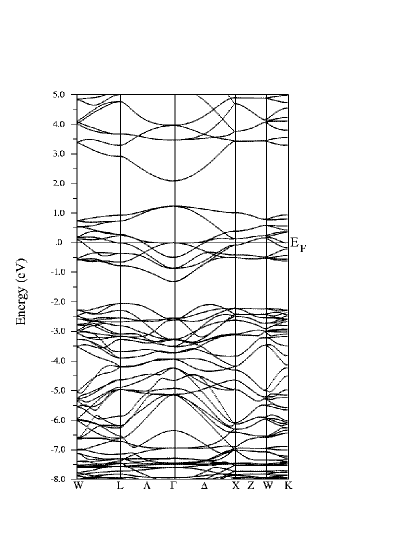
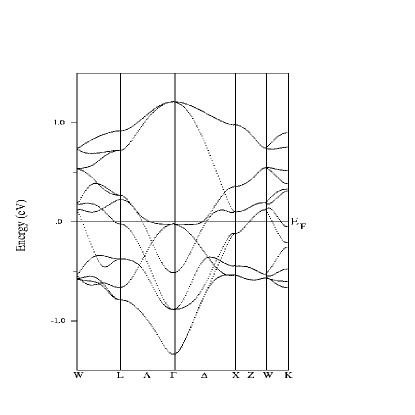
The band structure of is presented in Figs. 15 and 16. A flat band around the -point crosses ; therefore, the non-spin-polarized calculation predicts that this material is a metal. This is, of course, precisely what we expect above in a Slater scenario. The states near the Fermi energy have mainly Os character, but there is significant O character as well. The unoccupied Os band is located roughly 0.8 eV above the band. We also performed a similar calculation with the addition of spin-orbit coupling. We find that the band structure in this case is the same as in Fig. 15, but the bands shift upwards slightly by 0.08 eV.
Now we examine the corresponding density of states (DOS). The total electronic density of states (DOS) is presented in Fig. 17a and Fig. 18. A sharp peak at the Fermi energy reaches = 25.4 states/eV and implies a Sommerfeld coefficient = 29.9 mJ/mol-. Interestingly, this value is in good agreement with the estimates made in Section VI. Fig. 17b presents the partial DOS of the Os and O(1). The Os-O(1) distance of 1.93 Å is small enough to allow significant mixing of the Os and O states. From Fig. 17b the hybridization between the two is evident. Finally, Fig. 16c displays the partial DOS of the Cd and O(2). Hybridization here is also present, and these states have a presence at . A similar effect was noticed in another pyrochlore material, , where the hybridization not only between Mn and one of the O was found, but also between Tl and the other O singh . In , the hybridized Tl-O states needed to be taken into account in order to reproduce the correct magnetic moment of . Similarly, these results suggest that hybridization between Os-O(1) and Cd-O(2) may be important in understanding the magnetism in this compound.

XI Conclusion
In this work we have characterized the metal-insulator transition in using a variety of experimental techniques and have argued that a coherent picture of the transition emerges if the data are interpreted in terms of a Slater transition. Although the possibility of a Slater transition has occasionally been mentioned in the study of metal-insulator transitions (e.g., under pressure Carter91 V2O3carter ), appears to be the first well-documented example of a pure Slater transition and therefore merits further study. Particularly needed are theoretical studies in the intermediate coupling regime (). This is the regime that characterizes many materials and promises to yield many intriguing discoveries in the years ahead.
Acknowledgements.
We thank J. He for assistance with the Hall measurements and S. E. Nagler, J. O. Sofo, S. A. Trugman, G. Murthy, and J. Zaanen for helpful conversations. Oak Ridge National laboratory is managed by UT-Battelle, LLC, for the U.S. Department of Energy under contract DE-AC05-00OR22725.References
- (1) A. Sleight and J. Gillson, Solid State Comm. 4, 601 (1966).
- (2) Y. Maeno, S. Nakatsuji, and S. Ikeda, Mat. Science and Engineering B63, 70 (1999).
- (3) P. Cox, R. Egdell, J. Goodenough, A. Hamnett, and C. Naish, J. Phys. C 16, 6221 (1983).
- (4) G. Cao, J. Bolivar, S. McCall, J. E. Crow, and R. P. Guertin, Phys. Rev. B 57, R11039 (1998).
- (5) D. Mandrus, V. Keppens, and B. C. Chakoumakos, Mat. Res. Bull. 34, 1013 (1999).
- (6) J. M. Longo, J. A. Kafalas, and R. J. Arnott, J. Solid State Chem. 3, 174 (1971).
- (7) Y. Maeno, H. Hashimoto, K. Yoshida, S. Nishizaki, T. Fujita, J. G. Bednorz, and F. Lichtenberg, Nature 372, 532 (1994).
- (8) C. Bernhard, J. L. Tallon, C. Niedermayer, T. Blasius, A. Golnik, E. Brücher, R. K. Kremer, D. R. Noakes, C. E. Stronach, and E. J. Ansaldo, Phys. Rev. B 59, 14099 (1999).
- (9) J. W. Lynn, B. Keimer, C. Ulrich, C. Bernhard, and J. L. Tallon, Phys. Rev. B 61, R14964 (2000).
- (10) A. W. Sleight, J. L. Gillson, J. F. Weiher, and W. Bindloss, Solid State Comm. 14, 357 (1974).
- (11) J. C. Slater, Phys. Rev. 82, 538 (1951).
- (12) T. Matsubara and Y. Yokota, in Proc. Int. Conf. Theor. Phys., Kyoto-Tokyo 1953 (Sci. Council Japan, Tokyo, 1954), p. 693.
- (13) J. Des Cloizeaux, J. Phys. Radium, Paris 20, 606 (1959).
- (14) P. Fazekas, Lecture Notes on Electron Correlation and Magnetism (World Scientific, Singapore, 1999).
- (15) N. F. Mott, Metal-Insulator Transitions (Taylor and Francis, London, 1990).
- (16) M. Imada, A. Fujimori, and Y. Tokura, Rev. Mod. Phys. 70, 1039 (1998).
- (17) M. A. Subramanian, G. Aravamudan, and G. V. S. Rao, Prog. Solid State Chem. 15, 55 (1983).
- (18) P. C. Donohue, J. M. Longo, R. D. Rosenstein, and L. Katz, Inorg. Chem. 4, 1152 (1965).
- (19) R. Wang and A. W. Sleight, Mat. Res. Bull. 33, 1005 (1998).
- (20) A. W. Sleight and J. D. Bierlein, Solid State Comm. 18, 163 (1976).
- (21) B. C. Chakoumakos, J. Solid State Chem 53, 120 (1984).
- (22) P. B. Allen, H. Berger, O. Chauvet, L. Forro, T. Jarlborg, A. Junod, B. Revaz, and G. Santi, Phys. Rev. B. 53, 4393 (1996).
- (23) P. W. Anderson, Phys. Rev. 102, 1008 (1956).
- (24) A. P. Ramirez, Ann. Rev. Mater. Sci. 24, 453 (1994).
- (25) G. E. Pike and C. H. Seager, J. Appl. Phys. 48, 5152 (1977).
- (26) G. Grüner, Rev. Mod. Physics 66, 1 (1994).
- (27) L. Klein, J. S. Dodge, C. H. Ahn, G. J. Snyder, T. H. Geballe, M. R. Beasley, and A. Kapitulnik, Phys. Rev. Lett. 77, 2774 (1996).
- (28) S. Sullow, I. Prasad, M. C. Aronson, J. L. Sarrao, Z. Fisk, D. Hristova, A. Lacerda, M. F. Hundley, A. Vigliante, and D. Gibbs, Phys. Rev. B 77, 5860 (1998).
- (29) R. A. McCauley, J. Opt. Soc. Amer. 63, 721 (1973).
- (30) K. Blacklock and H. W. White, J. Chem. Phys. 71, 5287 (1979).
- (31) A. Arrott, in Magnetism, edited by G. T. Rado and H. Suhl (Academic Press, New York, 1966), vol. IIB.
- (32) J. N. Reimers, A. J. Berlinsky, and A.-C. Shi, Phys. Rev. B 43, 865 (1991).
- (33) B. C. Sales, D. Mandrus, B. C. Chakoumakos, V. Keppens, and J. R. Thompson, Phys. Rev. B 56, 15081 (1997).
- (34) N. Tsuda, K. Nasu, A. Yanase, and K. Siratori, Electronic Conduction in Oxides (Springer-Verlag, Berlin, 1991).
- (35) P. M. Chaikin, in Organic Superconductivity, edited by V. Z. Krezin and W. A. Little (Plenum Press, New York, 1990).
- (36) W. W. Schultz and P. B. Allen, Phys. Rev. B 56, 7994 (1995).
- (37) S. A. Carter, T. F. Rosenbaum, M. Lu, H. M. Jaeger, P. Metcalf, J. M. Honig, and J. Spalek, Phys. Rev. B 49, 7898 (1994).
- (38) P. Blaha, K. Schwarz, P. Sorantin, and S. B. Trickey, Comput. Phys. Commun. 49, 399 (1990).
- (39) J. P. Perdew, S. Burke, , and M. Ernzerhof, Phys. Rev. Lett. 77, 3865 (1996).
- (40) D. J. Singh, Phys. Rev. B 77, 3865 (1997).
- (41) S. A. Carter, J. Yang, T. F. Rosenbaum, J. Spalek, and J. M. Honig, Phys. Rev. B 43, 607 (1991).