Multi-scale modeling of poly(isoprene) melts
Abstract
Atomistic (atom-scale) and coarse-grained (meso-scale) simulations of structure and dynamics of poly-isoprene melts are compared. The local structure and chain packing is mainly determined by the atomistic details of the polymer architecture. The large-time dynamics encountered in NMR experiments can be explained by meso-scale simulations including stiffness. The connecting link between the two scales is the stiffness which, although being a local property, influences strongly even the long-timescale dynamics. The standard reptation scenario fails to explain the observed dynamics. We propose strong reptation as a modified reptation scenario in which the local Rouse motion is absent.
Keywords: Poly-isoprene, Modeling, Molecular Dynamics
1 Introduction
The large abundance of polymers and their variety of applications make them an interesting target of study in theoretical material science. The understanding of the differences and similarities of the various materials is an important prerequisite for the goal of CAMD - computer aided materials design. The dream of chemical engineers would be to develop in the workstation the perfect material for a given purpose.
To come closer to this distant goal, much effort in various fields is necessary. As polymeric materials are characterized by the importance of various length scales, the understanding of the interplay between these scales is of utmost importance. Methods adapted to all relevant scales are needed from the experimental as well as from the theoretical or simulational viewpoint. In simulations, much work has been directed recently of the issue of coarse-graining, the mapping of simulations on different scales, in order to get a unified view of the arising scales [1, 2, 3, 4, 5]. In the present contribution we show that atomistic simulations of trans-polyisoprene (PI) [6] can be mapped onto a simple bead-spring model incorporating exclude volume, connectivity, and stiffness [7, 8]. With this simple model we can investigate the long-time dynamics of chains in the melt. There is evidence for reptation which qualitatively changes with stiffness [9, 10]. This connects to results of modern NMR experiments [11] which we can reproduce to a satisfactory extent [8, 12]. Thus, simulations on both scales and especially their connection reveal different important aspects of the system under study.
The remainder of this contribution is organized as follows. In section 2 a short review about our recent results of atomistic simulations of Trans-PI is given. In section 3 results of simulations on the meso-scale level, where the polymer identity is put into a simple stiffness parameter, are presented. In the concluding section the important concept of stiffness is discussed and it is shown that stiffness is sufficient to allow a mapping for the polymer presented here.
2 Local Structure and Dynamics - The atomistic scale
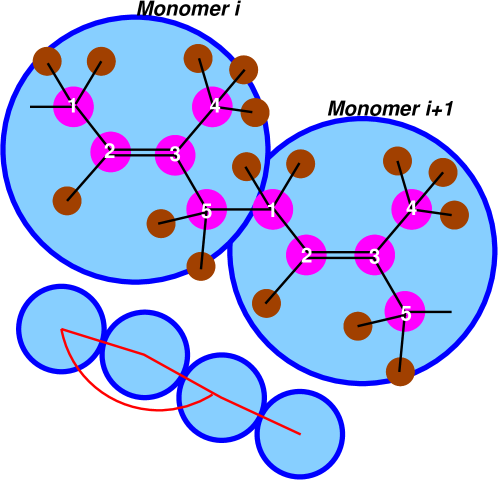
The atomistic structure of oligomers of trans-1,4-polyisoprene (cf. Figure 1) was investigated. For details of the simulations and the interaction potentials see refs. 9, 6. Here we only note that the simulation box contains 100 oligomers of average length 10 monomers of pure trans-poly-isoprene which were pre-equilibrated using end-bridging Monte Carlo [13, 14] at the ambient condition of 300 K or the elevated temperature of 413 K. All atomistic simulations are run at 101.3 kPa.
 |
The main result is, that the local structure is very important for properties on the sub-monomer length scale. Figure 2 shows the local mutual packing of chains by means of radial distribution functions of the different atoms in the melt. The carbons show a distinct peak at next neighbor contact. The hydrogens, in contrast, show very little structure. Thus, we encounter a carbon backbone with a surrounding “hydrogen cloud”. This can be taken as a first hint that not all details are necessary for every simulation. Still, the hydrogens had to be taken into account for the CH vector reorientation. This is important for direct comparison to NMR experiments (below). The comparison to experimental raw data is always a good and necessary validation of simulation models [12].


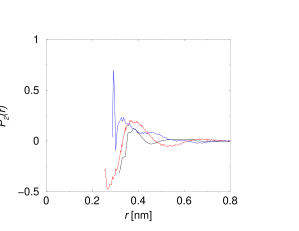
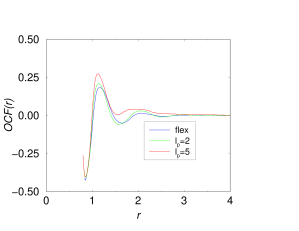
The local packing is additionally reflected by the directionality of chains at contact. This is shown in Figure 3 by means of the spatial orientation correlation function of the double bonds
| (1) |
where is the angle between tangent unit vectors on two different chains. The distance is measured between their centers of mass. The unit vectors may be defined in different manners, e.g. the double bonds in Figure 3 are one possibility to denote the direction of a monomer.
 |
Direct comparisons to experiments [15, 16, 17] and simulations [18, 19] on cis-polyisoprene proof that our model is realistic [6, 9].
The reorientation of the hydrogens is subject to a two-stage process (cf. Fig. 4).
 |
The first stage is a fast initial decay on the time-scale of the segmental motion, i.e. the motion on the monomer or sub-monomer scale. On the second time-scale the reorientation of the whole oligomer becomes important. Overall, reorientation is monitored by the following correlation function
| (2) |
Here, is the angle by which a given bond vector reoriented in time . The second Legendre polynomial is chosen as it is the relevant quantity in NMR measurements. The effectivity of the two stages may be measured by fitting double exponential decays to the obtained correlation functions. In doing so, satisfactory ageement with experiments could be achieved (cf. Table 1) if we keep in mind that the investigated systems are not completely identical. The experiments were performed on mixtures with a high cis-PI content and longer chains.
In section 3.2 comparisons of the long-time dynamics of the corresponding simple model with experiments will be presented.
3 Global Structure and Dynamics - Meso-scale simulations
Simple polymer models allow one to investigate large-scale phenomena both in time and space which are not accessible by atomistic simulations. Therefore many researchers employed such models to look for rather generic polymer properties or dynamical concepts [20, 21, 22, 23, 24, 25]. One of these important concepts is reptation [26, 27]. The reptation concept explains much of the molecular weight dependence of viscosity and the elastic and loss moduli [27]. However, this model originates in the simple Rouse model [28] where no stiffness is included or it is subsumed into simple Kuhn blobs [29].
In order to look for the influence of stiffness, a three-body potential for stiffening the backbone has therefore to be introduced [30, 7, 8]
| (3) |
The force constant in this choice of units has the same numerical value as the resulting intrinsic persistence length (below), and is therefore denoted as .
3.1 Statics
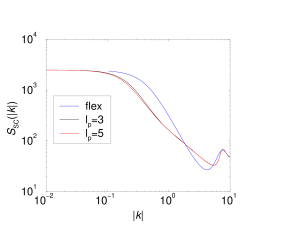
In polymer melts excluded volume is commonly assumed to be screened out. Thus, we can expect that polymer chains behave as random walks [27]. This is true at least on large length scales. All local interactions only result in local chain stretching. This is seen easily in the single chain static structure factors of model chains [7] (cf. Figure 5). The random walk appears in the fractal dimension of on the length scale bigger than the persistence length. The fractal dimension expresses itself in the slope of the structure factor. The chains with stiffness bend over to a weaker slope indicating a smaller fractal dimension at higher . The persistence length originates from the Kratky-Porod worm-like chain picture [31]; measures the decay length of bond correlations along the chain backbone.
 |
Thus, static properties of different models and chains are easily mapped onto each other by the simple blob concept where all local interactions are put into one single length scale, which then allows a renormalization onto flexible chains with the blobs acting as coarse-grained monomers. The size of the Kuhn blob and the persistence length differ only by the constant factor of 2 although they arise from different concepts.
Still, even in chains of complete flexibility, i.e. no three-body potential, there is a small but visible alignment between neighbouring chains, similar to that shown in Figs. 3 and 6 on the length scale of about 3 chain diameters [24]. This is evidence that the very simple ansatz of model chains only incorporating connectivity comes to its limits as soon as many-body interactions come into play. As we have seen in section 2 local interactions affect strongly the mutual packing of chains. If chain stiffness is increased, chain order becomes stronger [7] (cf. Fig. 6) without leading to an overall nematic order. This ordering is a strictly local phenomenon which is proven by the fact that there is no chain length dependence whatsoever [24].
 |
3.2 Dynamics
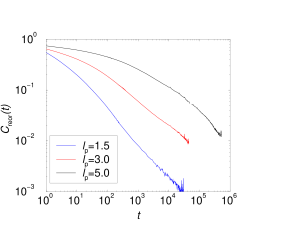
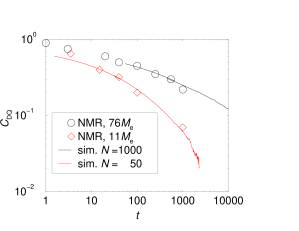
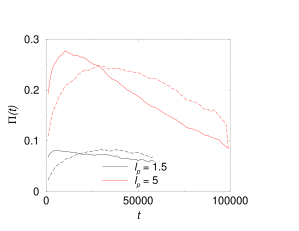
For simple flexible bead-spring chains the reptation concept was successfully validated by several simulations [22, 23, 25]. However, NMR experiments of polymer reorientation show that this model cannot describe all polymers satisfactorily. For poly-(dimethylsiloxane), PDMS, which is known to be very flexible the results of double quantum NMR can be explained by the simple reptation model [32] whereas for polybutadiene this simple explanation shows strong deficiencies [11]. For this purpose the reorientation behaviour of entangled melts depending on stiffness was investigated [8]. With increasing stiffness the reorientation slows down tremendously going hand in hand with a decreasing entanglement length and shrinking tube diameter [10]. The reorientation of backbone segments is algebraic on short time scales (cf. figure 7). This algebraic dependence is the same as found in NMR experiments. The exponents of and as seen in figure 8 are both found. However, there is a qualitative change in dynamics with chain length as the entanglement length is crossed. The exponent of is not found in unentangled chains.
 |
 |
| 1 | 32 |
|---|---|
| 1.5 | 15 |
| 3 | 8 |
| 5 | 6 |
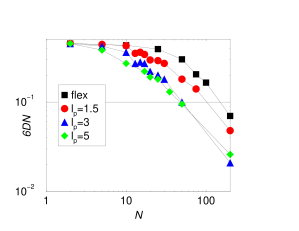
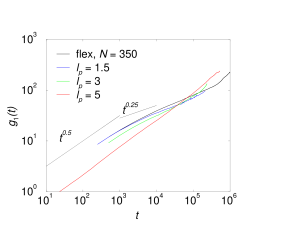
In diffusion also the entanglement length scale is found. Chains longer than diffuse clearly slower than predicted by simple Rouse motion (Figure 9). According to the Rouse model the overall diffusion is expected to be . This would correspond to a horizontal straight line in figure 9. Reptation leads to which we find for longer chains. The crossover point can be taken as a definition for the entanglement length [10] (Table 2). We observe that the entanglement length decreases with increasing persistence length.
 |
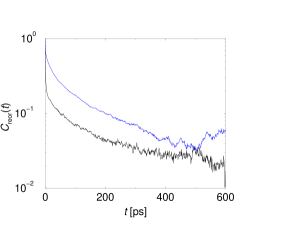
and are neither independent nor linearly dependent on each other. This makes it impossible to renormalize stiff chains onto the simple bead-spring model, as only one length scale could be scaled away. The influence of stiffness survives on very long length scales. The entanglement length describes the anisotropy of motion of a chain due to the temporary network of its uncrossable neighbors. A polymer chain has to move predominantly along its backbone as transversal motion is hindered by the neighbors leading to an effective tube (cf. Figure 10). This is measured by the correlation of directions of the chain (static ) with the motion of the monomer in time (dynamic ).
| (4) |
This function measures the correlation between the static direction of a chain segment at a given point in time with the direction of its dynamic motion in the time therafter. Thus, it shows that chain segments move in the beginning preferably along their contour. This is exactly what reptation is about.
 |
Increasing stiffness supports this effect as the stiffness suppresses the transversal motion even further. On short time-scales where in the standard reptation picture isotropic motion is still possible the local stiffness disallows this motion. Thus, the chains have to reptate from the very beginning. This is illustrated by the mean-squared displacements of inner monomers ( cf. Figure 11).
 |
According to the standard reptation picture one expects the scenario we find here only for flexible chains. On short time-scales a Rouse motion [28] is found , then the Rouse motion is constrained to the tube . After the internal degrees of freedom are relaxed the chain as a whole moves in the tube and finally the chains reach the free diffusion . The other extreme we now see for chains with a persistence length of five monomers. The first two dynamical regimes are missing completely, as the Rouse motion is no more the correct description of the polymer especially on the short scales (see Figure 12). This regime we like to call strong reptation. Similar results have been obtained by Morse [33, 34, 35] for chains of stronger stiffness, who introduced the terms loosely entangled and strongly entangled for the different systems, respectively.
Note the intersections of the different curves in Figure 11. This shows that there are regimes where stiffer chains diffuse even faster as the entanglement length and tube diameter come down tremendously. This can also be seen if we look at dynamical structure factors [10] which can measure the tube diameter.


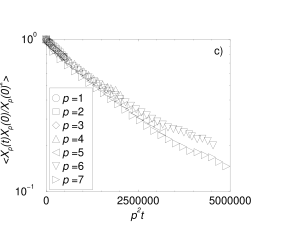
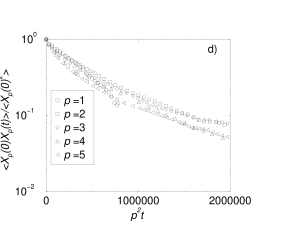
If the Rouse model was applicable in all sub-figures of Figure 12 all curves would fall on top of each other as the Rouse modes
| (5) |
with the position of bead and the monomer number would be the true eigenmodes of the system and the time in Figure 12 is rescaled accordingly. However, we see that with increasing stiffness and chain length the model shows deficiencies. Because of stiffness the high modes (local motion) start to be affected and for long chains the entanglements hinder the low modes (large scale) motion. As the entanglement length shrinks with stiffness the Rouse regime is eaten up between the entangled motion on the one side and the local stiffness on the other.
4 Conclusions: Stiffness - A decisive characteristics
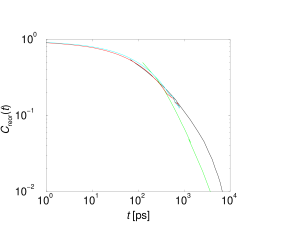
Two different polymer models were introduced. A bead-spring model with stiffness and a fully detailed atomistic model. Both are validated against different experiments. The connecting link between the models is the backbone stiffness which survives from the very local scale to the global scale on which often only entanglements are expected to be important. In Figure 13 one sees the success of the mapping. The atomistic chains at 413 K and model chains (also of length 10) are compared (one monomer to one monomer mapping). The mapping is accomplished by rescaling (squared) lengths with the mean-squared end-to-end distance. Time-scales are fixed by the center-of-mass diffusion. Then the figure shows the comparative reorientation of local monomer-to-monomer vectors. Thus, this study opens one possible route to polymer coarse graining: Simulate an atomistic melt (of short chains) in full detail, there you can investigate all the very local observables (sub-monomer to monomer-scale) like radial distribution functions, orientation correlations up to structure functions and reorientation times. Also one has to determine the persistence length of the polymer on this scale. This is then taken as an input to the model on the next length scale, so that part of the polymer identity is preserved and a tremendous simulation speedup is possible at the same time. At this scale, long-time dynamic phenomena like reptation and large scale static structure like the overall Gaussian random walk distribution can be looked into.
 |
However, one has to be very careful with this mapping. There are polymers for which this route is too simple-minded, especially if the monomer is strongly anisotropic or has special or bulky side-groups. More elaborate methods have to be applied then [1, 4]. Our method can be applied to dense melts of simple hydrocarbon polymers and allows in this case a very strong speedup and a look on real large scale phenomena. With the other methods typically an intermediate scale between the two presented scales here is introduced as additional length scales can become important. Still, for dynamic issues it is not possible even on the largest scale to explain everything with simple chains only, at least stiffness has to be taken into account.
Acknowledgments
Many fruitful discussions with Markus Deserno, Burkhard Dünweg, Ralf Everaers, Andreas Heuer, Kurt Kremer, Heiko Schmitz and Doros Theodorou gave valuable ideas to our work. Additionally, financial support by the German Ministry of Research (BMBF) is gratefully acknowledged.
References
- [1] Tschöp, W., Kremer, K., Batoulis, J., Bürger, T., Hahn, O., Simulation of polymer melts. I. Coarse-graining procedure for polycarbonates. Acta Polymer 1998;49(2-3):61.
- [2] Tschöp, W., Kremer, K., Hahn, O., Batoulis, J., Bürger, T., Simulation of polymer melts. II. From coarse-grained models back to atomistic description. Acta Polymer 1998;49(2-3):75.
- [3] Baschnagel, J., Binder, K., Doruker, P., Gusev, A. A., Hahn, O., Kremer, K., Mattice, W. L., Müller-Plathe, F., Murat, M., Paul, W., Santos, S., Suter, U. W., Tries, V., Bridging the gap between atomistic and coarse-grained models of polymers: Status and perspectives. Adv Polymer Sci 2000;152:41.
- [4] Meyer, H., Biermann, O., Faller, R., Reith, D., Müller-Plathe, F., Coarse graining of nonbonded interparticle potentials using automatic simplex optimization to fit structural properties. J Chem Phys 2000;113(15):6264.
- [5] Reith, D., Meyer, H., Müller-Plathe, F., Mapping atomistic to coarse-grained polymer models using automatic simplex optimization to fit structural properties, 2000, submitted to Macromolecules, cond-mat/0008338.
- [6] Faller, R., Müller-Plathe, F., Doxastakis, M., Theodorou, D., Local structure and dynamics in trans polysisoprene, 2000, submitted to Macromolecules.
- [7] Faller, R., Kolb, A., Müller-Plathe, F., Local chain ordering in amorphous polymer melts: Influence of chain stiffness. Phys Chem Chem Phys 1999;1(9):2071.
- [8] Faller, R., Müller-Plathe, F., Heuer, A., Local reorientation dynamics of semiflexible polymers in the melt. Macromolecules 2000;33(17):6602.
- [9] Faller, R., Influence of chain stiffness on structure and dynamics of polymers in the melt. PhD thesis, MPI für Polymerforschung and Universität Mainz, 2000, published at http://archimed.uni-mainz.de/pub/2000/0063.
- [10] Faller, R., Müller-Plathe, F., Chain stiffness intensifies the reptation characteristics of polymer dynamics in the melt, 2000, submitted to Chem. Phys. Chem., cond-mat/0005192.
- [11] Graf, R., Heuer, A., Spiess, H., Chain-order effects in polymer melts probed by 1H double-quantum NMR spectroscopy. Phys Rev Letters 1998;80(26):5738.
- [12] Müller-Plathe, F., Schmitz, H., Faller, R., Molecular simulation in polymer science: Understanding experiments better. Prog Theor Phys Kyoto Supplements 2000;138:311.
- [13] Pant, P. V. K., Theodorou, D. N., Variable connectivity method for the atomistic Monte Carlo simulation of polydisperse polymer melts. Macromolecules 1995;28(21):7224.
- [14] Mavrantzas, V. G., Boone, T. D., Zervopoulou, E., Theodorou, D. N., End-bridging Monte Carlo: A fast algorithm for atomistic simulation of condensed phases of long polymer chains. Macromolecules 1999;32(15):5072.
- [15] Dejean de la Batie, R., Lauprêtre, F., Monnerie, L., Carbon-13 NMR investigation of local dynamics at temperatures well above the glass-transition temperature. 3. cis-1,4-polybutadiene and cis-1,4-polyisoprene. Macromolecules 1989;22(1):122.
- [16] Denault, J., Prud’homme, J., Carbon-13 nuclear overhauser effect and molecular motion in bulk elastomers. Macromolecules 1989;22(3):1307.
- [17] Zorn, R., Richter, D., Farago, B., Frick, B., Kremer, F., Kirst, U., Fetters, L. J., Comparative-study of the segmental relaxation in polyisoprene by quasi-elastic neutron-scattering and dielectric-spectroscopy. Physica B 1992;180 & 181(Part A):534.
- [18] Moe, N. E., Ediger, M. D., Molecular dynamics computer simulation of local dynamics in polyisoprene melts. Polymer 1996;37(10):1787.
- [19] Moe, N. E., Ediger, M. D., Calculation of the coherent dynamic structure factor of polyisoprene from molecular dynamics simulations. Phys Rev E 1999;59(1):623.
- [20] Grest, G. S., Kremer, K., Molecular dynamics simulation for polymers in the presence of a heat bath. Phys Rev A 1986;33(5):R3628.
- [21] Rigby, D., Roe, R.-J., Molecular dynamics simulation of polymer liquid and glass. II. Short range order and orientation correlation. J Chem Phys 1988;89(8):5280.
- [22] Kremer, K., Grest, G. S., Dynamics of entangled linear polymer melts: A molecular-dynamics simulation. J Chem Phys 1990;92(8):5057.
- [23] Dünweg, B., Grest, G. S., Kremer, K., Molecular dynamics simulations of polymer systems. In: Whittington, S. G., editor, Numerical Methods for Polymeric Systems, vol. 102 of IMA Volumes in Mathematics and its Applications, Springer, 1998 pp. 159–196.
- [24] Faller, R., Pütz, M., Müller-Plathe, F., Orientation correlations in simplified models of polymer melts. Int J Mod Phys C 1999;10(2 & 3):355.
- [25] Pütz, M., Kremer, K., Grest, G. S., What is the entanglement length in a polymer melt ? Europhysics letters 2000;49(6):735.
- [26] de Gennes, P.-G., Reptation of a polymer chain in the presence of fixed obstacles. J Chem Phys 1971;55(2):572.
- [27] Doi, M., Edwards, S. F., The Theory of Polymer Dynamics, vol. 73 of International Series of Monographs on Physics. Oxford: Clarendon Press, 1986.
- [28] Rouse, P. E., A theory of linear viscoelastic properties of dilute solutions of coiling polymers. J Chem Phys 1953;21(7):1272.
- [29] Kuhn, W., Über die Gestalt fadenförmiger Moleküle in Lösungen. Kolloid Z 1934;68(1):2.
- [30] Micka, U., Kremer, K., Persistence length of weakly charged polyelectrolytes with variable intrinsic stiffness. Europhysics letters 1997;38(4):279.
- [31] Kratky, O., Porod, G., Röntgenuntersuchung gelöster Fadenmoleküle. Recl Trav Chim Pays Bas 1949;68:1106.
- [32] Callaghan, P. T., Samulski, E. T., The molecular weight dependence of nuclear spin correlations in entangled polymeric liquids. Macromolecules 1998;31(11):3693.
- [33] Morse, D. C., Viscoelaticity of concentrated isotropic solutions of semiflexible polymers. 1. Model and stress tensor. Macromolecules 1998;31(20):7030.
- [34] Morse, D. C., Viscoelaticity of concentrated isotropic solutions of semiflexible polymers. 2. Linear response. Macromolecules 1998;31(20):7044.
- [35] Morse, D. C., Viscoelasticity of tightly entangled solutions of semiflexible polymers. Phys Rev E 1998;58(2):R1237.