Stability of inverse bicontinuous cubic phases in lipid-water mixtures
Abstract
We investigate the stability of seven inverse bicontinuous cubic phases (, , , , , , ) in lipid-water mixtures based on a curvature model of membranes. Lipid monolayers are described by parallel surfaces to triply periodic minimal surfaces. The phase behavior is determined by the distribution of the Gaussian curvature on the minimal surface and the porosity of each structure. Only , and are found to be stable, and to coexist along a triple line. The calculated phase diagram agrees very well with experimental results for 2:1 lauric acid/DLPC.
pacs:
PACS numbers: 68.10.-m, 61.30.Cz, 87.16.DgMost of the many mesomorphic phases formed by lipid-water mixtures are of the inverse type, with the self-assembled lipid monolayers curving towards the aqueous regions [1]. In inverse bicontinuous cubic phases, a single lipid bilayer extends throughout the whole sample, dividing it into two percolating water labyrinths. Until now, the structures , and have been identified. The only known lipid-water system in which , and coexist is 2:1 lauric acid/DLPC and water [2]. The property of cubic lipid bilayer phases to divide space into interwoven polar and apolar compartments is utilized for biological function, e.g. in mitochondria and the endoplasmic reticulum [3]. Recently, they have also been used as artificial matrices which enable membrane proteins like bacteriorhodopsin to crystallize in a three-dimensional array [4].
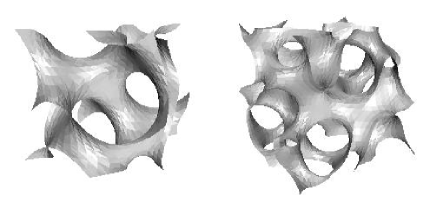
It was shown by Luzzati and coworkers [5] that the mid-surfaces of the lipid bilayers are very close to cubic minimal surfaces, which have zero mean curvature everywhere. These surfaces occur in lipid-water systems due to the local symmetry of the lipid bilayer, which implies that the surface should curve to both sides in the same way. However, it is well known [6] that many more cubic minimal surfaces exist than the structures , and identified in lipid-water mixtures. What might be the reason that these other phases have not been observed so far? Helfrich and Rennschuh [7] have argued, based on the curvature model for fluid membranes [8], that structures with a narrow distribution of Gaussian curvature over the minimal mid-surface should be most favorable. However, the relevant data was known to them only for , and , which are degenerate in this respect due to the existence of a Bonnet transformation. Recently, we obtained numerical representations for a large number of cubic minimal surfaces in the framework of a simple Ginzburg-Landau model [9]. In this Letter we use this data to investigate seven inverse bicontinuous cubic phases (, , , , , , ). For an illustration of the and surfaces, see Fig. 1. We find that the width of the different distributions of Gaussian curvature is indeed smallest for , and and larger for all other structures considered. This proves for the first time why only , and should be observed experimentally.
Our detailed investigation of the stability of bicontinuous cubic phases shows that the existence of the Bonnet transformation implies that with increasing water concentration, , and coexist along a triple line. We show that this sequence is determined by an universal geometrical quantity, the topology index, and that higher order terms in the curvature energy and thermal membrane undulations do not lift this degeneracy. Furthermore, we calculate phase diagrams as function of concentration and temperature, which are in good agreement with an intermediate temperature range of the experimental phase diagram for 2:1 lauric acid/DLPC and water [2].
The main contributions to the free energy of an inverse bicontinuous cubic phase are the curvature energy of the lipid monolayers and the stretching energy of the hydrocarbon chains [10]. The curvature energy is described by the Canham-Helfrich Hamiltonian [8]
| (1) |
where and are mean and Gaussian curvature, respectively, and the integral runs over the neutral surface of the monolayer. The model parameters are spontaneous curvature , bending rigidity and saddle-splay modulus . In the following, positive mean curvature corresponds to curvature towards the aqueous regions. The stretching energy can be taken to be harmonic about the average chain extension . In order to attain optimal free energy, the neutral surfaces of the two monolayers should realize at the same time constant mean curvature and constant distance to the minimal mid-surface. Since this is not possible geometrically, the system will always be frustrated. The relative distribution of the frustration on bending and stretching energies depends on . In a simple polymeric model (which certainly overestimates the chain compressibility of lipid monolayers), bending rigidity and stretching modulus scale as and , respectively [11], and the ratio of the two energies scales as , where is the lattice constant. For low water content, where , stretching is important and the bicontinuous cubic phases are suppressed by the hexagonal phase. In this Letter we consider the opposite limit, where the stretching energy dominates and the layer thickness is nearly constant. We model the two monolayers as parallel surfaces at distances away from the minimal mid-surface. Their geometrical properties are thus given by
| (2) |
With these relations, the curvature energy of the lipid bilayer can be expressed in terms of the geometrical properties of the minimal mid-surface.
Our analysis shows that each (inverse) bicontinuous cubic phase is characterized by two dimensionless numbers, and , which are sufficient to describe its stability and phase behavior. is the width of the distribution of Gaussian curvature over the surface and will be discussed in more detail below. The topology index can be motivated as follows. For a two-dimensional surface embedded in three-dimensional space, there exist three motion-invariant and additive functionals of the shape: surface area , Euler characteristic and integrated mean curvature. For triply periodic minimal surfaces, the integrated mean curvature vanishes. The values for and depend on lattice constant and choice of unit cell, but one ratio can be constructed which does not. We define this universal quantitiy to be the topology index , where is the volume of the unit cell. It describes the porosity of a structure (the larger its value, the smaller is the connectivity) and has been investigated extensively by Hyde and coworkers [12]. The gyroid is the least porous of the known triply periodic minimal surfaces since it divides space into labyrinths with 3-vertices only. Then comes which has both 3- and 4-vertices, and , which has 4-vertices only. All other structures involve higher-coordinated vertices. In Table I we collect values for for all cubic minimal surfaces considered in this Letter. The values for , , and are exact since exact (Weierstrass) representations are known. , and are related by a Bonnet transformation, which changes the geometrical properties globally (i.e. shape in embedding space, topology, space group and lattice constant) but not locally (i.e. metric and curvatures). The values of for , and given in Table I follow from our numerical representations as isosurfaces of scalar fields which we obtained recently from a simple Ginzburg-Landau model for ternary amphiphilic systems [9]; due to numerical limitations, they are not too accurate but can be expected to appear at the correct position in the overall sequence.
For a given cubic minimal surface with surface area and Euler characteristic per conventional unit cell, the hydrocarbon volume fraction of the corresponding inverse bicontinuous cubic phase is given by
| (3) |
It turns out that for all seven structures considered the lattice constant in units of chain length is very well approximated by over the whole range of (for , the bicontinuous structures begin to self-intersect). The average mean curvature of the monolayers as a function of is
| (4) |
In the following, spontaneous curvature is measured in units of . Eq. (4) implies that a given spontaneous curvature is attained at the hydrocarbon volume fraction . Hence if all structures considered were stable, for increasing water concentration we would expect them to appear in a sequence of decreasing topology index, i.e. in the sequence - - - - etc.
The stability of the different phases is determined by the free energy per unit volume. In the absence of thermal fluctuations, the free energy density can be written in dimensionless units as
| (6) | |||||
where the integration extends over the minimal mid-surface in a conventional unit cell. Here we defined and . The curvature model (1) is well-defined for . varies over the surface, but can be shown to be invariant under a Bonnet transformation. Higher-order terms in the curvature energy of the monolayers would result in expressions involving higher powers of the combination . The free energy density of the lamellar phase is .
Eq. (6) can also be expressed in the form of an effective curvature energy for the lipid bilayer (like Eq. (1) for the monolayers). From an expansion for small chain length , one obtains an infinite series in powers of Gaussian curvature . In particular, the effective value for the saddle-splay modulus of the lipid bilayer is found to be . Since increases linearly with the spontaneous curvature of the monolayers, the cubic bicontinuous phases are favored for , even though of the monolayers is assumed to be negative.
The first (bending) term in Eq. (6) measures the deviation of the monolayers’ mean curvature from the spontaneous curvature. It follows from Eq. (2) that a narrow distribution of Gaussian curvature over the minimal mid-surface translates into a narrow distribution of mean curvature over the monolayer, which is favorable in terms of the bending term, as pointed out by Helfrich and Rennschuh [7]. For a more detailed analysis, we note that the bending term is an area average of a complicated function of its Gaussian curvature , which is distributed non-uniformly over the surface. We proceed by first measuring the distribution of Gaussian curvature over the minimal surface. Even in the case of a known Weierstrass representation, the function is analytically not tractable and has to be determined numerically in the form of a histogram . Its knowledge allows to replace the area integral in Eq. (6) by a (one-dimensional) integral over Gaussian curvature. We obtained for , , and from their Weierstrass representations and for , and from our numerical representations. A short description of the procedure in both cases and plots of the histograms obtained are given in Ref. [9]. In order to quantify the width of the different distributions, we calculate where the average is over the surface and normalized. Like the topology index , is independent of scaling and choice of unit cell. Moreover, it can be shown that it is also invariant under Bonnet transformations. The values for for the seven structures considered are given in Tab. I. We find that it is the smallest for , and and higher for all other structures. Thus we conclude that although for given the different structures have different optimal values for according to their topology index, only , and will have small frustration due to the relatively small variation of mean curvature over their monolayers.
Since the quantity in Eq. (6) is invariant under a Bonnet transformation, the free energy densities for , and obey a scaling form , with a universal function which can be read off from Eq. (6). For small , this function has , a minimum at , and diverges at . An analytical Maxwell construction for this scaling function shows that the Bonnet-related structures form a triple line, such that the coexisting values of scale with . Moreover the triple line includes an excess water phase at . The coexistence with an excess phase is known as emulsification failure from surfactant systems [11]: if the swelling with water reaches the point where the structure adapts best to the given spontaneous curvature, any additional water is just expelled into an excess phase.
In addition to the bending energy, thermal fluctuations have to be taken into account for the calculation of phase diagrams. In the case of the lamellar phase, the membrane undulations give rise to a steric repulsion [13], which in our case reads
| (7) |
where [14]. In the bicontinuous cubic phases, the fluctuations of the mid-plane lead to a renormalization of and [15]. However, since multiplies the average mean curvature squared, which vanishes for the mid-plane, only the renormalization of at length scale has to be taken into account. We identify the typical length scale of a cubic structure with . This implies , so that in Eq. (6) gets renormalized, with
| (8) |
Therefore the scaling form of the free energy remains unchanged both by higher order terms in the curvature energy and by thermal undulations, although the scaling function itself changes.
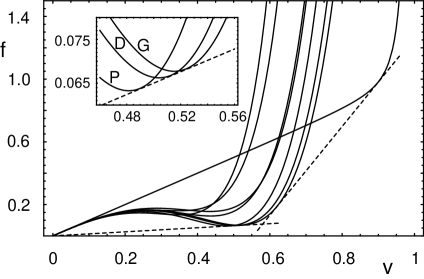
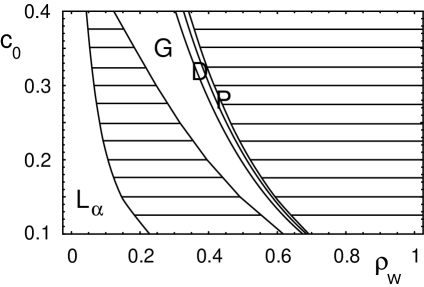
In Fig. 2, we plot the free energy densities for , and . As predicted from our general results above, we find that , and are indeed the only stable cubic phases and that they become stable along a triple line, which is the lower straight line. The same line also marks the Maxwell construction for the emulsification failure, the coexistence of P with an excess water phase. These curves for different values of allow the construction of phase diagrams for given and as shown in Fig. 3. Note that without any further interactions, is only stable along a line in our calculation. We therefore do not show two-phase coexistence regions between the three bicontinuous cubic phases in Fig. 3, but only the intersections of the free-energy curves. With increasing , the regions of stability shift to higher values of as predicted by Eq. (4).
The existence of the triple line implies that subtle differences in the free energies, which arise from a more detailed treatment of stretching contributions, of thermal fluctuations, or of van der Waals or electrostatic interactions, can be expected to destroy the degeneracy between , and . This explains qualitatively why all three cubic phases are rarely observed in the same system.
We can now compare our results with the experimental phase diagram for 2:1 lauric acid/DLPC and water, the only known experimental system in which , and coexist. Since the head group region is much smaller than the tail region of the lipid, we can identify the hydrocarbon volume fraction with the lipid concentration. Further, a linear relation between and can be assumed, since it is well established in non-ionic surfactant systems. In both phase diagrams, the sequence - - - - is observed with increasing water concentration . For , the temperature range from to in the phase diagram of 2:1 lauric acid/DLPC and water corresponds roughly to the range to in spontaneous curvature . Experimentally, the hexagonal phase dominates at higher temperatures and large hydrocarbon volume fraction, and fluidity is lost at lower temperatures (with the main transition at ). An extrapolation of the linear fit shows that the balanced temperature is located near , i.e. well below the temperature of the main transition.
USS gratefully acknowledges support by the Minerva foundation.
REFERENCES
- [1] J. M. Seddon and R. H. Templer, in Structure and dynamics of membranes, Vol. 1A of Handbook of biological physics, edited by R. Lipowsky and E. Sackmann (Elsevier, Amsterdam, 1995), pp. 97–160.
- [2] R. H. Templer et al., J. Phys. Chem. B 102, 7251; ibid. 7262 (1998).
- [3] T. Landh, FEBS Letters 369, 13 (1995); V. Luzzati, Curr. Opin. Struct. Biol. 7, 661 (1997).
- [4] E. Pebay-Peyroula, G. Rummel, J. P. Rosenbusch, and E. M. Landau, Science 277, 1676 (1997).
- [5] P. Mariani, V. Luzzati, and H. Delacroix, J. Mol. Biol. 204, 165 (1988).
- [6] A. H. Schoen, NATO Technical report D-5541 (Washington D.C., 1970); W. Fischer and E. Koch, Z. Kristallogr. 179, 31 (1987).
- [7] W. Helfrich and H. Rennschuh, J. Phys. (Paris) Colloq. 51, 189 (1990).
- [8] P. B. Canham, J. Theor. Biol. 26, 61 (1970); W. Helfrich, Z. Naturforsch. C 28, 693 (1973).
- [9] U. S. Schwarz and G. Gompper, Phys. Rev. E 59, 5528 (1999).
- [10] D. M. Anderson, S. M. Gruner, and S. Leibler, Proc. Natl. Acad. Sci. USA 85, 5364 (1988); P. M. Düsing, R. H. Templer, and J. M. Seddon, Langmuir 13, 351 (1997).
- [11] S. A. Safran, Adv. Phys. 48, 395 (1999).
- [12] S. T. Hyde, J. Phys. Chem. 93, 1458 (1989); S. T. Hyde, Curr. Opin. Solid State Mat. Sci. 1, 653 (1996); A. Fodgen and S. T. Hyde, Eur. Phys. J. B 7, 91 (1999).
- [13] W. Helfrich, Z. Naturforsch. A 33, 305 (1978).
- [14] G. Gompper and D. Kroll, Europhys. Lett. 9, 59 (1989).
- [15] F. David, in Statistical mechanics of membranes and surfaces, edited by D. Nelson, T. Piran, and S. Weinberg (World Scientific, Singapore, 1989), pp. 157–223.
| G | D | P | I-WP | S | F-RD | C(P) | |
|---|---|---|---|---|---|---|---|