Abstract
Abstract Low- Brillouin spectra of the incipient
ferroelectric KTaO3 exhibit a broad central peak (CP), and additional
Brillouin doublets (BD), that can both be related to phonon-density fluctuations.
On the basis of new high-resolution neutron data obtained of low-lying phonon
branches, we analysed the phonon-kinetics mechanisms that are possibly the origin
of these unusual features. Firstly, transverse acoustic (TA) phonons whose normal
damping is faster than the BD frequency can produce hydrodynamic second
sound. Secondly, two-phonon difference scattering from low damping thermal
transverse phonons contribute to the spectra with either a sharp or a broader
doublet, depending on the phonon group velocity and anisotropy of dispersion
surfaces. The position of the observed sharp doublet is consistent with both
mechanisms, but a comparison of the computed and experimental anisotropies favours
the second process.
Keywords quantum paraelectrics, inelastic neutron and Brillouin scattering, second sound, two-phonon difference scattering, phonon-density-fluctuation processes.
THE EXTRA BRILLOUIN DOUBLETS AND CENTRAL PEAK OF KTaO3 :
SECOND SOUND vs. TWO-PHONON DIFFERENCE SCATTERING
E. FARHIa,b, A.K. TAGANTSEVc,
B. HEHLENa, R. CURRATb,
L.A. BOATNERd, and E. COURTENSa
a Laboratoire des Verres, Université de Montpellier 2, F-34095 Montpellier, France
b Institut Laue Langevin, BP 156, 38042 Grenoble Cedex 9, France
c Laboratoire de Céramique, EPFL, CH-1015 Lausanne, Switzerland
d Solid State Division, Oak Ridge Nat. Lab., Oak Ridge, TN 37831-6056, USA
1 INTRODUCTION
Both KTaO3 and SrTiO3 perovskite-type crystals exhibit ferroelectric transition-like features with decreasing temperature. Their dielectric constant, , increases as the energy of the associated Brillouin zone (BZ) centre transverse optic (TO) mode decreases following the classical Curie-Weiss law. However, zero-point quantum fluctuations prevent critical mode condensation and the crystal remains paraelectric down to the lowest temperatures (). Such a material is then called a quantum paraelectric (QPE) [1, 2, 3]. The proximity of the soft TO and acoustic modes near BZ centre might significantly modify low- phonon kinetics. The case of SrTiO3 is more complicated than KTaO3, since SrTiO3 undergoes a well-known structural transition at K [4, 5, 6]. Below this temperature, the unit cell doubles and the crystal usually forms domains. In addition to this experimental difficulty, the description becomes more involved due to the presence of three additional low frequency branches. For this reason, we first investigate KTaO3, which remains in a cubic space group symmetry down to the lowest temperatures.
Many inelastic neutron-scattering [7, 8, 9], Raman [10], infrared [11, 12], Rayleigh-Brillouin [13, 14, 15], dielectric[16], thermal [17] or mechanical [18] studies highlighted numerous anomalies in pure KTaO3 crystals at low temperature. Particularly, Hehlen et al. [14, 15] observed an extra Brillouin doublet (BD) with a sound-like dispersion relation in KTaO3 and SrTiO3. In KTaO3, it is seen for 25 K along <001> and <110> directions. This new excitation seems to appear on top of the quasi-elastic broad central peak (CP) first reported by Lyons and Fleury [13].
The aim of this paper is to analyse the BD and CP anomalies in pure KTaO3 in terms of classical phonon kinetics, i.e. in terms of phonon-density-fluctuation-induced light-scattering. In Section 2, we present some new Brillouin measurements studying the anisotropy of the CP and doublets along the three principal symmetry axes. High-resolution data for low energy dispersion branches are obtained using inelastic neutron-scattering, as described in Section 3. Experimental results are then used to describe low energy phonon dispersion surfaces around the BZ centre by mean of a simple phenomenological parameterisation. Using such a model, we shall show (Section 4) that the anomalous Brillouin contributions may originate from either two-phonon difference scattering (TPDS) or second sound (2S) processes, but the observed anisotropy seems to favour the former.
2 BRILLOUIN SCATTERING EXPERIMENTS
The KTaO3 Ultra High Purity crystals were grown by one of us (LAB) at ORNL by ’modified spontaneous nucleation’ within a slowly cooled flux. The light-scattering spectra were excited using a single-mode argon-ion laser operating at 5145 Å and observed in backscattering configuration along the three crystal principal directions. The momentum exchange was = 5.6 10-3 Å-1. The temperature was varied between 5 and 300 K. The spectra were analysed by mean of a six-pass tandem interferometer that provides an excellent contrast and suppresses the overlap of orders [19].
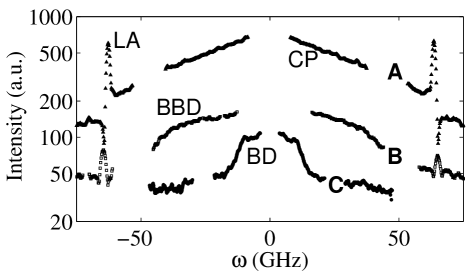
Figure 1 shows typical spectra for various temperatures and // <110>. For 100 K, an intense CP appears, strongly coupled with the LA phonon (curve A). As the temperature is decreased, the CP contribution becomes weaker, and an unexpected new broad Brillouin doublet (BBD) grows upon its shoulders (curve B). For 25 K, the sound-like BD contribution, first observed by Hehlen et al. [14] below 22 K, can be measured (curve C), with a corresponding speed 1100 m/s. It exhibits a width of typically 6 GHz. Along the <001> direction, the BBD excitation is not seen, while along <111>, no BD appears at temperatures as low as 5 K, and the CP is broader than along other directions below 100 K [20]. The CP is clearly coupled to acoustic phonons along the <110> and <111> directions.
3 LOW ENERGY PHONON DISPERSION CURVES
AND THEIR PARAMETERISATION
In order to analyse the origin and the anisotropy of excitations CP, BD and BBD in terms of phonon based processes, we parameterised the low energy phonon dispersion surfaces, which are still significantly populated under 100 K in KTaO3. A more ambitious modelisation has already been performed along high symmetry axis [9] using the polarisability model [9, 21] but it requires both substantial computations and the determination of 15 parameters in order to be applied just along the three principal directions.
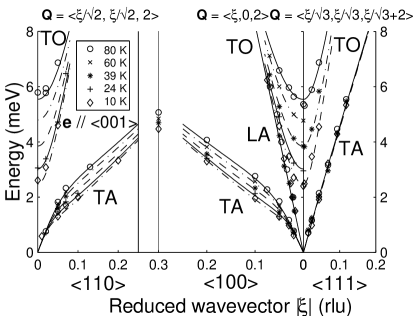
As the precision of the previous studies were not sufficient for our purpose, we performed new high-resolution inelastic neutron-scattering measurements on IN14 at the Institut Laue Langevin (ILL), Grenoble, France [20, 22]. By taking into account a 4-dimensional modelisation of the instrumental resolution ellipsoid and of the anisotropic phonon dispersion surfaces, it was possible to measure phonon branches (Figure 2) with a typical energy resolution of 0.1 meV. This enabled a direct comparison of the soft mode energy (2.6 meV at 10 K) and damping (0.07 meV at 10 K) with Hyper Raman results near BZ centre [10]. Some off-principal axis experiments were also performed. Acoustic phonon dampings could not be measured, setting a maximum value of about 0.05 meV from instrument resolution.
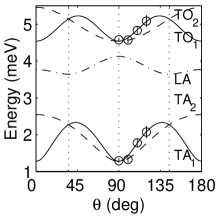
These Brillouin and neutron-scattering measurements, enabled us to apply the Vaks parameterisation [23, 24, 25] on the five lowest phonon modes for temperatures below 100 K, in the whole central part of BZ ( < 0.2 rlu) where phonon dispersion surfaces are significantly populated [20, 22]. Such a model requires the determination of only 8 parameters, 4 of which can be measured directly by mean of light-scattering. The resulting curves along high symmetry axes are shown in Figure 2. As presented in Figure 3-a, transverse phonon dispersion surfaces are quite anisotropic, and show deep ’valleys’ (low energy and group velocities), induced by TA-TO coupling [7], and ’uphill’ (high energy and group velocities) regions depending on mode propagation and polarisation directions.
4 PHONON-DENSITY-FLUCTUATION PROCESSES
Hehlen et al. [15] considered several possible explanations for the origin of the new BD. The most likely one at the time seemed to be the onset of second sound (2S), a phenomenon independently predicted in QPE by Gurevich and Tagantsev [26]. The physical reason for this effect is that the presence of the low frequency TO branches enhances normal (momentum conservation) relaxation processes. This could open the frequency ’window’ condition [15, 26] for the appearance of 2S near BZ centre, where and are the normal and resistive dampings respectively. In KTaO3, this excitation is expected to be nearly isotropic in velocity and to couple to acoustic modes.
Following a thermodynamical approach, it is possible to evaluate the 2S velocity near BZ centre using , where is the entropy density, is the heat capacity, and is a density tensor, as detailed in [26]. Phonons contributing to 2S should have normal dampings higher than the doublet frequency , in order that the ’window’ condition is satisfied. It is possible to evaluate three-phonon normal dampings [27] through electrostrictive processes [18, 24] using the phonon dispersion surfaces parameterisation. Numerical computations of this sort indicate that TA dampings are minimal in <001> and <110> ’valley’ directions, and higher elsewhere, particularly around ’uphill’ regions [20].
Computations of 2S velocity using the Vaks model and the thermalized part of the phonon spectrum give = 1100 200 m/s, in excellent agreement with Brillouin scattering measurements of BD speed. However, it seems difficult to explain the directional dependence of BD (see Section 2 and Figure 1) in terms of 2S.
Second sound is the collective mode of phonon density fluctuation processes [28]. When the window condition is not fulfilled (), non-thermalized phonon can still interact via two-phonon difference scattering (TPDS) processes. Following Wehner and Klein [28], the resulting Brillouin second order scattering intensity is given by [20] :
| (1) |
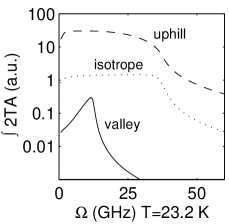
where is 0 and 4 for TO and TA contributions respectively. This expression has been evaluated for model phonon dispersion surfaces in the case of valley, isotrope and uphill shapes (see Figure 3-b). It is then possible, in the case of low phonon dampings, to obtain a sharp peak from valley contribution, or a broader quasi-central spectrum from uphill contributions. The peak or threshold frequency is fixed by the mean group velocity of contributing non-thermalized phonons, and is smaller in valley than uphill. The TPDS spectrum broadens with increasing dampings, and then appears as a broad doublet or central peak, depending on group velocity distribution. Thus, the TPDS spectrum is essentially anisotropic.
In this scheme, the BD low temperature contribution originates from low damping and group velocity ’valley’ TA phonons TPDS i.e. for <001> and <110> propagations (see Figure 3-a). The BBD comes from higher damping ’uphill’ TA phonons TPDS i.e. for <110> and <111> propagations, at slightly higher temperatures where those regions are significantly populated. The BD and BBD contributions disappear when the soft mode energy increases, and the TA-TO coupling induced valleys open up. For the TO modes, with high dampings, a very broad quasi-central peak is expected, corresponding to the CP contribution.
Wehner and Klein [28] predicted that in various crystals, including SrTiO3, the integrated intensities of phonon density fluctuation processes (i.e. 2S or TPDS) could be 10 to 100 times the value given by the Landau-Placzek ratio. It is then quite plausible that these intensities become comparable, or even higher than phonon light scattering intensities in KTaO3, which would thus bring them in agreement with observed intensities.
5 CONCLUSION
We have shown that the phonon spectrum and dampings in KTaO3 are consistent with two phonon-density-related scenarios for the appearance of quasi-elastic central peak and doublets. One scenario is related to temperature waves (second sound) involving a part of the spectrum that can be thermalized during the doublet lifetime [15, 26]. The other scenario is related to the two-phonon difference scattering of non-thermalized transverse phonons from phonon sheet ’valleys’ or ’uphill’ regions [20]. The position of the sharp doublet BD is consistent with both scenarios whereas the anisotropy of the scattering favours the second one.
References
- [1] K. Kurtz, Trans. Am. Cryst. Assoc. 2, 63 (1975).
- [2] K.A. Müller and H. Burkard, Phys. Rev. B 19, 3593 (1979).
- [3] E. Tosatti and R. Martoñàk, Sol. Stat. Comm. 92, 167 (1994).
- [4] H. Unoki and T. Sakudo, J. Phys. Soc. Jap. 23, 546 (1967).
- [5] H. Thomas and K.A. Müller , Phys. Rev. Lett. 21, 1256 (1968).
- [6] G. Shirane and Y. Yamada, Phys. Rev. 177, 858 (1969).
- [7] J.D. Axe, J. Harada, and G. Shirane, Phys. Rev. B 1, 1227 (1970).
- [8] R. Comès and G. Shirane, Phys. Rev. B 5, 1886 (1972).
- [9] C.H. Perry, R. Currat, H. Buhay, R.M. Migoni, W.G. Stirling, and J.D. Axe, Phys. Rev. B 39, 8666 (1989).
- [10] H. Vogt and H. Uwe, Phys. Rev. B 29, 1030 (1984). See also H. Vogt, Phys. Rev. B 41, 1184 (1990).
- [11] P. Grenier, G. Bernier, S. Jandl, B. Salce, and L.A. Boatner, J. Phys. : Cond. Matt. 1, 2515 (1989).
- [12] S. Jandl, M. Banville, P. Dufour, S. Coulombe, and L.A. Boatner, Phys. Rev. B 43, 7555, (1991).
- [13] K.B. Lyons and P.A. Fleury, Phys. Rev. Lett. 37, 161 (1976).
- [14] B. Hehlen, Doctoral Thesis, Université Montpellier II (1995).
- [15] B. Hehlen, A-L. Pérou, E. Courtens, and R. Vacher, Phys. Rev. Lett. 75, 2416 (1995).
- [16] D. Rytz, U.T. Höchli, and H. Bilz, Phys. Rev. B 22, 359 (1980).
- [17] B. Salce, J.L. Gravil, and L.A. Boatner, J. Phys. : Cond. Matt. 6, 4077 (1994).
- [18] H. Uwe and T. Sakudo, J. Phys. Soc. Jap. 38, 183 (1975).
- [19] J. Sandercock, J. Phys. E 9, 566 (1976).
- [20] E. Farhi, Doctoral Thesis, Université Montpellier II (1998). <http://www.ldv.univ-montp2.fr:7082/~manuf/these.html>
- [21] R. Migoni, H. Bilz, and D. Bäuerle, Phys. Rev. Lett. 25, 1155 (1976).
- [22] E. Farhi, A.K. Tagantsev, R. Currat, B. Hehlen, L.A. Boatner, and E. Courtens, submitted to Eur. Phys. Jour. B (1999).
- [23] V.G. Vaks, Zh. Eksp. Teor. Fiz. 54, 910 (1968) [Sov. Phys. JETP 27,486 (1968)].
- [24] V.G. Vaks, Vvedenie v Mikroskopicheskuyu Teoriyu Segnetoelectrikov [Introduction to the Microscopic Theory of Ferroelectrics], Nauka, Moscow (1973).
- [25] B.Y. Balagurov, V.G. Vaks and B.I. Shklovshii, Zh. Eksp. Teor. Fiz. 12, 89 (1970) [Sov. Phys.-Solid State 12, 70 (1970)].
- [26] V.L. Gurevich and A.K. Tagantsev, Zh. Eksp. Teor. Fiz. 94, 370 (1988) [Sov. Phys. JETP 67, 206 (1988)].
- [27] R.A. Cowley, Adv. Phys. 12, 421 (1963).
- [28] R.K.Wehner and R. Klein, Physica (Utrecht) 62, 161 (1972).