Non-Fermi liquid angle resolved photoemission lineshapes of Li0.9Mo6O17 A recent Letter by Xue et al. [1] reports observations from angle resolved photoemission spectroscopy (ARPES) on quasi one-dimensional (q-1D) Li0.9Mo6O17 that above its K transition a peak dispersing to define its Fermi surface (FS) develops Fermi energy () weight requiring a Fermi liquid (FL) description. This finding contradicts our report [2] of a non-FL lineshape in this material. The reasoning in [1] that this new finding was enabled by improved angle resolution is flawed. Rather, we point out here that the data of [1] have fundamental differences from other ARPES results and also band theory. Therefore, until the origin of these differences are learned, the claims of [1] must be held in abeyance. These claims also include the report of an 80meV gap below , which contradicts the zero gap found in optical spectroscopy [3] and magnetic susceptibility and exceeds by more than two orders of magnitude the value (0.3meV) implied by a gap-model interpretation of the resistivity rise below [4].
Improved angle resolution is not relevant for the claimed FL lineshape. Because the k=kF lineshape for both the FL and the Tomonaga-Luttinger (TL) model (with ) are singular at , the weight for both increases steadily as the angle resolution improves. Indeed, it is well known that one must angle-integrate (k-sum) to test for the surprising difference between the Fermi edge of the FL and the power law onset of the TL model. Xue et al. sum ARPES data along the q-1D –Y direction over =0.2Å-1 and report a Fermi edge, whereas we always find only a power law onset at in angle summed spectra, including our new high resolution spectra shown below. This difference arises because the data are fundamentally different.
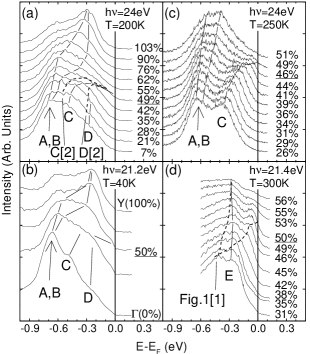
Fig. 1 shows various –Y data sets. The kF values show small variations among the data sets and so we place importance on the k value relative to kF. Panel (a) shows previously unpublished data taken by us at photon energy h=24 eV on literally the same cleaved surface as for the data of [2]. Panel (b) shows earlier data with h=21.2 eV by Grioni et al. [5] The data sets for the two h values are consistent, both showing bands A through D in good basic agreement with band theory, as labeled. Only bands C,D cross , becoming degenerate before the crossing. In addition, there is an unexplained tendency, seen also in other Mo bronzes, for non-dispersive weight to cling to the bottom of the band (eV). Panels (a) and (b) establish the consistency of the data of [2] and [5]. The special k-path parallel to –Y in [2] was chosen because both bands C,D are especially strong all the way to . The bands C,D in (a)–(c) along –Y are in basic agreement with those in [2] (short dashes in (a)), and, importantly, show non-FL lineshapes as do the data of [2]. A difference occuring for the filled band B along the two paths is implied by band theory but is not important here.
Panel (c) shows h=24 eV data taken at the Wisconsin Synchrotron Radiation Center PGM beamline with an SES-200 Scienta analyzer over a narrow k-range near where D is already too weak to see. These data have angle and energy resolution comparable to that of Xue et al. and fully agree with the data of (a) and (b) apart from generally increased sharpness, and increased weight for . It is then meaningful to compare the data of (c) directly to the h=21.4 eV data of Xue et al. [1], shown in panel (d). Relative to , the two k-ranges are nearly the same. It is obvious by inspection that the two data sets are globally different, for example by the absence in (d) of peaks A,B and by the presence in (d) of a non-dispersing feature E which interferes with the presumed C,D lineshapes, and has no counterpart in the other data or in band theory. This work was supported by the U.S. DoE at U. Mich. and Iowa State, and by the U.S. NSF at U. Mich. and U. Wisc.
G.-H. Gweon1, J.D. Denlinger1, J.W. Allen1, C.G. Olson2, H. Höchst3, J. Marcus4 and C. Schlenker4
1Randall Lab. of Physics, U. of Michigan, Ann Arbor, MI 48109. 2Ames Lab., Iowa State U., Ames, Iowa 50011. 3U. of Wisconsin, SRC, Stoughton, WI 53589. 4LEPES, CNRS, BP 166, F-38042 Grenoble Cedex 9, France.
References
- [1] J. Xue et al., Phys. Rev. Lett. 83, 1235 (1999).
- [2] J.D. Denlinger et al., Phys. Rev. Lett. 82, 2540 (1999).
- [3] L. Degiorgi et al., Phys. Rev. B 38, 5821 (1988).
- [4] M. Greenblatt et al., Solid State Commun. 51, 671 (1984).
- [5] M. Grioni et al., Phys. Scr. T66, 172 (1996).