A Priori Approach to Calculation of Energies of Solvation
Abstract
We propose a systematic, a priori approach to the problem of the calculation of solvation energies using continuum dielectric models coupled to quantum mechanical description of reacting molecules. Our method does not rely on empirically scaled van der Waals radii to create a dielectric cavity, but rather uses the electron density of the reactants as the physical variable describing the cavity. In addition, the precise choice of cavity is made by ensuring that the dielectric reproduces the correct linear response of the solvent to electrostatic perturbations. As a model application which is interesting in its own right, we study the hydrolysis of methylene chloride, a representative model waste compound in supercritical oxidation experiments, and which has shown surprising solvation effects close to the critical point of pure water (T=394o C, P=221 bar). Using our a priori methodology, we find results in good agreement with available experimental reaction barriers. We then study, in a controlled manner, the relative importance of various further approximations that are routinely performed in the literature such as the use of spherical cavities, the replacement of the reactant by a dipole, or the neglect of self consistency in solving the electrostatic problem.
1 Introduction
The study of reactions in solution and the calculation of solvation energies are problems of importance and interest in physics, chemistry, and biology. For a polar solvent such as water, the effects of solvation on the energetics of reactions can be crucial. However, modeling solvated reactions is a challenging problem as one needs both a reliable quantum mechanical treatment of the reactants in order to correctly describe bond rearrangements as well as thermodynamic integration over the solvent degrees of freedom.
An idealized model would describe both the reactants and the large number of solvent molecules quantum mechanically using an ab initio approach. However, simulating such a large number of particles quantum mechanically poses a prohibitive computational burden even on today’s largest computers, and we require some sort of simplification or approximation scheme. Clearly, the electronic states of the reacting molecules must be treated quantum mechanically, so that one must concentrate on simplifying the description of the solvent. The most common and direct approach replaces the solvent by a dielectric continuum that surrounds a solvent-excluded cavity about the reactants, and we refer the reader to the excellent review of Tomasi and Persico [21].
Upon examining the state of the art, one sees that current methodologies are highly variegated and that they rely on semiempirical fits or rule-of-thumb prescriptions for describing the dielectric cavity, the charge density of the reactants, or the polarization of the dielectric. We instead consider systematically the impact of each stage of approximation in coarse-graining from an ab initio calculation one could perform in principle to the dielectric treatment used in practice.
In addition to this new perspective, we provide a novel approach for dealing with the important issue of constructing appropriate dielectric cavities. The current literature uses van der Waals spheres to construct the cavity. The results, however, can be sensitive to the radii of the spheres requiring empirical adjustment [21, 13]. Rather than this a posteriori approach, we construct the cavity based on the a priori consideration that the dielectric, by definition, reproduces the thermodynamic response of the molecular solvent to electrostatic perturbations. Below, we effect this by choosing the dielectric cavity boundary as an isosurface of the reactant electron density which reproduces the correct solvent response.
Once we specify the dielectric cavity, we still face the problem of solving the electrostatic equation. For this, we introduce a powerful preconditioned conjugate-gradients method exploiting Fourier transform techniques to solve the electrostatic problem in the presence of the dielectric cavity.
To explore the efficacy of our approach, we consider a reaction that is highly sensitive to the dielectric response of the solvent, the hydrolysis of methylene chloride (CH2Cl2). There is both experimental (e.g. [6, 19, 11, 20, 18]) and theoretical interest (e.g. [10]) in the aqueous breakdown of this industrial toxin (methylene chloride). Previous theoretical studies of this reaction showed promising results, but were based on the simple approximation of a dipole in a spherical cavity [10]. In addition to providing a more systematic analysis of the hydrolysis of methylene chloride, we study in a controlled manner the impact of these common approximations on the resulting solvation energies.
We begin in Section 2 with a discussion of the hydrolysis reaction under consideration. There, we present the overall hydrolysis reaction for methylene chloride and identify the rate limiting step, the choice of reaction geometry and reaction coordinate, and the ab initio density-functional method used to treat the reactants. Next, Section 3 describes our theoretical approach beginning with how one, in principle, calculates free energies a priori and then presents a detailed analysis of the chain of approximations that lead to the dielectric model. Our method for creating the dielectric cavity is presented followed by a new algorithm for solving the electrostatic problem. Finally, in Section 4 we present results for the hydrolysis of methylene chloride followed by a detailed analysis of the impact of the dipole and sphere approximations and the importance of self-consistency.
2 Pathway for hydrolysis of methylene chloride
Methylene chloride (CH2Cl2) is an important industrial solvent. Recently, there has been interest in treating aqueous wastes containing residual CH2Cl2 using supercritical water oxidation (SCWO) (i.e. oxidation in water at conditions above its critical point at 374o C and 221 bar [10]). However, significant destruction of CH2Cl2 occurs during preheating at subcritical conditions through hydrolysis rather than oxidation. Perhaps more surprisingly, the hydrolysis reaction rate is found to decrease dramatically as temperature increases through the critical point [10, 19], signalling the importance of solvation effects for this reaction.
The overall reaction describing the hydrolysis of methylene chloride is
This reaction is known to be a two step process [6]. The first step is a slow, rate-limiting substitution process that dictates the overall rate of the above reaction,
| (1) |
The species CH2ClOH is unstable and undergoes a fast internal rearrangement that expels H+ and Cl- to form the final HCHO,
Therefore, we need only concentrate our attention on the rate-limiting step of Eq. (1).
The first step of the reaction of Eq. (1) requires an H2O molecule to approach the CH2Cl2 molecule very closely and for a Cl- ion to leave. This proceeds via the creation of a transition state,
| (2) |
Below, we concentrate on understanding the energetics of the transition-state complex of Eq. (2), which should provide us with the activational energy barrier of the reaction of Eq. (1).
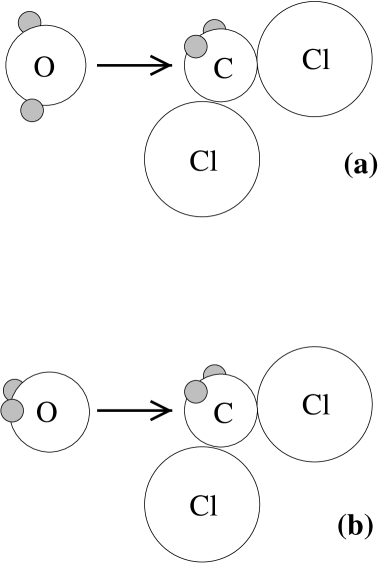
The chemistry of the reaction of Eq. (2) is known to be of the SN2 variety, where the oxygen approaches the carbon from the side opposite to the chlorine ion that leaves the CH2Cl2 molecule. However, the precise orientation of the water molecule during this reaction is not known. Figure 1 shows that the hydrogens in the water molecule may be oriented in one of two ways, either (a) in the same plane as the carbon and chlorine atoms, or (b) rotated by . Resolution of this question requires ab initio calculations.
First principles calculations provide unambiguous, a priori results for energies and forces. Such ab initio calculations determine reactant geometries, energies, and charge densities in vacuum. We use the pseudopotential plane-wave density-functional approach in the local-density approximation [15] with the Perdew-Zunger parameterization [16] of the Ceperly-Alder exchange-correlation energy [5]. Non-local pseudopotentials of the Kleinmann-Bylander form [8] constructed using the optimization scheme of Rappe et al. [17] describe the interaction of valence electrons with the ionic cores. The pseudopotential for carbon has a non-local projector for the s channel, and the oxygen and chlorine have projectors for the p channel. The plane-wave cutoff is 40 Rydbergs for a total of 35,000 coefficients for each electronic wave function. For a given choice of ionic positions, electronic minimizations are carried out using a parallel implementation of the conjugate-gradient technique of reference [15]. The supercell has dimensions of 15 Å 9 Å 9 Å, which separates periodic images of the reactants sufficiently to minimize spurious interaction effects, even for the elongated transition states. We fix the carbon atom at the origin of our simulation cell and place the reaction coordinate , defined as the oxygen-carbon distance of the reactants in Eq. (2), along the long, 15 Å x-axis of our cell. We determine optimized molecular structures by moving the ionic cores along the Hellman-Feynman forces until all ionic forces (except along the fixed reaction coordinate ) are less than 0.1 eV/Å in magnitude. To illustrate the accuracy of these calculations, Table 1 compares experimental and ab initio values for bond-lengths and permanent dipole moments of the isolated molecules.
| Bond Lengths (Å) | ||
| bond | ab initio | experimental [9] |
| C-H | 1.11 | 1.09 |
| C-Cl | 1.79 | 1.77 |
| O-H | 0.99 | 0.96 |
| Dipole Moments (Debyes) | ||
| molecule | ab initio | experimental [12] |
| H2O | 1.89 | 1.85 |
| CH2Cl2 | 1.79 | 1.6 |
The ab initio calculations establish that pathway (b) of Figure 1 is preferred, being 0.21 eV lower in energy for a typical value of the reaction coordinate . We thus consider only this pathway in the remainder of our work. Towards this end, we catalogue optimized geometries for a series of values of reaction coordinate along this pathway.
3 Theoretical methodology
Having determined the energies and configurations along the pathway in vacuum, we now turn to the much more challenging problem of the calculation of Gibbs free energies. Of particular interest is , the difference between the Gibbs free energy of the solvated transition state and the Gibbs free energy of the solvated reactants at infinite separation ,
| (3) |
Next we define the free energy of solvation as the difference in Gibbs free energy of a configuration in vacuum (which we have calculated above ab initio) and in solution ,
| (4) |
The task is to compute which describes the interaction of the solvent with the reactants.
3.1 Microscopic treatment of Gibbs free energies
Direct calculation of the Gibbs free energy requires the evaluation of a large phase space integral,
| (5) |
where and are coordinates describing the positions of the reactant and solvent nuclei, respectively, and , , and are the Hamiltonians describing the isolated reactants, isolated solvent, and their interaction, respectively. We work within the Born-Oppenheimer approximation, and therefore these Hamiltonians are the corresponding system energies for fixed nuclear coordinates . Finally, the prime on the outer integral indicates that we only sum over reactant coordinates that are compatible with the configuration .
In principle, there is no fundamental difficulty in (a) preparing a cell containing the reactants and a large collection of solvent molecules, (b) computing the system energy in Eq. (5) within density-functional theory, and (c) integrating over the phase space with appropriate molecular dynamics or Monte Carlo methods. The only hindrance is the prohibitive computational effort required. Accurate description of the bonding rearrangements of the chemically active reactants requires quantum mechanical calculation of the reactant Hamiltonian . Therefore, the only option to render the computation tractable while maintaining accuracy is somehow to coarse-grain the detailed microscopic description of the solvent.
3.2 Coarse-graining the solvent
Our approach to coarse-graining the solvent replaces the detailed molecular arrangement of the solvent molecules by the electrostatic field which they generate. To accomplish this, we separate the interaction of the reactant charge distribution and the solvent electrostatic field from all other terms in the reactant-solvent interaction Hamiltonian,
| (6) |
The term includes all remaining reactant-solvent interactions such as hard-core repulsions and van der Waals attractions (due to induced dipole dispersion forces).
Next, we define the free energy of the solvent given that it produces a field through
| (7) |
where means that we only integrate over configurations that give rise to the field . The only dependence of the free energy on the configuration of the reactants is through the interactions , the most important being the hard-core repulsions that create the solvent-excluded cavity about the reactants. Therefore, is the coarse-grained description of the free energy of the solvent in the presence of the cavity.
Next, we expand about its minimum at ,
| (8) |
Here, is a positive-definite symmetric kernel which depends on the cavity shape and which specifies the thermodynamic response of the solvent in the presence of the cavity, and is the electrostatic field created by the solvent in the presence of an empty cavity. As we shall discover below, retaining only the quadratic expansion of ultimately leads to a familiar dielectric description.
The free energy of Eq. (5) now can be rewritten in terms of by integrating over all possible solvent fields ,
| (9) |
which within the quadratic approximation of Eq. (8) becomes
| (10) | |||||
In going from the first to the second line, we have performed the Gaussian integral over the solvent field , which introduces two new quantities. The variable in Eq. (10) is the electrostatic potential at the maximum of the Gaussian integrand as determined by the condition,
| (11) |
from which it is clear that the linear operator relates the electrostatic response of the solvent to the presence of the reactant charges . The constant is the free energy of formation of the empty cavity. Physically, the contents of the square brackets of the exponent in Eq. (10) represent the total free energy of the system for a fixed reactant configuration . This free energy consists of the internal energy of the reactants , the electrostatic interaction of the reactants with the response of the solvent , the interaction of the solvent with the cavity potential , and the cavitation free energy .
For the case of present interest, the solvation of molecules with permanent electrical moments, we would expect the induced solvent potential to greatly exceed the cavitation potential , which arises from an electrostatically neutral cavity, and therefore that the electrostatic reactant-solvent interactions will be the dominant contribution to the free energy. Indeed, studies of polar molecules show the total solvation free energy to be strongly correlated with the aforementioned electrostatic interaction. Although these two quantities have an absolute offset of about 0.2 eV, free energy differences between configurations may be computed to within 0.05 eV from differences in the electrostatic interaction alone [21]. Mathematically, this implies that we can set and that may be taken to be independent of the reactant configuration , resulting in
| (12) | |||||
| (13) |
The free energy of solvation for configuration is the electrostatic integral
| (14) |
Eq. (13) shows that the reactant charge density induces a linear response in the solvent which gives rise to the solvent potential . This relation, therefore, also gives the total electrostatic potential as a linear response to the charge density of the reactants,
This latter connection corresponds precisely to the standard macroscopic Maxwell’s equation,
| (15) |
and serves to define the precise form of in terms of , which we have already defined microscopically.
3.3 Comparison of continuum and molecular response
Having arrived at a coarse-grained description of the solvent in terms of its dielectric function in Eq. (15), we now face the problem of specifying . In general, the true microscopic dielectric is a non-local function which relates to the cavity in a highly complicated manner. However, as we now show, quite simple, computationally tractable models can describe very well the underlying physics.
Within the solvent-excluded cavity surrounding the reactant, there is no solvent dielectric response and therefore we expect . Far from the cavity, we expect the dielectric response to be that of the bulk solvent . Here, we include the dependence of the bulk solvent’s dielectric constant on pressure and temperature as we wish to investigate dielectric effects near the critical point of water where is a strong function of these parameters. Finally, we can expect the dielectric response somehow to interpolate smoothly between these extremes.
To investigate the suitability of such a simple dielectric description of an ordered molecular solvent, we in principle could use ab initio methods by placing a large number of water molecules in a simulation cell, then performing molecular dynamics or Monte Carlo sampling, and comparing the response to electrostatic perturbation of this system with the response of a dielectric model. This, however, would be both computationally expensive and largely unnecessary as the solvent molecules remain chemically inert and interact with the reactants primarily via electrostatic and repulsive forces. Therefore, to investigate the impact of coarse-graining the molecular details of the solvent, we employ a simpler model where the solvent’s electronic degrees of freedom are not described explicitly. The microscopic SPC model for water was used as it has electrostatic point charges for the three atoms in the H2O molecule and a Lennard-Jones interaction between the oxygen centers to incorporate short-range repulsive and long-range van der Waals interactions [3].
We extract the linear response of H2O to electrostatic perturbations by simulating the behavior of SPC water molecules about a spherical cavity. We represent the cavity as a Lennard-Jones potential with a diameter of 4.25 Å and with a well-depth of 0.0030 eV centered at the origin of the simulation cell. (This corresponds to Å and eV in the notation of [3].) This cavity has roughly the same size and radius of curvature as the reactant complex that we study below, and a small depth parameter is chosen so that the potential primarily presents a repulsive core to oncoming water molecules. At the center of the cavity, we place a point charge of so that in Eq. (15). For each value of , we run constant molecular dynamics simulations [1, 14] with =256 H2O molecules, =1 atm, and K, which corresponds to an average cell volume of 7,800 Å3. We equilibrate the cell for 25 ps before gathering data for each time step over a run-time of 250 ps. The time-averaged oxygen-cavity radial distribution functions show a large peak at a radius of 3.00.1 Å and no oxygen presence for smaller radii. This gives an effective “hard core” radius of 3 Å for this spherical cavity.
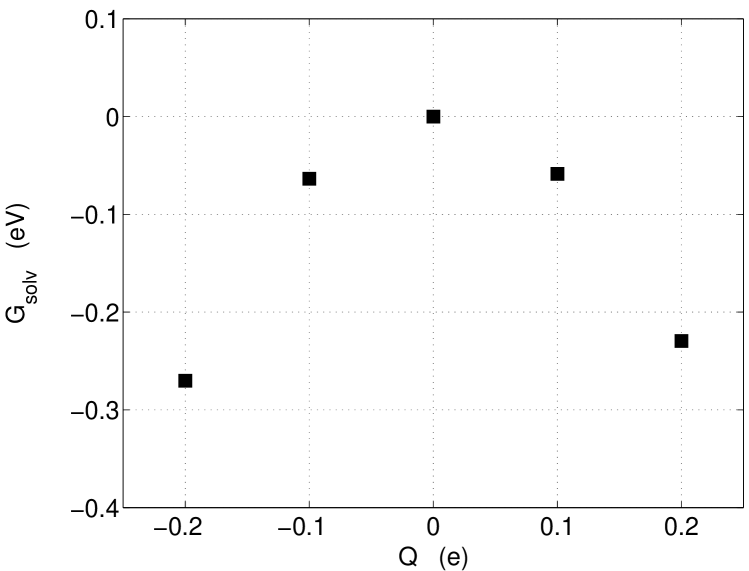
Binning and averaging the instantaneous charge distributions over the 250 ps sampling period gives the average induced charge density in the solvent , from which we may calculate using . We then compute the solvation free energy of Eq. (14). Figure 2 shows quadratic behavior in , the first indication that the dielectric approach is appropriate.
As discussed above, we now compare this molecular response with that of a dielectric function which interpolates smoothly from the interior of the cavity to deep within the solvent,
| (16) |
which is the convolution of a Gaussian having a standard deviation with a step function located at a radius of . This particular form of interpolation is chosen for convenience when working with our Fourier-based technique described further below. Here, is the radius where the dielectric changes and measures the distance over which the change occurs.
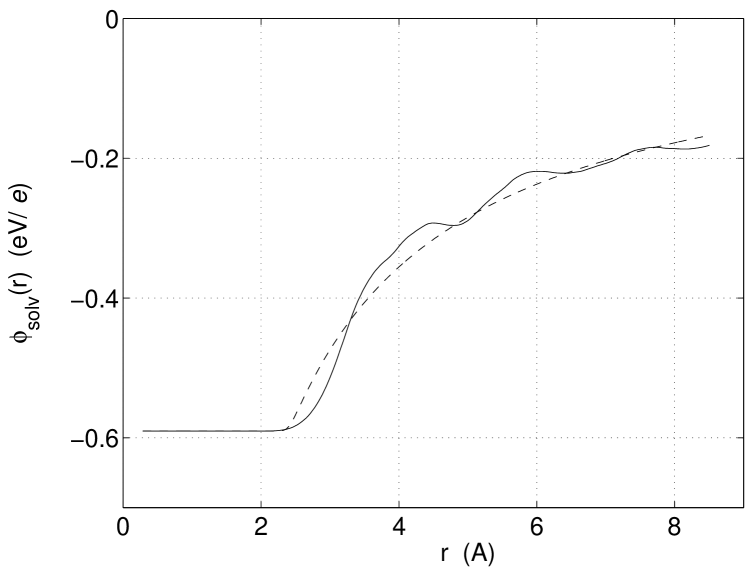
If a continuum dielectric description is viable, then an appropriate choice of and will ensure that, in general, the response of the model dielectric match that of the molecular solvent and, in particular, that the electrostatic free energies matches as closely as possible. Figure 3 shows for as calculated from the molecular simulations and the dielectric of Eq. (16) with Å, Å, and as appropriate for water at ambient conditions. For this demonstration, Å is fixed and was chosen to minimize the mean square difference between the molecular and dielectric potentials . Although some shell structure is evident in the molecular calculation, the two potentials track one another quite closely. Moreover, because the system is a point charge, the solvation free energy of Eq. (14) may be read off as simply the value of at the origin, where the two calculations agree quite well.
3.4 Specification of dielectric cavity
As shown above, the dielectric approximation to the response of the solvent appears quite successful in practice. Encouraged by this, we now specify how we construct the dielectric cavity for our reactant system. Specifically, a closed surface surrounding the reactants must be chosen, a surface that specifies the boundary where the dielectric changes from its value in vacuum to its value in the bulk solvent .
The current state of the art for choosing the cavity begins by placing spheres with empirically adjusted van der Walls radii on atomic or bond sites. These adjusted radii are scaled from the experimentally fit radii by factors in the range of 1.15 to 1.20 [21]. Next, either the volume enclosed by the intersecting spheres is taken as the dielectric cavity, or a further spherical probe is rolled over this volume and either the surface of contact of the probe or the surface traced by its center is used as the cavity boundary [21]. The latter two choices tend to either underestimate the solvation energy or to produce unphysical inward-bulging regions that lead to computational difficulties and unphysical sensitivities to slight changes in reactant geometry [21]. When this approach is stable, calculated solvation energies can depend strongly on the size and placement of the spheres [13]. Aside from the empirical nature of the approach, it is not obvious why spherical shapes should be used in molecules where electron densities can differ significantly from a sum of spherical atomic densities, or why it is appropriate to use atomic van der Waals radii in a molecule.
Our a priori approach is based on the principle that the dielectric cavity captures the thermodynamic response of the solvent to the charge density of the reactants. Our strategy for applying this idea has two parts. First, we know that strong repulsive forces between reactant and solvent molecules create the cavity, and that these repulsive forces are active when the reactant and solvent electron clouds overlap thereby causing the system’s energy to rise rapidly due to the Pauli exclusion principle. Therefore, the shape of the surface of closest approach for the solvents and hence the shape of the dielectric cavity should be well approximated by isosurfaces of the electron density of the reactants. Second, to choose the precise value of the electron density specifying the isosurface, we demand that the dielectric so chosen lead to the correct solvation free energy as predicted by an ab initio molecular description. In practice, this requirement is very difficult to enforce for an arbitrarily shaped cavity. Therefore, as a necessary practical compromise, we instead ensure that (a) our dielectric model produces the correct molecular response of the solvent for a computationally manageable model system, and (b) we use relevant ab initio calculations to calibrate the results of the model calculations when applying them to the real system. We now provide the details below.
3.4.1 Molecular-dielectric connection
Our first step is to connect the molecular description to the dielectric one so as to extract key physical parameters for use in our a priori modeling. To this end, we concentrate on the results of our SPC-cavity simulations described above.
The first important parameter is the radius , defined as the position of the first maximum in the cavity-oxygen radial distribution function and therefore the closest-approach distance of the oxygen atoms to the cavity center. As stated above, we have Å.
The second important parameter is , defined to be the position of the induced charge peak within the dielectric model. For a radial dielectric function such as that of Eq. (16), the induced charge density in response to a point-charge at the origin is given by
| (17) |
Thus is the radius where has its largest magnitude. For each value of , we choose the optimal dielectric model by finding the that minimizes the mean square difference between the generated by the SPC calculation and that of our dielectric model.
Two important results emerge from this fitting. First, for all values of and , we find to be essentially constant, Å, which means that the spatial position of the induced charge distribution remains fixed. While we expect the closest-approach distance to depend on the details of the repulsive potential, the difference , which is determined primarily by the geometry of the water molecule itself, should be more transferable. Therefore, we always will design our dielectric functions such that Å. The second result relates to the choice of , which is the final parameter necessary to complete the specification of the dielectric function . In order to keep fixed, we find that follows the simple relation to within 0.03 Å. This completes the specification of for ambient conditions .
For , we can, in principle, repeat the above procedure. However, was fixed to keep it independent of the value of the bulk dielectric for the reasons described above. Then, we determine such that the peak position of (Eq. (17)) falls at the resulting value of .
3.4.2 Construction of non-spherical dielectric cavities
The first problem in determining the dielectric cavity for a reacting complex is to determine the closest approach of the solvent water molecules. To address this, we start with an isolated CH2Cl2 molecule and bring an H2O molecule toward the carbon atom from the direction opposite to one of the chlorine atoms. The incoming molecule is oriented with its hydrogens pointing away from the carbon so as to allow for the closest approach of the oxygen. Then the ab initio energy of the system is calculated as a function of the carbon-oxygen separation and a rapid rise over and above is found for a separation of 2.5 Å. This provides an ab initio closest-approach distance of Å. Using the fixed separation Å of the previous section, we conclude that Å.
To convert into a dielectric boundary in three dimensions, we scan the electron density of an isolated CH2Cl2 along the approach direction of the H2O molecule in the previous paragraph. The electron density value at the distance from the carbon is then recorded, and this isosurface of the electron density defines the boundary of the dielectric cavity.
3.5 Solving the Poisson equation
The remainder of this section describes how we solve the Poisson equation (15) for the total potential . When solving for , one faces two computational issues: (a) how to represent the continuous fields , , and , and (b) to what level of accuracy one solves the Poisson Eq. (15).
We choose to represent all continuous functions with a periodic Fourier expansion. In particular, a Fourier grid of dimension is used for the 15 Å 9 Å 9 Å cell corresponding to a grid spacing of 0.075 Å. The represention of and on a grid requires us to address the issue of the discreteness of that grid. The total reactant charge density is the sum of a smooth electronic charge density and the point-like charge densities of the atomic cores, the latter presenting the essential difficulty when representing on the grid. The dielectric function likewise has rapid variations across the boundary of the cavity. We use Gaussian smoothing to deal with both problems: we replace each atomic core by a Gaussian distribution, and we smooth the dielectric by convolving it with the same Gaussian. The standard deviation of the Gaussian smoothing must be both small enough to faithfully recover the same energy differences that we would obtain with true true point charges and also larger than the grid spacing so that we can faithfully represent and .
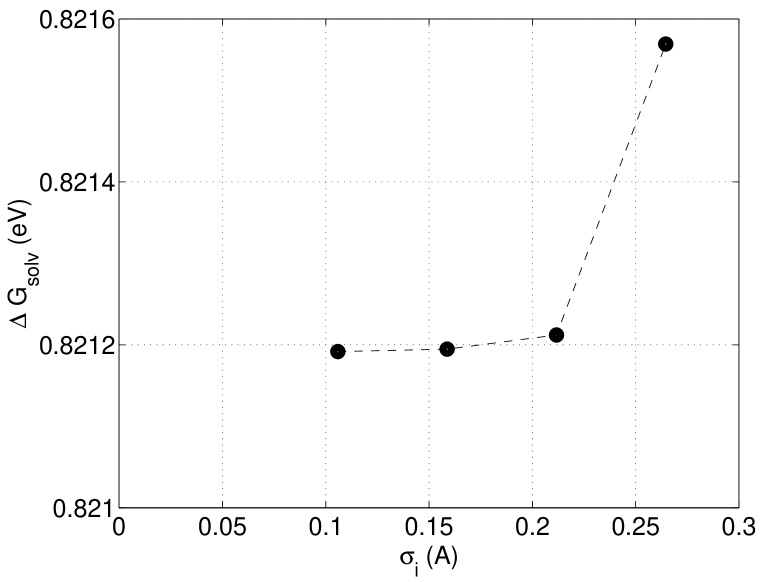
Our high-resolution grid allows us to satisfy both constraints. Figure 4 shows the behavior of the electrostatic solvation free energy difference between two reactant configurations as a function of for a fixed dielectric. Choosing Å introduces errors in free energy differences of less than eV, consequently this value of was selected for all calculations reported below.
Since any function can be expanded in a Fourier basis, our choice of representation is quite general and free of any a priori bias. By simply increasing the size and density of the Fourier grid, we are guaranteed systematic convergence of the results.
Finally, to solve the Poisson equation (15) accurately, the auxiliary quadratic functional is minimized:
| (18) |
which is equivalent to solving the Poisson Eq. (15). Very briefly, we represent in our Fourier basis via
| (19) |
where ranges over the Fourier wave-vectors, and are Fourier expansion coefficients. In this representation, calculation of is equivalent to to multiplication of by . Multiplication by the dielectric function and reactant charge density is best performed in real-space, where we multiply by the value of or at each grid point. Integration is replaced by a weighted sum over grid points in real-space, and we use Fast Fourier transforms to effect the change of representation from reciprocal to real space and vice versa. In this way, becomes a quadratic function of the Fourier coefficients , and minimization of a quadratic function is an ideal case for the use of conjugate gradient methods. Convergence was accelerated by preconditioning each component of the gradient by the multiplicative factor for and unity for . With this choice, the minimization requires only twenty to twenty five iterations to reach machine precision. Once we have found , we easily obtain and calculate the solvation free energy of Eq. (14).
3.6 The rigid solute approximation
Up to this point, we have not dealt with the reactant coordinates . Even within a dielectric model, performing the integral of Eq. (12) poses a difficult problem. This integral over is approximated by evaluation at its maximum, resulting in
| (20) |
Finding poses a tedious self-consistent problem. The key difficulty is that the reactant charge density and solvent field are implicit functions of so that to perform the above minimization, one must determine the solution of the quantum mechanical equations that determine while self-consistently solving the external Poisson Eq. (15) for .
The simplest and most popular approach is to ignore the polarizability of the reactants and to use their optimal configuration in vacuum. Therefore, of Eq. (20) becomes simply the sum of the energy of the reactants in vacuum and the electrostatic interaction of the resulting reactant charge density with the solvent. This “rigid solute” approximation, when compared to the full self-consistent minimization, creates absolute errors in the free energy ranging from 0.26 eV to 0.52 eV, but differences of free energies are generally accurate to better than 0.03 eV [21], which is sufficient for our study.
4 Results and Discussion
4.1 Reaction profile and barrier
Based on the above methodology, we first perform ab initio calculations at a set of reaction coordinates in the range 1.4 Å 2.0 Åalong the the pathway defined for the reaction in Section 2. We also perform one calculation at Å, the largest separation possible in our cell, which serves as our reference configuration and which we label as (reactants at essentially infinite separation). The ab initio energy of each configuration is then in Eq. (4).
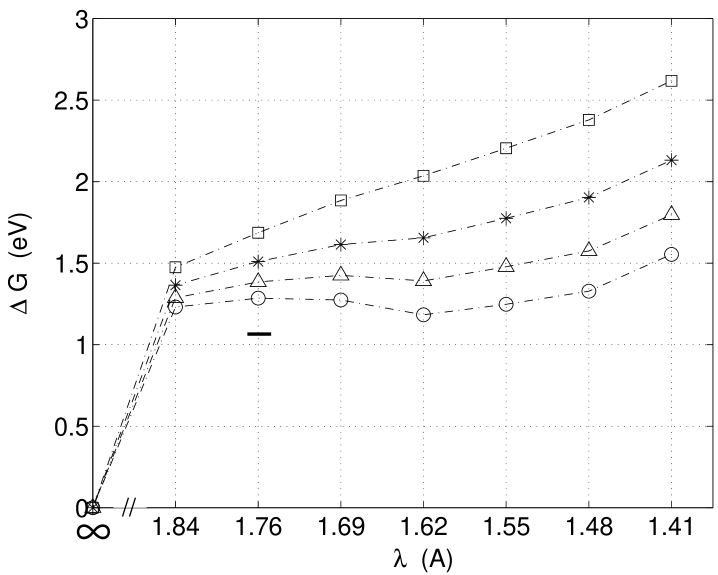
Next, using the ab initio charge density calculated at each , we create appropriate dielectric cavities for various values of the bulk dielectric constant as described above. We solve the Poisson equation for each case and calculate the solvation free energy . This solvation energy is added to to give the total free energy of the configuration . Figure 5 shows the resulting free energies of the reacting complex as a function of reaction coordinate referenced to the configuration for various values of . The curve with shows the raw ab initio energies of each configuration in vacuum .
The results in Figure 5 show the following trends:
(a) For large values of the dielectric constant , the free energy curve has a local maximum at Å followed by a shallow minimum at smaller . The height of this maximum is the activation free energy of Eq. (3) for our reaction.
(b) As decreases, the heights of both the maximum and therefore also the activation barrier increase. This is because a weaker dielectric leads to a weaker induced charge in the solvent, to a smaller solvation energy, and thus to less stabilization of the reacting complex.
(c) As decreases, the maximum and minimum move closer and finally coalesce. The free energy curve then becomes rather featureless and rises monotonically for decreasing .
The trends (b) and (c) explain the qualitative behavior of the hydrolysis reaction of Eq. (2) observed in experiments [6, 19]. As the temperature increases, the dielectric constant of water drops sharply from its ambient value of to . As decreases, the height of the barrier rises which drastically reduces the reaction rate.
As for quantitative comparison with experimental values, the work of Fells and Moelwyn-Hughes [6] found an activation barrier of eV at , which corresponds to [22]. This experimental value is marked as the solid dash in Figure 5. The a priori results predict a barrier eV. The local-density approximation used in the ab initio calculations is generally considered to have an absolute accuracy of 0.1-0.2 eV for such a system. In addition, the other approximations listed above together with their appropriate uncertainties introduce a further uncertainty which we estimate to be about 0.05 eV. Therefore, our a priori prediction of the barrier compares favorably with the experimental value.
Trend (c) raises the question of the nature of the reaction of Eq. (2) for high temperatures or, equivalently, low dielectric . A simple interpretation of the data in Figure 5 based on transition state theory would imply that there is no stable product and that the reaction ceases as tends to one. However, since we have not explored the entire possible phase space for the two step reaction of Eq. (1), it would be naïve to claim that the reaction stops completely. More probably, for this high temperature regime, some other reaction path or mechanism begins to compete with the one we examine here. In this case, free radical reaction pathways become more important as the temperature rises or equivalently decreases.
In summary, our a priori approach explains the behavior of the hydrolysis reaction Eq. (1) as a function of temperature. Furthermore, the quantitative comparison to available experimental data is favorable given the approximations involved.
4.2 Kirkwood theory
The idea of modeling a solvent by a dielectric continuum dates back to the early 1900’s as illustrated in the works of Born [4] and Bell [2]. Kirkwood [7] developed a picture for the interaction of a dielectric continuum with a quantum mechanical solute. Within Kirkwood’s formulation, the solvent-excluded cavity is a sphere of radius . The dielectric inside is , and, outside the sphere, the dielectric takes its bulk value . One then performs a multipole expansion of the solute charge density. Solving for the induced surface charge density on the spherical boundary is then a standard textbook problem. The resulting expression for the electrostatic solvation free energy is
| (21) |
where is the total charge of the solute, is its electrical dipole moment, and contributions of higher moments of the solute charge distribution are not shown. Generally, the leading term of the series dominates and higher order terms can be neglected. In our case, we have neutral but polar reactants CH2Cl2 and H2O, so that the series begins with the dipolar term, the only term retained. We compute the dipole moment of the reactant configuration directly from the ab initio charge density. Then, the one free parameter in the Kirkwood formalism is the cavity radius . We choose such that the volume of the Kirkwood sphere and our a priori dielectric cavity are the same.
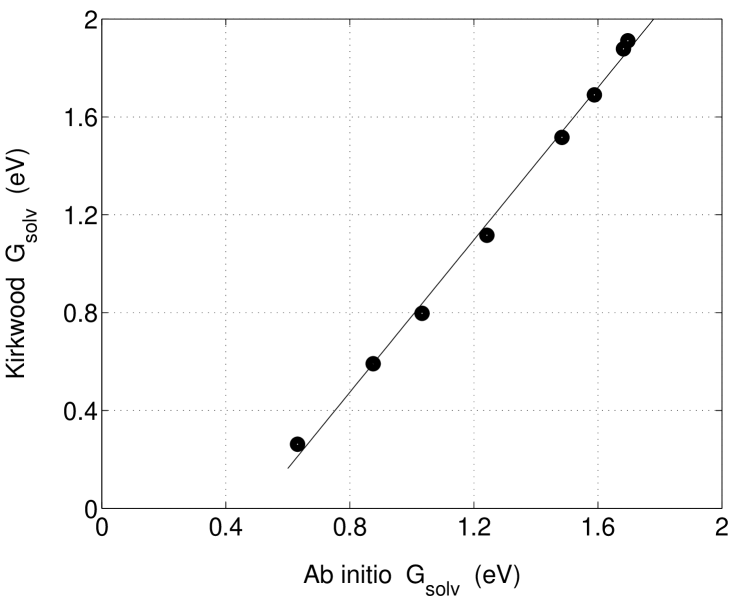
Figure 6 is a correlation plot of the Kirkwood solvation free energies versus solvation free energies computed with our a priori solvation energies. The most striking feature of the plot is its linearity. The fact that there is a vertical intercept of approximately -0.77 eV is not relevant for the calculation of free energy differences. The linear correlation suggests that although there are quantitative errors, the simplified Kirkwood model is correct in its qualitative description of solvation effects and therefore useful for predicting trends in solvation behavior.
Given the simple form of the dipole term in Eq. (21), and the remarkable linearity of the correlation in Figure 6, we could adjust to modify the scale of the of the solvation energies and thereby create excellent a posteriori agreement with the a priori results for this one particular reaction. Of course, we do not expect such detailed adjustments to be transferable to other chemical reactions.
4.3 Comparison of dielectric models
We now explore the remarkable linear correlation between the simple Kirkwood model and our detailed calculations. The two key simplifications in the Kirkwood approach are the replacement of the detailed reactant charge distribution by a dipole, and the replacement of the arbitrarily shaped dielectric cavity by a sphere.
Our calculations provide us with detailed information regarding the reactant charge density , the dielectric function , and the induced solvent potential for each configuration. Therefore, we are poised to study the above approximations, which are not unique to the Kirkwood model but play important roles in a variety of solvation models employed in the literature [21]. In going from the a priori to the Kirkwood model, there are two intermediate models, for a total of four models to consider:
| (1) A priori | Dipole approximation (2) | ||
|---|---|---|---|
| = a priori | = a priori | ||
| = a priori | = dipole | ||
| = a priori (SC) | = a priori (NSC) | ||
| = sphere | = a priori | ||
| = dipole | = dipole | ||
| = dipole (SC) | = dipole (SC) | ||
| (4) Kirkwood model | Self-consistent dipole (3) |
-
1.
Our a priori approach — Here, we use the ab initio reactant charge density and the a priori dielectric cavity and solve the the Poisson equation to obtain the solvation free energy.
-
2.
Dipole approximation to molecular charge — Here, we replace the reactant charge density by a dipole, while holding the solvent potential fixed at its a priori value from model 1. Going from model 1 to 2 gauges the effect of replacing the charge density by a dipole.
-
3.
Self-consistent dipole approximation — Here, we use the dipole of model 2 and the a priori dielectric cavity while solving the Poisson equation self-consistently. Going from model 2 to 3 gauges the importance of self-consistency.
-
4.
Kirkwood model — Finally, we change the cavity shape to a sphere. Going from model 3 to 4 gauges the effect of cavity shape.
Table 2 summarizes the above models. Upon comparing their predictions for the solvation free energies, we find the same strong linear correlations we found earlier when comparing the a priori and Kirkwood models (c.f. Figure 6 in the previous section). Since only free energy differences interest us, the slopes of the lines of best fit are the relevant parameters for comparing the models, and Table 2 lists these as well.
Upon examining the table, we observe that the effect on energy differences of replacing the detailed ab initio charge density by its dipole moment is only about 15% (12); the most important effect is that of self-consistency, resulting in changes of 100% (23); and the impact of the spherical approximation, resulting in changes of 50%, tends to cancel the preceding effects (34).
These observations lead us to the following conclusion. Replacing the ab initio charge density by its dipole in a realistic dielectric cavity produces rather large errors in free energies. Surprisingly, most of this error arises not from the simplification of the charge density (a 15% effect, 12), but rather from the effects of self-consistency between the reactant charges and the charges induced in the dielectric cavity (23). In particular, the a priori cavity seems to have an inappropriate shape for use with a dipole charge distribution as the reduction in error in going from 34 evinces. This suggests that simplified charge densities should be used with correspondingly simplified cavity shapes.
5 Conclusions
We have presented an a priori approach to the calculation of solvation free energies using continuum dielectric models coupled to quantum mechanical calculations. A derivation of the dielectric treatment based on a coarse-graining of the molecular description of the solvent is provided, and this leads to a method for creating the dielectric cavity which does not rely on empirically scaled van der Waals radii but rather uses the electron density of the reactants as the physical variable defining the cavity. The precise choice of cavity then is made by ensuring that the dielectric reproduces the correct linear response of the solvent to electrostatic perturbations. We study, in a controlled manner, the relative importance of further approximations that are routinely performed in the literature including the use of spherical cavities, the replacement of the reactants by a dipole, or the neglect of self consistency in solving the electrostatic equation.
Finally, as a model application, we study the hydrolysis of methylene chloride which has shown unusual solvation effects close to criticality in super critical oxidation experiments. Using our a priori methodology, results in good agreement with available experimental reaction barriers are found which explain these unusual trends.
6 Acknowledgements
This work was supported primarily by the MRSEC Program of the National Science Foundation under award number DMR 94-00334 and also by the Alfred P. Sloan Foundation (BR-3456). This work made use of the Cornell Center for Materials Research Shared Experimental Facilities, supported through the NSF MRSEC program (DMR-9632275). Dielectric calculations were carried out on the MIT Xolas prototype SMP cluster.
References
- [1] H. C. Anderson. Journal of Chemical Physics, 72:2384, 1980.
- [2] R. P. Bell. Transactions of the Faraday Society, 27:797, 1931.
- [3] H. J. C. Berendsen, J. P. M. Postma, W. F. van Gunsteren, and J. Hermans. Jerusalem Symposia on Quantum Chemistry and Biochemistry. Reidel, 1981.
- [4] M. Born. Z. Phys., 1:45, 1920.
- [5] D. M. Ceperley and B. J. Alder. Physical Review Letters, 45:566, 1980.
- [6] I. Fells and E. A. Moelwyn-Hughes. Journal of the Chemical Society, 2:1326, 1958.
- [7] J. G. Kirkwood. Journal of Chemical Physics, 2(7):351, 1934.
- [8] L. Kleinmann and D. M. Bylander. Physical Review Letters, 48:1425, 1982.
- [9] D. R. Lide, editor. Handbook of Chemistry and Physics. CRC, Boca Raton, FL, 77 edition, 1996.
- [10] P. A. Marrone, T. A. Arias, W. A. Peters, and J. W. Tester. Journal of Physical Chemistry A, 102:7013, 1998.
- [11] P. A. Marrone, P. M. Gschwend, K. C. Swallow, W. A. Peters, and J. W. Tester. Journal of Supercritical Fluids, 12:239, 1998.
- [12] A. L. McClellan. Tables of Experimental Dipole Moments. W. H. Freeman and Co., San Francisco, 1963.
- [13] S. Miertus, E. Scrocco, and J. Tomasi. Chemical Physics, 55:117, 1981.
- [14] S. J. Nosé. Journal of Chemical Physics, 81:511, 1984.
- [15] M. C. Payne, M. P. Teter, D. C. Allan, T. A. Arias, and J. D. Joannopoulos. Reviews of Modern Physics, 64:1045, 1992.
- [16] J. Perdew and A. Zunger. Physical Review B, 23:5048, 1981.
- [17] A. Rappe, K. Rabe, E. Kaxiras, and J. D. Joannopoulos. Physical Review B, 41:2127, 1990.
- [18] S. F. Rice, R. R. Steeper, and C. A. LaJeunesse. Destruction of representative navy wastes using supercritical water oxidation. Technical Report Sandia Report SAND94-8203 UC-402, Sandia National Laboratories, Livermore, CA, 1993.
- [19] D. Salvatierra, J. D. Taylor, P. A. Marrone, and J. W. Tester. Ind. Eng. Chem. Res., 38:4169, 1999.
- [20] T. B. Thomason, G. T. Hong, K. C. Swallow, and W. R. Killilea. The modar supercritical water oxidation process. In H. M. Freeman, editor, Innovative Hazardous Waste Treatment Technology Series, volume 1, page 31. Technomic Publishing Co., Lancaster, PA, 1990.
- [21] J. Tomasi and M. Persico. Chemical Reviews, 94:2027–2094, 1994.
- [22] M. Uematsu and E. U. Franck. Journal of Physical and Chemical Reference Data, 9(4):1291, 1980.