[
Resistivity of Mixed-Phase Manganites
Abstract
The resistivity of manganites is studied using a random-resistor-network, based on phase-separation between metallic and insulating domains. When percolation occurs, both as chemical composition and temperature vary, results in good agreement with experiments are obtained. Similar conclusions are reached using quantum calculations and microscopic considerations. Above the Curie temperature, it is argued that ferromagnetic clusters should exist in Mn-oxides. Small magnetic fields induce large changes and a bad-metal state with (disconnected) insulating domains. PACS numbers: 71.10.-w, 75.10.-b, 75.30.Kz
]
The study of manganites is one of the main areas of research in Strongly Correlated Electrons[1]. Three main reasons have triggered this wide interest: (1) The low-bandwidth materials have unexplained transport properties. They are insulators at room temperature, changing into bad metals at low temperatures. A sharp peak in the resistivity appears at the ferromagnetic (FM) transition. Small magnetic fields turn the insulator into a metal, with a “Colossal” Magneto-Resistance (CMR). (2) The phase diagram T-x (T=temperature, x=hole density) is rich, with complex spin, charge, and orbital order. (3) Mn-oxides have intrinsic inhomogeneities in most of the T-x plane even in single crystals[2, 3].
This challenging behavior has been addressed by previous theoretical studies. Regarding item (2), the various FM, antiferromagnetic (AF), orbital-ordered, and charge-ordered (CO) phases have already emerged from simulations and mean-field approximations[4]. Regarding item (3), phase separation (PS) has been proposed to explain the inhomogeneities. PS can be: (a) electronic, with nanometer-size clusters[3], or (b) structural, where disorder can induce up to micrometer-size clusters and percolation, when influencing on first-order transitions[5]. However, the explanation of transport, item (1), is more complicated since estimations of are notoriously difficult. In addition, the prominent inhomogeneities of Mn-oxides[2] have not been incorporated into realistic calculations[6]. The behavior of remains unexplained, although it is central to manganite physics.
Our goal in this paper is to present a rationalization of the vs T curves of Mn-oxides based on the currently prevailing phase-separated/percolative framework for these compounds. In this context, items (1) and (3) above are closely related. The analysis necessarily involves phenomenological considerations, since percolation cannot be addressed on sufficiently large lattices using accurate microscopic models. However, the -meter clusters in experiments[2] strongly suggest that a coarse-grain approach should be sufficient. In addition, results of microscopic calculations presented below are consistent with those of the macroscopic approach.
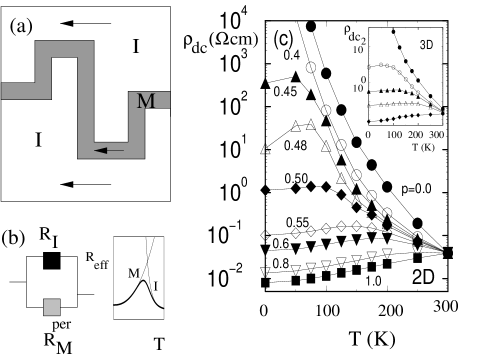
The main concept introduced here is summarized in Figs.1a-b. The manganite state in the CMR regime is assumed to be percolative, with metallic filaments across the sample (Fig.1a). Percolation indeed occurs in models[5], and in many experiments[2]. The insulating and metallic (percolative) regions are assumed to have resistances (T) and (T), respectively, as sketched in Fig.1b. is large at T=0 due to the complex shape of the conducting paths, and grows with T as in any metal, eventually diverging when the percolative path melts with increasing T. Note that at room temperature and, thus, most of the conduction in this regime occurs through the insulator. On the other hand, is so large at low-T that current can only flow through the percolative paths. This suggests a simple two parallel resistances description (Fig.1b), where a peak in the effective resistance at intermediate T is natural.
To substantiate this idea, first consider results obtained using a random-resistor-network that mimics the prominent FM-CO mixtures[2] in Mn-oxides in the CMR regime. Two-dimensional (2D) and three-dimensional (3D) square and cubic clusters are used, with link resistivities randomly selected as metallic () or insulating (), with a fixed metallic fraction (which in, e.g., (LPCMO) it is proportional to the amount of La [2]). The lattice spacing of this effective network is comparable to the FM or CO domain size, much larger than the Mn-Mn distance. The actual values of and vs T were directly taken from LPCMO data[2] (y=0.00 and 0.42, respectively), and for simplicity they are used in both 3D and 2D clusters. Other materials were tried and the analysis below does not depend qualitatively on the reference compounds.
The Kirchoff equations for the network were solved iteratively on large clusters using well-known techniques[7], and the net resistivity was found. Typical results are shown in Fig.1c. Only the limiting cases =0 (all insulator) and 1 (all metal) are taken from experiments. As expected, a percolative regime exists between =0.4 and 0.5, where (T=0) is as large as in LPCMO and other materials[8]. has insulating behavior at room-T, even for as high as 0.65, while at low-T a (bad) metallic behavior is observed. A broad peak appears at intermediate T’s and ’s. Similar results exist in 3D (inset of Fig.1c).
It is remarkable that Fig.1c is already in good qualitative agreement with some Mn-oxide experiments, such as for [9], or even non-manganite materials, such as where an AF-FM competition occurs[10]. However, many manganites present a more pronounced peak at intermediate T’s. To reproduce this feature, it is necessary to introduce a percolative process not only as (or x) varies, but also as T changes. This is reasonable since the metallic component triggered by ferromagnetism is sensitive to T, and the FM clusters shrink in size as T increases. This proposal was tested qualitatively using two models: (i) the Random Field Ising model (RFIM), that describes the disorder-induced PS[5], with spin up and down crudely representing the competing metal and insulator, and (ii) the well-known one-orbital model[3] (with parameters t, , and representing the -hopping, Hund coupling, and Heisenberg exchange among -spins, respectively). The latter is supplemented by a term ni, with randomly taken from [-W,W] and ni the on-site density at site . This disorder generates coexisting clusters near first-order FM-AF transitions, as explained in Ref.[5].
In Fig.2a, it is shown a portion of a typical Monte Carlo (MC) simulation of the RFIM at T=1.6 on a 500500 cluster, with fixed random fields taken from [-1.0,1.0] (J=1 is the FM Ising coupling). These parameters are the same as in Ref.[5]. Three main domains were found: spins-up (black), spins-down (white), and regions with a small spin expectation value (grey). The generation with T of these paramagnetic (PM) areas in the surface of the up and down domains weakens the percolative tendencies of the RFIM: for example, in Fig.2a domains connected at T=0, become disconnected at finite-T. Similar behavior occurs in the microscopic one-orbital case, as shown in Fig.2b for a disordered configuration with percolative features[11]. Increasing T from 0.0 to 0.05t decouples the two FM regions. FM, AF, and PM regimes dominate at finite T, as in the RFIM. The T=0.05t Drude weight (not shown) is much smaller than at T0.0.
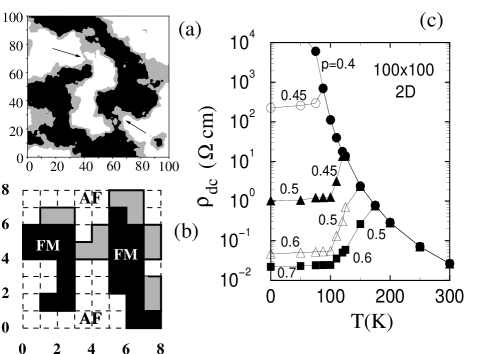
To incorporate the indications of T-induced percolation (Figs.2a-b) in the phenomenological approach, a T-dependent metallic fraction is needed. must decrease as T grows, should vary rapidly near the Curie temperature as the magnetization does, but otherwise its T-dependence is unknown. Fortunately, the qualitative results using several functions are similar, and a typical case is shown in Fig.2c. The ’s obtained by this simple procedure now clearly resemble those found in experiments, with a robust peak at intermediate T’s, moving toward lower T’s as the system becomes more insulating. This agreement with experiments is unlikely to be accidental, and justifies a posteriori our assumptions. Note that if our approach is correct, consistency requires that in Mn-oxides above there should exist (disconnected) FM clusters on an insulating matrix, since does not drop abruptly to 0 at . A new temperature scale T∗ is predicted, with those FM clusters existing in the range TT∗. The density of states in this regime likely has a , based on previous investigations of mixed-phase states[3, 5].
Consider now nanometer-scale clusters. Here quantum effects cannot be neglected. However, the problem is still too difficult to be treated microscopically, and an effective description is needed. For this purpose, instead of a resistor network, a 3D lattice model with NN electron hopping (and zero chemical potential) is here used, with link hopping amplitudes randomly selected to be either “metallic” () or “insulating” (), representing effective hoppings through the nanoclusters with 1 (0) corresponding to the FM (AF) regions of the microscopic model at large . Such “lattice of quantum wires” has been used before to study quantum percolation[12]. The cluster conductance (in units) is calculated using the Kubo formula within a Landauer setup[13], connecting the finite clusters to semi-infinite leads using an infinitesimal voltage drop. The self-energy of these leads is known exactly[13], and the lead on the, e.g., right is used for an iterative calculation of the self-energy from right to left through the cluster, supplemented by a self-energy matching at the left end. With the Green function obtained by this procedure, is evaluated using known formulas[13]. Since this is percolation, the study is only in 3D (2D localization leads to zero conductivity).
The hoppings and are not available from experiments. However, should decrease with increasing T following the FM-phase magnetization, while increases with T (since, e.g., the zero-conductivity T=0 AF configuration disorders as T grows). was obtained on up to 203 clusters using the (T) and (T) in the inset of Fig.3a, but the results do not depend qualitatively on the particular functions used, as long as changes rapidly with T near room-T, as does in experiments. The metallic fraction in Fig.3a was made T-dependent as in Fig.2c, and the critical percolation at T=0 is expected to be located near 0.45 [12]. Results are shown in Fig.3a[14]. Once again a remarkable qualitative agreement with experiments is obtained, suggesting that both nano- and micro-meter clusters lead to similar results.

For completeness, was also calculated using microscopic models on small lattices. A MC simulation of the one-orbital model on an 88 PBC cluster and density x=0.5 was performed. From previous work[5], it is known that a metal-insulator first-order transition occurs at 0.07 (if =). Disorder is introduced such that in the NN-sites link ij the hopping is =1+ and Heisenberg coupling is =(1+), where is randomly taken from [-,], and is uniform. This disorder makes the transition continuous[5]. The MC procedure generates -spin configurations from which NN-sites effective hoppings can be calculated (as in double exchange models). These hoppings are used to evaluate (Fig.3b). Due to the disorder, interpolates smoothly from metal to insulator varying (otherwise a discontinuous transition occurs). (T0) can be very large, but finite, if the appropriate value of is selected[15]. In this respect the result has clear similarities with those of the macroscopic approach. However, the full shape of the experimental curves is difficult to reproduce with microscopic models on small clusters where percolation cannot be studied. Nevertheless, for the (few) disorder configurations with percolative-like characteristics found on small systems (as in Fig.2b), the associated vs T has a broad maximum at a finite T.
Consider now nonzero magnetic fields (). In the random-network model mimicking coexisting FM-AF regions, a small will increase the FM fraction by a concomitant small amount. However, near percolation tiny modifications in can induce large changes, as shown in Fig.2b where a 5% modification in at low-T can alter by two orders of magnitude. In the percolative regime, “small” perturbations can drastically change the conductivity. This analysis predicts that the metallic state reached from the insulator with magnetic fields is homogeneous but must still have a substantial fraction of insulating clusters. This is consistent with the experimental large (T=0) of such a state.

Another effect contributes to this phenomenon. It exists even on chains where percolation does not occur, and it is illustrated in Fig.4a where is shown using the microscopic half-doped one-orbital model at =0.14 where the system is at a FM(metal)-AF(insulator) transition, the latter with the periodic spin structure , as shown in Ref.[5]. The field is introduced as , where =, with the -component of the classical -spin at site with norm 1, and the spin of the mobile electron at the same site. Disorder in the hopping and (as in Fig.3b) of strength =0.03 produces coexisting FM-AF clusters[5]. The nearly perfect AF-links at low-T induce a huge at =0. However, field modifications of just 0.01t (17 Tesla, if =0.2eV) produce dramatic changes in at low-T (Fig.4a). The resulting at 0.0 is still large, but compared with (=0) the effect is notorious. An analysis of the spin correlations vs shows that these large resistance changes mainly originate in the regions, since small fields produce a small spin canting and concomitant small conductivity, creating a effect between metallic domains. In real manganites, a relatively modest change in the insulating regions could contribute appreciably to the large MR. To simulate this effect, of the 2D network of Fig.2c was slightly modified (=), with untouched. The resulting changes (Fig.4b) are indeed large at low-T, comparable to those obtained changing by a few percent.
Summarizing, the manganite was studied within the PS-framework using a semi-phenomenological approach. At room-T, conduction predominantly through the insulating regions leads to d/dT0, while at low-T the metallic filaments carry the current. The large MR induced by magnetic fields is caused by small changes in the metallic fraction and/or in the conductivity of the insulator, effects which severely affect transport near percolation. Our approach provides a simple explanation of the CMR effect, without invoking polaronic or Anderson localization concepts, and independently of the origin (Coulomb vs Jahn-Teller) of the competing phases.
The authors thank S. Yunoki for the programs used for Figs.2b-3b-4a, and NSF (DMR-9814350), Comision Interministerial de Ciencia y Tecnologia de España (PB96-0085), MARTECH, CDCH (Univ. Central de Venezuela), and Fundación Antorchas for support.
REFERENCES
- [1] Y. Tokura and N. Nagaosa, Science 288, 462 (2000).
- [2] M. Uehara et al., Nature 399, 560 (1999). See also M. Ibarra, and J. De Teresa, JMMM 177-181, 846 (1998); M. Fäth et al., Science 285, 1540 (1999); D. Louca and T. Egami, Phys. Rev. B59, 6193 (1999).
- [3] A. Moreo et al., Science 283, 2034 (1999). See also S. Yunoki et al., Phys. Rev. Lett. 80, 845 (1998).
- [4] S. Yunoki et al., Phys. Rev. Lett. 81, 5612 (1998); 84, 3714 (2000); T. Hotta et al., ibid 84, 2477 (2000); J. van den Brink et al., ibid 83, 5118 (1999).
- [5] A. Moreo et al., Phys. Rev. Lett. 84, 5568 (2000).
- [6] Localization to understand the insulator above was studied in L. Sheng et al., Phys. Rev. Lett. 79, 1710 (1997). However, V. Smolyaninova et al., cond-mat/9903238, showed that the metal-insulator transition of is not due to Anderson localization.
- [7] S. Kirkpatrick, Rev. Mod. Phys. 45, 574 (1973).
- [8] Since (T0) of y=0.42 LPCMO is finite, the net (T=0) does not diverge below the naively expected critical point =0.50 of a simple 2D network with =.
- [9] R. Mathieu et al., cond-mat/0007154.
- [10] S. Kawasaki et al., J. Phys. Soc. Jpn. 67, 1529 (1998).
- [11] “Percolative” configurations are rare in small clusters.
- [12] Y. Avishai and J. M. Luck, Phys. Rev. B45, 1074 (1992).
- [13] J. A. Vergés, cond-mat/9905235. See also S. Datta, Electronic Transport in Mesoscopic Systems, Cambridge University Press, Cambridge, 1995, and M. Calderon, J. Vergés, and L. Brey, Phys. Rev. B59, 4170 (1999).
- [14] It was verified by a finite-size-scaling analysis that the conductances shown in Fig.3a are in the ohmic regime.
- [15] Similar results were obtained using the two-orbital model[4] in one-dimension, near a FM-AF transition[5].