Electron Glass in Ultrathin Granular Al Films at Low Temperatures
Abstract
Quench-condensed granular Al films, with normal-state sheet resistance close to 10 k/, display strong hysteresis and ultraslow, non-exponential relaxation in the resistance when temperature is varied below 300 mK. The hysteresis is nonlinear and can be suppressed by a dc bias voltage. The relaxation time does not obey the Arrhenius form, indicating the existence of a broad distribution of low energy barriers. Furthermore, large resistance fluctuations, having a -type power spectrum with a low-frequency cut-off, are observed at low temperatures. With decreasing temperature, the amplitude of the fluctuation increases and the cut-off frequency decreases. These observations combine to provide a coherent picture that there exists a new glassy electron state in ultrathin granular Al films, with a growing correlation length at low temperatures.
pacs:
PACS numbers: 72.80.Ng, 73.50.-h, 64.60.My, 05.40.-aThe electron glass was first predicted to exist in disordered interacting systems nearly two decades ago [1]. Such nonergodic behavior is very interesting because one normally expects electron systems to relax rather rapidly. Over the years, a number of studies have been reported in which electrons display glassy dynamics that are often associated with non-exponential relaxation extending over many decades in time, such as the field-effect conductance measurements in compensated GaAs [2], amorphous indium-oxide films [3], and ultrathin Bi/Ge and Pb/Ge films [4]. The glassy behavior is believed to arise from the electron-electron (e-e) interactions and the Coulomb gap [5, 6, 7]. Recently, the electron glass has received renewed interest [8] as the subject of e-e interactions has become a central topic in understanding the metal-insulator transition in two-dimensions [9]. However, the precise role that the Coulomb gap plays in the observed glassy behavior is not clear since there is no simultaneous measurement of the conductance relaxation and the single particle density of states. In addition, there is no direct experimental effort to probe the correlation length in the glassy phase.
In this Letter we report glassy behavior in the normal state of quench-condensed weakly insulating granular Al films of sheet resistance, , of about 10 k/ at 300 mK. We measure the relaxation of after the temperature was varied. We have focused on weakly insulating films because on the order of 10 k/ is easy to measure using sensitive ac lock-in techniques, which turn out to be crucial in measuring the resistance fluctuations described below. We observed that, below 300 mK, the resistance was strongly hysteretic and displayed ultraslow, non-exponential relaxation as the temperature was varied. We have also observed strong nonlinear behavior in the hysteretic regime. What was unique to our work was the first observation in quench-condensed metal films of large resistance fluctuations below 100 mK. We argue that these observations indicate the existence of a glassy electron state in ultrathin granular Al films with a growing correlation length at low temperatures.
Our Al films were quench-condensed onto glass substrates using 99.999 purity Al sources in UHV conditions inside a dilution refrigerator, with the substrates being held near 20 K during evaporation. The film thickness was near 25 Å. After warming up to room temperature, the films showed a granular morphology with a typical grain size of about 300 Å, as seen in scanning force microscopy studies. The films had a multi-lead pattern with an area of 33 mm2 between the neighboring leads. An analog lock-in amplifier, operating at 27 Hz with a time constant of 3 seconds, was used to measure the four-probe ac resistance. The ac probe current was fixed at 1 nA, producing an ac voltage of about 10 V across a film section. For nonlinear studies described below, an additional dc bias voltage was applied. All the data described below were measured in the normal state, with superconductivity being suppressed by a magnetic field above the spin-paramagnetic limit [10, 11] of about 48 kG. To date, we have performed detailed studies on films of 10 k/. Such films appeared to be very uniform, with varying less than 5 among the various sections of the multi-lead pattern. These films are far above the percolation threshold since scales with inverse film thickness.
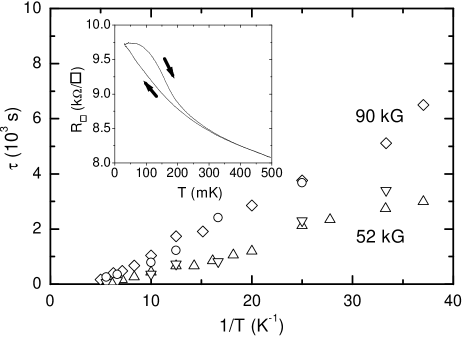
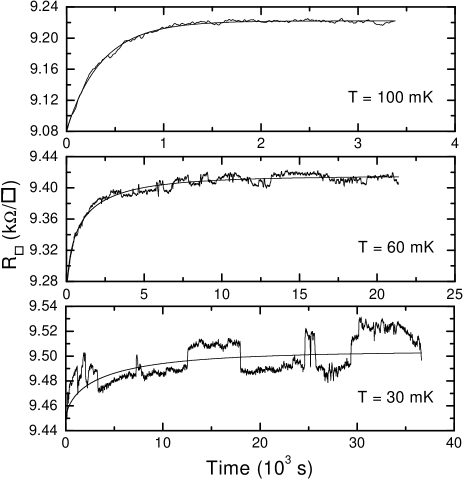
In the inset to Fig. 1, we show a typical resistance hysteresis measured on one Al film as temperature was cycled between 500 and 30 mK, in the high-field normal state with a field, 52 kG, applied perpendicular to the film plane. Throughout all our experiments, the rates of cooling and heating were kept constant on a logarithmic temperature scale, and the cooling and the heating cycles each took 1.5 hr. We can exclude temperature lag or heating as the cause of the hysteresis, because we have not observed any hystersis in Li films of 10 k/ and Be film of 3 500 k/, both quench-condensed on the same glass substrates. For relaxation studies, the films were first cooled from 500 mK to the desired temperature, , using the above logarithmic rate, at which was measured as a function of time. In Fig. 2, we show the vs. time curves for a number of fixed in a field of 52 kG. We found that the curves at higher , such as 100 mK, could be fit very well to a stretched-exponential form, , over three decades in time. With decreasing , the time constant increased sharply. The exponent scattered between 0.6 and 0.8 at low without a clear trend. We note that below 100 mK, the large resistance fluctuations seen in Fig. 2 made it difficult to accurately determine and . In the main part of Fig. 1, we plot vs. for two field values in both perpendicular and parallel field orientations. Data in Fig.1 appear to fall into two groups: one at 52 kG and the other at 90 kG, suggesting that was larger in higher fields and was insensitive to field orientation. The almost linear dependence of on in Fig. 1 indicates that, with decreasing , increased much slower than the Arrhenius law, , where is known as the activation energy describing the typical energy barrier to relaxation [12]. Such non-Arrhenius behavior can be explained only if there exists a very broad distribution of low-energy barriers. Relaxation occurs over lower energy barriers with decreasing , leading to a relaxation time that increases slower than the Arrhenius law.
The above conclusion is also supported by the nonlinear effects in the hysteresis. For nonlinear studies, we have measured in the presence of a dc bias voltage, , across the films, and have observed that the hysteresis can be suppressed if is large enough. The experimentally relevant was of the order of 0.5 mV. It leads to a bias current of 0.05 A and a Joule heating of 2.510-11 W. We believe that the nonlinear effects were not caused by heating. Consider the hysteresis shown in the inset to Fig. 1, we observed that, between 100 mK and 200 mK, the heating curve shifted downward and the cooling curve shifted upward with increasing . It is obvious that had heating by the bias current been significant the cooling curve should have also shifted downward with increasing , since the resistance of weakly insulating films should decrease with increasing . In Fig. 3(a), we plot the width of the hysteresis, , versus for various values. Such data are obtained by subtracting the cooling curve from the heating curve in a thermal cycle such as the one shown in the inset to Fig. 1. It is quite revealing in that the bias voltage does not uniformly suppress the hysteresis across the entire range of . Instead, a small suppresses the low- components of the hysteresis only. With increasing , progressively higher- components of the hysteresis are suppressed. We believe that relaxation processes over low-energy barriers are suppressed by the bias voltage in the same way the low- components of the hysteresis are suppressed. Nevertheless, we have yet to develop quantitative methods to analyze the data in Fig. 3(a) to obtain the distribution of low-energy barriers. We note that the falling off of at low in the 0 curve in Fig. 3(a) was an experimental artifact because we did not wait at 30 mK for the system to relax after cooling down from 500 mK. Had we waited long enough before heating up towards 500 mK, would have been the largest at 30 mK for the 0 curve.
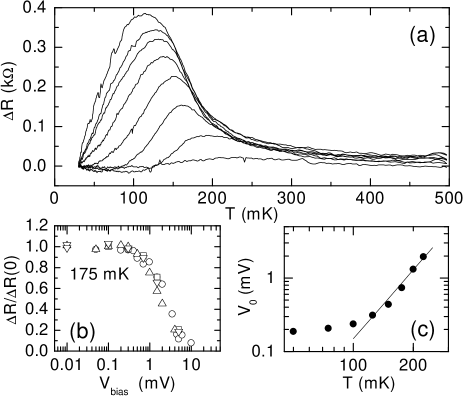
If we make a vertical cut at a fixed , such as 175 mK, in Fig. 3(a), we obtain as a function of . We have observed that the absolute value of varied with the strength and the orientation of the magnetic field. However, if we scale by its value in the 0 limit, , the resulting scaled width, /, appears to be independent of the strength and the orientation of the field. This is demonstrated by the good data collapse in Fig. 3(b) in which we plot four sets of such scaled data at 175 mK as a function of for two field values in both perpendicular and parallel orientations. In this semi-log plot, falls off steeply for 0.7 mV. This suggests that there is a field-independent threshold bias, 0.7 mV, that suppresses the hysteresis. By making vertical cuts at various temperatures in Fig. 3(a), we observe that decreases with decreasing . This is consistent with the picture that relaxation occurs over lower energy barriers at lower ; as a result, the value of for suppressing the hysteresis is also lowered. We plot vs. in Fig. 3(c). The flattening of the data below 100 mK is again due to the experimental artifact discussed earlier. For the high- part of the data, can be fit to a power law temperature dependence, , as shown by the solid line in the inset to Fig. 3.
The results discussed above suggest the existence of a glassy state in our quench-condensed ultrathin granular Al films. The low temperature scale of our experiments excludes the possibility of glassy structural relaxation, such as atomic diffusion between metastable configurations similar to those observed in a-Si:H [13]. Tunneling studies have shown in such Al films [14], as well as in other films of similar sheet resistance [15], that an anomaly in the density of state exists at the Fermi energy. However, a true Coulomb gap has not been found in such weakly insulating films. Thus it is not clear what role, if any, the Coulomb gap plays in the observed glassy relaxation. In addition, we did not find any hysteresis in quench-condensed Li films of 10 k/ and Be films of 3 500 k/, even though a true Coulomb gap has been observed in Be films [16]. While we were not able to investigate the morphology of the Li films, which become unstable in air, scanning force microscopy studies of the Be films warmed up to room temperature did not find any granular structure down to 1 nm. Because of the morphological difference, we propose that granularity plays an important role in the glassy behavior of our Al films.
Consider a simple conduction model for granular metals in which an electron moves from one neutral grain to another nearby one to create a charge-anticharge pair [17]. The energy cost for creating such a pair is 2, where is the grain charging energy, with C being the capacitance of a grain. can be significant if the grains are small, and can vary strongly with location due to the randomness in grain sizes. This results in a rough potential background for the charge carriers. Transport is mediated via the ionization of such pairs [18], with the energy associated with ionization being the Coulomb attraction between the pair, which, in two dimensions, has a logarithmic form with a cutoff length [19]. This model has motivated experiments searching for a finite- Kosterlitz-Thouless-Berezinskii charge unbinding transition in arrays of Josephson junctions [19, 20] and granular films [21]. However, in a recent theoretical study of capacitively coupled grains, Granato and Kosterlitz [22] have found that finite- transitions are suppressed by disorder. They found instead a charge glass with a correlation length that diverges as temperature decreases to zero. They have also predicted that nonlinear behavior sets in at a characteristic voltage , with a thermal critical exponent 1.7 characterizing the 0 charge glass transition. It is interesting to note the closeness of this predicted power-law dependence with the power-law fit in Fig. 3(c). However, we caution that our fit has a limited range. Within this picture of granular transport, we can qualitatively understand the behavior of the films in an applied magnetic field as shown in the main part of Fig. 1. The field splits the singlet states, effectively reducing the density of states. As a result, the relaxation time increases with increasing magnetic field, however, it is insensitive to the orientation of the field.

We note that the data in Fig. 2 show drastic increases in the size and decreases in the characteristic frequency of the resistance fluctuations with decreasing , as shown by the 60 mK and 30 mK curves. This is a unique feature in our data that has not been reported in similar quench-condensed films. We have analyzed such noise data using a fast Fourier transform (FFT). We first obtain the noise time traces by subtracting the stretched-exponential fitting curves from the vs. time traces. The noise time traces are then analyzed using FFT. Figure 4 shows a set of such spectra obtained from data at a number of temperatures with 52 kG, including the three traces shown in Fig. 2. There are two distinguishing features in the spectra. The first is that, the 30 mK spectrum, which has the broadest frequency range, clearly has a -type form [23] over a wide range of frequency, indicating that fluctuations occur at all frequencies. The second is that all the spectra in Fig. 4 level off at low frequencies, indicating a low-frequency cut-off in the spectra which clearly shifts to lower frequencies as is lowered. The increase in the magnitude of the low-frequency fluctuations and the decrease in the cut-off frequency with decreasing in Fig. 4 indicate that the number of low-energy states increases. We suggest that these two features arise from the collective hopping of many correlated electrons. The cut-off frequency should be a measure of the characteristic frequency of fluctuations occurring on the length scale of the correlation length. A decreasing cut-off frequency with decreasing indicates an increasing correlation length. We also point out that the power spectra for all the temperatures shown in Fig. 4 nearly follow a single curve for 10-2 Hz, with a frequency dependence of . Such behavior deviates significantly from the behavior seen in the 30 mK curve at low frequencies. Although the origin of such behavior is unknown, it is possible that this nearly temperature independent high-frequency feature is not related to collective electron hopping. Rather, it is the emerging part of the spectra at low temperatures that represents the appearance of collective electron hopping. In general, we expect the following relation between the cut-off frequency, , the correlation length, , and : , where is the correlation length exponent and is the dynamical critical exponent. Ideally, one measures the noise using a sensitive bridge setup [24] in which the large and non-fluctuating resistance background is eliminated, rather than the simple four-terminal methods used in this study. In addition, the fluctuations should be measured when the system is in a steady-state, instead of in the initial relaxation process as shown in Fig. 2. Future experiments taking the above mentioned concerns into account should provide an accurate determination of and the critical exponents.
In conclusion, we have found strong evidence for a new glassy electron state in quench-condensed ultrathin granular Al films, with a growing correlation length at low temperatures. We gratefully acknowledge numerous invaluable discussions with S. Teitel, Y. Shapir, Y. Gao, and P. Adams. We thank S. Zorba and Y. Gao who performed scanning force microscopy studies of the quench-condensed Al and Be films.
REFERENCES
- [1] J. H. Davies, P. A. Lee, and T. M. Rice, Phys. Rev. Lett. 49, 758 (1982); M. Pollak, Phil. Mag. B 50, 265 (1984); R. N. Bhatt and T. V. Ramakrishnan, J. Phys. C 17, L639 (1984).
- [2] D. Monroe et al., Phys. Rev. Lett. 59, 1148 (1987).
- [3] Z. Ovadyahu and M. Pollak, Phys. Rev. Lett. 79, 459 (1997); A. Vaknin, Z. Ovadyahu, and M. Pollak, ibid. 81, 669 (1998).
- [4] G. Martinez-Arizala et al., Phys. Rev. B 57, R670 (1998).
- [5] M. Pollak, Discuss. Faraday Soc. 50, 11 (1970).
- [6] A. L. Efros and B. I. Shklovskii, J. Phys. C 8, L49 (1975); B. I. Shklovskii and A. L. Efros, Electronic Properties of Doped Semiconductors (Springer, Berlin, 1984).
- [7] C. C. Yu, Phys. Rev. Lett. 82, 4074 (1999).
- [8] E. Orignac, T. Giamarchi, and P. Le Doussal, Phys. Rev. Lett. 83, 2378 (1999); A. A. Pastor and V. Dobrosavljević, ibid. 83, 4642 (1999).
- [9] D. Simonian et al., Phys. Rev. Lett. 79, 2304 (1997).
- [10] P. M. Tedrow and R. Meservey, Phys. Rev. B 8, 5098 (1973).
- [11] Wenhao Wu, R. G. Goodrich, and P. W. Adams, Phys. Rev. B 51, 1378 (1995).
- [12] K. Binder and A. P. Young, Rev. Mod. Phys. 58, 801 (1986).
- [13] J. Kakalios and W. B. Jackson, in Amorphous Silicon and Related Materials, ed. H. Fritzsche (World Scientific, 1988), p. 207.
- [14] Wenhao Wu, J. Williams, and P. W. Adams, Phys. Rev. Lett. 77, 1139 (1996).
- [15] A. E. White, R. C. Dynes, and J. P. Garno, Phys. Rev. B 31, 1174 (1985); Shih-Ying Hsu and J. M. Valles, Jr., ibid. 49, 16600 (1994); J. M. Valles, Jr., R. C. Dynes, and J. P. Garno, ibid. 40, 7590 (1989); Y. Imry and Z. Ovadyahu, Phys. Rev. Lett. 49, 841 (1982).
- [16] E. Bielejec, J. Ruan, and Wenhao Wu, Phys. Rev. Lett. 87, 036801 (2001).
- [17] C. A. Neugebauer and M. B. Webb, J. Appl. Phys. 33, 74 (1962).
- [18] B. Abeles et al., Adv. Phys. 24, 407 (1975).
- [19] J. E. Mooij and G. Schn, in Single Charge Tunneling: Coulomb Blockade Phenomena in Nanostructures, eds. H. Grabert and M. H. Devoret (Plenum Press, New York, 1992), p. 275.
- [20] J. E. Mooij, et al., Phys. Rev. Lett. 65, 645 (1990); P. Delsing et al., Phys. Rev. B 50, 3959 (1994); H. S. J. van der Zant et al., ibid. 54, 10081 (1996).
- [21] Y. Liu and J. C. Price, Mod. Phys. Lett. B 9, 939 (1995).
- [22] E. Granato and J. M. Kosterlitz, Phys. Rev. Lett. 81, 3888 (1998).
- [23] P. Dutta and P. M. Horn, Rev. Mod. Phys. 53, 497 (1981).
- [24] J. H. Scofield, Rev. Sci. Instrum. 58, 985 (1987).