Off equilibrium magnetic properties in a model of repulsive particles for vortices in superconductors
Abstract
We study the properties of a simple lattice model of repulsive particles diffusing in a pinning landscape. The behaviour of the model is very similar to the observed physics of vortices in superconductors. We compare and discuss the equilibrium phase diagram, creep dynamics, the Bean critical state profiles, hysteresis of magnetisation loops (including the second peak feature), and, in particular, “aging” in relaxations.
Important dynamical phenomena ranging from slow relaxations or hysteresis, to the anomalous “second peak” in magnetisation loops, are found in vortex physics of many different superconductors within a broad range of material parameters. This observation suggests that some basic general mechanisms are responsible for the observed phenomenology [1, 2, 3, 4] and that schematic models from statistical mechanics can be successfully used to describe vortex matter [1, 2, 3, 4, 5, 6, 7].
We consider here a simple statistical mechanics model that appears to reproduce a very wide range of properties of vortices, ranging from dynamical behaviours to phase transitions. The model is an extension of a Multiple Occupancy cellular-automaton-like Model recently introduced by Bassler and Paczuski (BP) [7] to study vortex dynamics at coarse grained level. We introduce the vortex Hamiltonian in order to be able to consider non-zero temperature effects in a consistent way and study them by Monte Carlo (MC) and replica theory methods. Our extension of the BP model also limits the occupancy of the individual lattice sites to correctly take into account the finiteness of the upper critical field. This point is of crucial importance for the phenomenological predictions of the model. This leads us to a Restricted Occupancy Model (ROM).
We find that even the two dimensional version of the model is able to qualitatively reproduce many features similar to those observed in real superconducting samples, including a reentrant equilibrium phase diagram, creep dynamics, hysteresis of magnetisation loops, “second peak”, and others. Here, in particular, we describe its off equilibrium magnetic properties. The model, simple and thus tractable, nevertheless appears to capture significant aspects of the essential physics and help to establish a simple unified reference frame.
The model – A detailed description of the interaction potential, , between vortices depends on the considered region in the temperature-magnetic field () plane. For instance, at low field the London approximation can be used to derive two body potentials [2], whereas at elevated fields other approximations, such as the lowest Landau level approximation, may become relevant (see eg. [8]). Like in the BP model we consider here a coarse grained lattice version of an interacting vortex system, with a coarse graining length scale, , of the order of the natural screening length of the problem (typically, the magnetic penetration length ). After coarse graining, the original interaction potential, , is reduced to an effective Hamiltonian coupling . In this way a drastic reduction of degrees of freedom is accomplished and the resulting schematic effective model can be more easily dealt with. The price to pay is the the loss of information on scales smaller than . However, some general features of the system behaviour can survive at the level of the coarse grained description. In the above perspective, below we only consider the essential properties of vortices interaction, i.e., a mutual repulsion amongst vortices together with a spatially inhomogeneous pinning interaction. The present description can be, of course, refined by reducing the value of . We consider the Hamiltonian:
| (1) |
In eq.(1), is an integer occupancy variable equal to the number of particles on site . The parameter importantly bounds the particle density per site below a critical value and represents the upper critical field in type II superconductors. Particles also have a “charge” and neighbouring particles with opposite “charge” annihilate. The first term in eq.(1) represents the repulsion between the particles [2]. Since the coarse graining length is taken to be of order we choose a finite range potential: ; if and are nearest neighbours; for all others couples of sites. The second term in eq.(1) just normalises the particle self-interaction energy. The third term corresponds to a random pinning potential, with a given distribution , acting on a fraction of lattice sites (below we use ). For simplicity we choose a delta-distributed random pinning: . To control the overall system “charge density” we can add a chemical potential term to the above Hamiltonian (). The parameters entering the model can be qualitatively related to material parameters of superconductors. The inter-vortex coupling sets the energy scale. The ratio can be related to the Ginzburg-Landau parameter [9] and, in general, is expected to be an increasing function of . The last parameter is a fraction of .
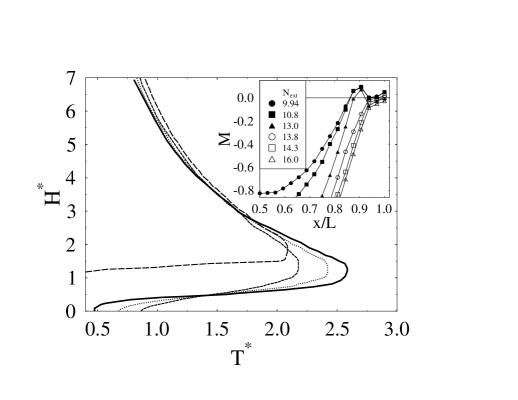
To understand the equilibrium properties of the ROM model we briefly consider its replica mean field theory (MF). In this approximation the equilibrium phase diagram in the plane (where and ) can be analytically dealt with (see Fig.1). In absence of disorder it clearly shows a reentrant phase transition from a high temperature low density fluid phase to an ordered phase, in analogy to predictions in superconductors [1, 5].
For moderate values of the pinning energy (), a second order transition still takes place, which at sufficiently strong pinning is expected to become a “glassy” transition, as is seen in Random Field Ising Models [10]. For the 2D lattice we consider below (in limit ), a numerical investigation is consistent with a first order transition. In MF, the extension of the low phase shrinks by increasing (i.e., the highest critical temperature, , decreases) and the higher is the smaller the reentrant region. These findings are in agreement with experimental results on vortex phase diagrams (see Ref.[1] or, for instance, 2H-NbSe2 superconductors from Ref.[11]).
We now go beyond MF theory and discuss the dynamical behaviour of the model. We performed MC simulations on a 2D square lattice system (we use typically ) described by eq.(1). The system is periodic in the -direction and has the two opposite edges in the -direction in contact with a reservoir of particles. The reservoir is described by with and kept at a given density . Particles undergo diffusive dynamics and are introduced and escape the system only trough the reservoir. The parameters of our simulations are usually ; ; . We have sampled several values of .
We are interested in the dynamical properties of the system in the low region of the above phase diagram. Here the 2D model has interesting magnetic hysteretic behaviours. In our MC simulations we ramp (starting from zero and later back to zero) at a given rate and record the magnetisation, ( is the “charge” density inside the system) as a function of . Such a ramping induces a Bean-like profile in our lattice (inset of Fig.1) with a structure similar to some experimental data (see, for instance, [12]).
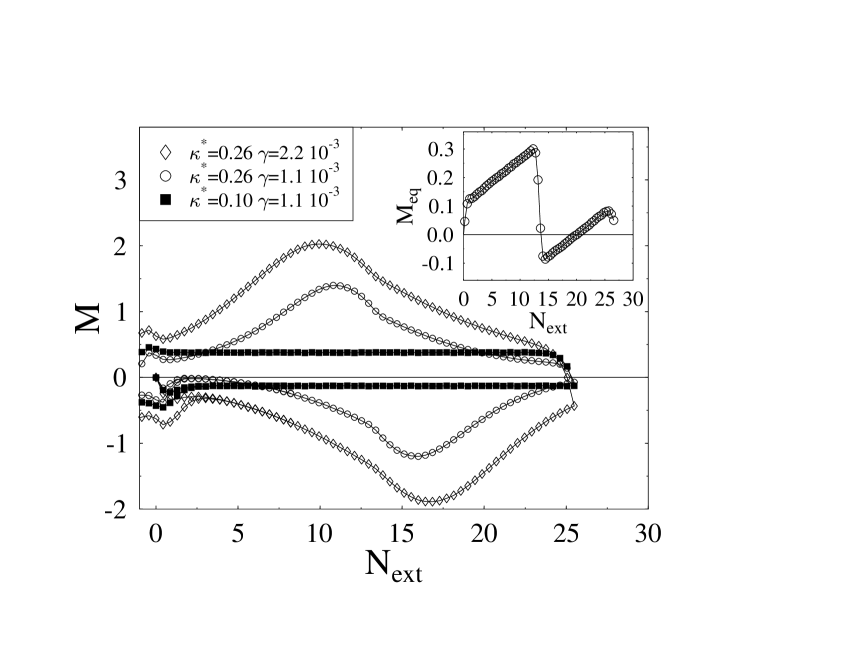
At low temperatures ( [13]), a pronounced hysteretic magnetisation loop is seen (see Fig. 2), and when is high enough () a definite second peak appears in . In the present case the origin of the second peak is very simple. At high density and , groups of vortices, frustrated in minimising their repulsive interaction energy, are forced to cluster together forming macroscopically extended energetic barriers which cage other diffusing vortices. In Fig.3 we plot the average energy barrier, , a particle meets during the same runs for shown in Fig.2. A “trial” vortex approaching groups of clustered vortices has to pass over these barriers to move further. This dynamically generates the second peak. The final decrease in at high is, here, due to a “softening” of these barriers caused by saturation effects related to the finite value of . The first peak in the magnetisation stems from the fact that density variations in the reservoir are only slowly transmitted in the system when it is in the low density “fluid” phase. The second peak and hysteretic loops at moderate-high are also present when ( also determines the difference in the amplitude of between the increasing and decreasing ramps). Very similar magnetisation data are observed in a number of different superconductors from intermediate to high values (see, for instance, ref.s in [4, 11, 14]).
The actual shape of loops strongly depends on the parameters of the dynamics (and system size). In particular, the sweep rate of the external field, , is very important. As soon as the inverse sweep rate is smaller than the characteristic relaxation time (which can be extremely long, inaccessible on usual observation time scales, see below) strong off-equilibrium effects are present, such as metastability or “memory” and “aging” [3, 11, 14]. As a first example of these facts, we show in the right inset of Fig.3 the dependence of the second peak height, , on . At low temperatures and not too low (), is approximately logarithmically dependent on over several decades:
| (2) |
Such a behaviour gets closer to a power law at lower (for instance, at ). Eventually, when is smaller than a characteristic threshold, , exponentially saturates to its asymptotic value (this usually is orders of magnitude smaller than at high ). Interestingly these findings are also very close to what is experimentally observed in superconductors [4, 3]; an example from an YBCO sample (from [15]) is given in the left inset of Fig.3. The threshold, , is strongly dependent on the system density (and system size) and is a rapidly decreasing function of ; for instance at , for ( is the location of ), but . is a measure of the system characteristic equilibration times (which can be huge).
Seemingly a dynamical phenomenon, in the ROM model the second peak is related to a true transition: in the limit, its location, , is associated with a sharp jump in , where its fluctuations increase with system size (see inset of Fig.2). These findings are consistent with experiments (for instance, see Ref.[11]) and to some extents reconcile opposite descriptions (“static” v.s. “dynamic”) of the phenomenon.
It is also interesting to consider the “creep rate” , which is often associated to a measure of the intrinsic energy barriers in the creep process [3]. Experimentally, is a non trivial function of the magnetic field (see for instance [15, 3]). We find that, due to the very long relaxation times, is in itself a (slowly varying) function of , up to when is smaller than the smallest . In Fig.4 we show how depends on in the ROM model: for and we plot as a function of the average of over two different intervals (filled circles) and (filled squares). The difference between the two is apparent. We note a remarkable correspondence with experimental data for YBCO, shown for the quoted sample in the inset of Fig.4.
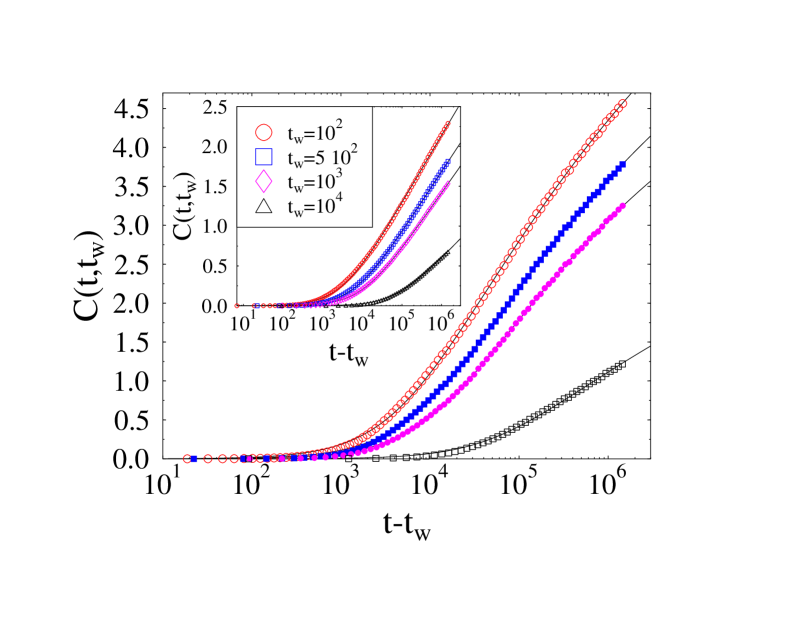
The presence of the above “memory” effects indicate that the system, on the observed time scales, can be well off equilibrium. To reveal the underlying non-stationarity of the dynamics we consider two times correlation functions and, at a given , we record () [16]:
| (3) |
Fig.5 clearly shows that exhibits strong “aging”: it explicitly depends on both times, contrary to situations close to equilibrium, where is a function of the times difference . In particular at high and low (where relaxation times are very high) can be well fitted by a generalisation of a known interpolation formula, often experimentally used [1], which now depends on the waiting time, : . We found that to take is consistent with our data. Notice the presence of scaling properties: for not too short times is a function of only the ratio : . This is a fact in agreement with general scaling in off equilibrium dynamics (see Ref.[18]) and in strong analogy with other systems (from glass formers to granular media [17, 18, 19, 20]). Experimental measurements of would be very valuable.
In conclusion, in the context of a simple tractable model we depicted a panorama of magnetic properties of vortices in type-II superconductors. Even the 2D version of the model has many interesting features in correspondences with experimental results and allows clear predictions on the nature vortex dynamics. The origin of the slow off equilibrium relaxation (observed at low ) is caused by the presence of very high free energy barriers self generated by the strong repulsive interaction between particles at high densities (for above a threshold). In this respect the pinning potential plays a minor role. For instance, the presence of a “second peak” in , is also observed in the limit . The second peak doesn’t mark the transition to a “glassy” phase, but is also present in such a case. sets the position and amplitude of the reentrant order-disorder transition line, which is in turn distinct from the second peak locations.
At low temperatures on typical observation time scales, the system is strongly off equilibrium. This is most clearly seen from “aging” found in two-times correlation functions. These obey scaling properties of purely dynamical origin Experimental check of these results would be extremely important to elucidate the true nature of vortex dynamics.
Acknowledgements We thank L. Cohen and G. Perkins for useful discussions and for the YBCO data. Work supported by the EPSRC and PRA-INFM-99.
REFERENCES
- [1] G. Blatter, M.V. Feigel’man, V.B. Geshkenbein, A.I. Larkin, V.M. Vinokur, Rev. Mod. Phys. 66, 1125 (1994).
- [2] E. H. Brandt, Rep. Prog. Phys. 58, 1465 (1995).
- [3] Y. Yeshurun, A.P. Malozemoff, A. Shaulov, Rev. Mod. Phys. 68, 911 (1996).
- [4] L.F. Cohen and H.J. Jensen, Rep. Prog. Phys. 60, 1581-1672 (1997).
- [5] D.R. Nelson, Phys. Rev. Lett. 60, 1973 (1988).
- [6] M.P.A. Fisher, Phys. Rev. Lett. 62, 1415 (1989). A. Gianmarchi and P. Le Doussal, Phys. Rev. Lett. 72, 1530 (1994). A. Gurevich and V.M. Vinokur, Phys. Rev. Lett. 83, 3037 (1999).
- [7] K.E. Bassler and M. Paczuski, Phys. Rev. Lett. 81, 3761 (1998). K.E. Bassler, M. Paczuski, and G. F. Reiter, Phys. Rev. Lett. 83, 3956 (1999).
- [8] A.K. Kienappel and M.A. Moore, Phys. Rev. B 60, 6795 (1999).
- [9] Asymptotically, vortex line segments interaction is exponential [2]. One can write: .
- [10] T. Nattermann, in Spin Glasses and Random Fields, ed. P. Young, (World Scientific, 1998).
- [11] K. Ghosh et al., Phys. Rev. Lett. 76, 4600 (1996); S.S. Banerjee et al., cond-mat/9911324.
- [12] D. Giller et al., Phys. Rev. Lett. 79, 2542 (1997).
- [13] We use as the energy unit and set .
- [14] Y. Paltiel et al., Nature 403, 398 (2000).
- [15] L.F. Cohen et al., Physica C 230, 1 (1994); G.K. Perkins et al., Phys. Rev. B 51, 8513 (1995). J. Totty, Ph.D. Thesis.
- [16] Time is measured in units of a MC full lattice sweep.
- [17] J.P. Bouchaud, L.F. Cugliandolo, J. Kurchan and M. Mezard, in [10].
- [18] A. Coniglio and M. Nicodemi, Phys. Rev. E 59, 2812 (1999).
- [19] C.A. Angell, Science, 267, 1924 (1995).
- [20] M. Nicodemi and A. Coniglio, Phys. Rev. Lett. 82, 961 (1999).