[
Charge Ordering and Spin Dynamics in NaV2O5
Abstract
We report high-resolution neutron inelastic scattering experiments on the spin excitations of NaV2O5. Below , two branches with distinct energy gaps are identified. From the dispersion and intensity of the spin excitation modes, we deduce the precise zig-zag charge distribution on the ladder rungs and the corresponding charge order: . We argue that the spin gaps observed in the low-T phase of this compound are primarily due to the charge transfer.
pacs:
PACS numbers: 71.45.Lr, 75.10.Jm, 75.40.Gb]
The low dimensional inorganic compound NaV2O5 undergoes a phase transition at K[1] associated with both a lattice distortion[2] and the opening of an energy gap to the lowest triplet spin excitations[3]. While the nature of the low- phase in NaV2O5 is not fully understood it is clear that, unlike CuGeO3, the spin-Peierls model does not apply simply to this compound [4]. The spin gap may result from charge-order (CO) rather than the lattice distortion[5]. Indeed, NMR measurements indicate two inequivalent vanadium sites below , while there exists only one site above[6]. There has been no direct evidence for the connection between CO and a spin gap, nor to distinguish various conjectured spatial distributions of charge [5, 7]. In this letter, we present new results of neutron inelastic scattering (NIS) on the spin excitations in the low- phase that can now resolve these issues.
In NaV2O5, the vanadium ions have a formal valence of 4.5+. Initially, this was proposed to correspond to an alternation of V4+ ions, with a spin value , and V5+ ions with [8]. At room temperature, NaV2O5 is well described by a quarter-filled two-leg ladder system, with only one type of vanadium site V4.5+. From calculations of electronic structure[9, 10], the strongest orbital overlaps are on the ladder rungs. One expects that the spins are carried by the V-O-V molecular bonding orbitals, with charge fully delocalized on two sites. As the energy of the anti-bonding orbital is much higher, it can be projected out, and above , these spins, as they interact in the leg direction ( axis), form an effective uniform quantum Heisenberg spin chain with interactions between chains that are both weaker and frustrated.
At low temperatures, NMR shows this can no longer be so. On each rung, a charge transfer may occur. Taking the average charge on vanadium sites to be 1/2, the charges on the two vanadium sites on a rung are defined through . Two forms of CO can be considered[5], the in-line, with the same charge transfer on each rung, and the zig-zag with alternation in the charge along the ladders as shown in fig. 1b. Recent X-ray diffraction measurements[11] established that the lattice structure below consists of a succession of distorted and non-distorted ladders of vanadium ions (see fig. 1a). Neglecting inter-ladder diagonal couplings , the ladders would behave magnetically as independent spin chains. For one ladder (chain 2 in fig. 1a) distortions in the exchange paths both within the ladder and via neighboring ladders result in an alternation of the effective exchange coupling in the b direction, and . The ladders in which the rungs are distorted (chains 1 and 3), however, remain magnetically uniform as a mirror plane passes through each rung. A minimum magnetic model without CO would be a succession of alternating and uniform chains. An energy gap (expected to be small as it results primarily from the alternation in ) would characterize the excitation branch of the alternating chains, and there would be no gap for the uniform chains. The initial NIS[3] found, however, two excitation branches, with the same gap at the antiferromagnetic point meV. To analyse these results, a recent spin model[12] used an explicit relation between the spin excitations and the CO. This model assumed a single gap and, as it implies zero intensity of one excitation branch, must be extended to explain the NIS data. A more precise determination of excitations in the low-T phase of NaV2O5 is therefore crucial. In the present work, using high-resolution, the dispersion of the excitations is re-explored in a wider part of the reciprocal space. Moreover, the evaluation of the structure factor, i.e., the (energy-integrated) intensity of each excitation mode, allows us to determine the charge transfer .
The single crystal (xx mm3) was grown by a flux method. The NIS measurements were performed at K, on two thermal neutron three-axes spectrometers - IN8 and CRG/CEA-IN22 - at the Institut Laue-Langevin (ILL). On IN8, vertically focusing monochromator PG() and Cu() were used in conjunction with a vertically focusing analyzer PG() and horizontal collimations --. The final wave vector was kept fixed at Å-1. IN22 was operated at Å-1, with a PG() monochromator and a PG() analyzer used in horizontal monochromatic focusing condition (resulting wave vector resolution: r.l.u.) with no collimation. The sample was installed in an “orange” ILL cryostat, with the scattering wave-vector lying in the reciprocal () ladder plane.

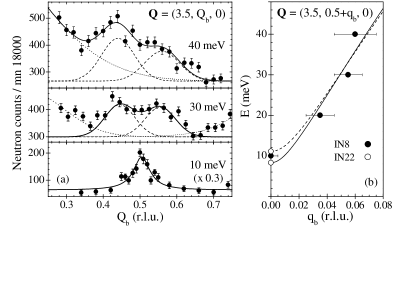
The two branches characterizing the low-energy excitations in NaV2O5 have distinct energy gaps: . This important result will be established when we consider the dispersions in the transverse a direction. First, however, we determine the dispersion in the leg direction (b axis). Examples of constant-energy scans obtained on IN8 as a function of are displayed in fig. 2a (wave-vector components are expressed in reciprocal lattice units, r.l.u.). Increasing the energy, one resolves the single peak seen at 10 meV into propagating modes (dashed lines), whose peak position is shown in fig. 2b. They describe the dispersion of the elementary excitations in the b direction, near the AF chain wave-vector component (). They are compared to a dispersion law characteristic of a gapped spin chain: where and are the gap and maximum energies of the dispersion, respectively. For both , (the solid and dashed lines, respectively), we evaluate meV. Compared to the prediction for a uniform Heisenberg chain, , where is the exchange in the chain, one obtains for the low- phase, meV.
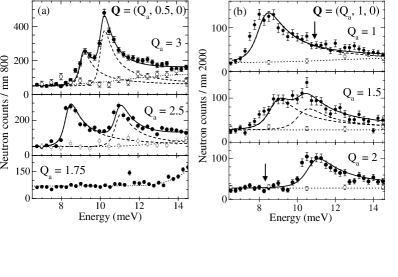
Second, we consider the dispersions in the a* direction (i.e., along the rungs). A few examples of energy scans performed on IN22 at constant are reported in fig. 3. In general, two peaks are observed. At a few values, however, an extinction occurs. This extinction may concern one of the two modes, or the two modes simultaneously. The left and right panels report data obtained for and (equivalent to the zone center of the AF chains ). As examples, we show for that the smallest energy difference between the two observed peaks is obtained for integer values (here, , the largest one for half-integer values ( and an extinction of the two modes occurs at (identical results have been obtained for ). Surprisingly, at the chain zone-center we found a small but non-zero intensity for the two excitation branches. The smallest energy difference between the two peaks is now obtained for half-integer values (here, ). Extinctions of one of the two modes is observed at (on the high-energy mode) and at (on the low-energy mode). For all the spectra recorded on IN22, the background (the dotted lines in fig. 3) was carefully determined. Several procedures have been used involving data recorded at low and high temperature (i.e., above ). In fig. 3a, for instance, the open dots used to define the background are obtained from measurements performed at 40 K[13] while in fig. 1b, it is determined from scans performed at low temperature for different energies.
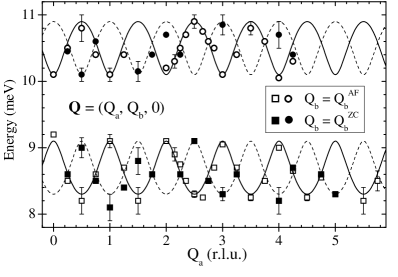
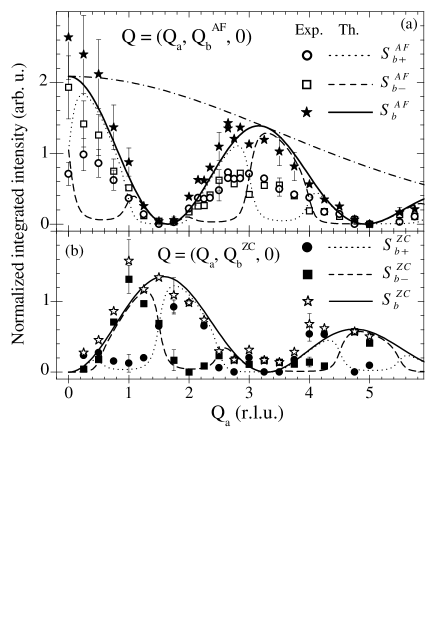
For the analysis, we assume the two observed peaks to belong to two distinct contributions. Their unsymmetrical lineshape is characteristic of gapped excitations undergoing a rapid energy dispersion (as established in fig. 2b). In such a case, a dynamical response function (shown by the dashed lines in fig. 3) is well-suited to fitting, conveniently defined with only 3 parameters: the peak energy (), an intensity factor () and an energy damping [14]. As is mainly fixed by the resolution conditions, it is assumed to be the same for the two contributions ( meV). Together with the background, the agreement with the experiments, shown by the solid lines, is good. The values obtained for as a function of are shown in fig. 4. We establish several new features. At both (solid symbols) and (open symbols), the transverse dispersion consists of two distinct excitation branches which never cross. This justifies our previous statement, namely that there are two distinct energy gaps, and . In each branch, the periodicity is : this is twice that previously determined. The two dispersions have the same amplitude, meV but, remarkably, the upper and lower branches are out of phase, and there is phase inversion between branches at and . For each excitation branch, the corresponding structure factors, and are evaluated by integrating the fitted dynamical response functions over a wide energy range (from up to . We estimate systematic error for varying the upper cut off alters the results by at most 5%. The resulting values (dots and squares) are reported in figs. 5a and b. The sums and are shown as the stars.
The interpretation of these results is developed in three steps. First, the charge order: each spin is associated with an electronic wave function on the two sites of a rung that depends on . The structure factors for the in-line and zig-zag models are and + (, ), respectively, with and where (, rung length and , lattice parameter) and is the structure factor for spins localized on the center of each rung[15]. From the ratios of intensities for different values of momentum, one can extract the charge transfer independent of the form of . In particular, we verify that the order cannot be in-line but predictions agree with a zig-zag order with , i.e., . The agreement is particularly good for the sums and . For the absolute intensities, we need an explicit form for which we take from the strongly dimerized limit (SDL), in which the wave function is simply a product of singlets on the stronger bonds. For the in-line model, for example, the SDL would give zero intensity at in contradiction with the observation (the data in fig. 5b). The in-line model can be ruled out. In figs. 5a and b, the predictions provided by the zig-zag model (solid lines) are compared with the experimental total structure factors and (solid and open stars). In fig. 5a, the agreement is obtained with no adjustable parameter except for an overall amplitude factor. Once this factor is determined, the results in fig. 5b depends only on . As can be seen, a good agreement is obtained for . The low-T phase of NaV2O5 is very well described by the zig-zag model, with a rather large charge transfer.
Second, we consider the transverse dispersions. Later, we explain that the gap is induced by the CO. In fact, there are two distinct gaps because of the structural distortions (implying distinct couplings and as shown in fig. 1b). Due to the CO, 4 different interchain exchange integrals must be considered, , , and . The two branches (associated with the gaps and ) acquire a transverse dispersion, described at and by and , respectively, with [15]. In fig. 4, these predictions (solid and dashed lines) are compared to the data. Again, a very good agreement is obtained yielding the following evaluation , and meV. The dispersion gives directly the alternation in the inter-ladder diagonal bonds . If we assume it is dominated by the CO, we can also estimate the average from [12] giving meV.
The structure factors can be calculated for each branch. Within the SDL approach, one obtains the contributions and [16] shown by the dotted and dashed lines in fig. 5. In fig. 5b, the agreement with the data is rather good. In particular, the extinction phenomenon observed for each branch is well reproduced. In fig. 5a, while the sum is well described, we note a discrepancy between the SDL predictions and the individual structure factors and . This difficulty could be explained as follows. As shown in fig. 1b, two successive chains are not identical. A charge transfer giving different average valence on the chains will mix intensities at without affecting the fluctuations at in qualitative agreement with the observation[17]. Experimental supports for such a charge transfer would be useful. Our proposition for the charge ordering, i.e., the zig-zag model sketched in fig. 1a, and our estimate are based on the total intensities.
Finally, we consider the origin of the gap. As discussed in the introduction, the lattice distortion alone, in isolated ladders, cannot explain the presence of two energy gaps and their size. To analyze the effects of the diagonal couplings , we refer to fig. 1b. Each ladder is seen to be a succession of two distinct clusters (shown by ovals in the figure). By exact diagonalization of each cluster, using the effective parameters of a t-J model [10] and adding a potential imposing a charge transfer, we evaluated and as a function of and the bond alternation . For , the couplings underestimate the experimental value by a factor of about 2, but as the parameters calculated on the high temperature structure [10] and as such cluster calculations are rather crude, the agreement is satisfactory. The value obtained for the bond alternation can be considered as reasonable: . Then, using the experimental value meV, one finds an energy gap meV. This is in a fairly good agreement with the experimental value meV. This simple analysis supports the view that, in NaV2O5, the gaps are primarily due to the CO[18]. The lattice distortion plays a secondary role, explaining why two distinct branches are observed experimentally, and their separation. In our picture, the magnetic anisotropies are unnecessary[7].
In conclusion, the CO in NaV2O5 is quantitatively determined by the present NIS measurements [19]. It explains also the energy gaps observed in the low-T phase of this compound.
REFERENCES
- [1] M. Isobe and Y. Ueda, J. Phys. Soc. Jpn 65, 1178 (1996).
- [2] T. Chatterji et al., Solid State Com. 108, 23 (1998).
- [3] T. Yosihama et al., J. Phys. Soc. Jpn 67, 744 (1998).
- [4] S.G. Bompadre et al., cond-mat/9911298.
- [5] Mostovoy and Khomski, cond-mat/9806215; Damascelli et al. Phys. Rev. Lett. 81, 918 (1998). P. Thalmeier and P. Fulde, Europhys. Lett., 44, 142 (1998); H. Seo and K. Fukuyama, J. Phys. Soc. Jpn 67, 2602 (1998); J. Riera et al., Phys. Rev. B 59, 2667 (1999); A.I. Smirnov et al., ibid 59, 14546 (1999); Schwenk et al., ibid 60, 9194 (1999); M. Lhomann et al., Phys. Rev. Lett. 85, 1742 (2000).
- [6] T. Ohama et al., Phys. Rev. B 59, 3299 (1999).
- [7] P. Thalmeier and A.N. Yaresko, Eur. J. Phys. B 14, 495 (2000).
- [8] P.A. Carpy and J. Galy, Acta Crystallogr B 31, 1481 (1975).
- [9] H. Smolinski et al., Phys. Rev. Lett. 80, 5164 (1998).
- [10] N. Suaud and M.B. Lepetit, Phys. Rev. B 62, 402 (2000).
- [11] J. Lüdecke et al., Phys. Rev. Lett. 82, 3633 (1999).
- [12] C. Gros and R. Valenti, Phys. Rev. Lett. 82, 976 (1999).
- [13] Taking into account an estimated magnetic contribution for this temperature.
- [14] T.E. Mason et al., Phys. Rev. Lett. 69, 490 (1992).
- [15] O. Cepas, PhD. Thesis, Grenoble, France,2000.
- [16] The corresponding expressions agrees with the sum rules and established above.
- [17] In contrast, if we assume different values of on two successive chains, the individual modes will mix at rather than at unlike what is observed.
- [18] In T. Ohama et al., cond-mat/0003141, the CO proposed in model Z2 (fig. 3) does not give rise to energy gaps, model Z3 provides a gap for only one out of two chains, model Z1 is magnetically equivalent to ours (fig. 1b).
- [19] Other models assuming three different valence states (V4+, V4.5+ and V5+) have been shown to be incompatible with our results: S. Trebst et al, Phys. Rev. B 62, R14613 (2000); C. Gros et al., ibid 62, R14617 (2000); and references therein.