Stripes in Doped Antiferromagnets: Single-Particle Spectral Weight
Abstract
Recent photoemission (ARPES) experiments on cuprate superconductors provide important guidelines for a theory of electronic excitations in the stripe phase. Using a cluster perturbation theory, where short-distance effects are accounted for by exact cluster diagonalization and long-distance effects by perturbation (in the hopping), we calculate the single-particle Green’s function for a striped - model. The data obtained quantitatively reproduce salient (ARPES-) features and may serve to rule out ”bond-centered” in favor of ”site-centered” stripes.
pacs:
PACS numbers: 74.72.-h, 79.60.-i, 71.27.+aThere is by now substantial experimental evidence [1, 2, 3] for a tendency of doped holes in high-temperature superconductors (HTSC) to form stripes, leaving behind locally antiferromagnetic (AF) domains. The stripes can be static like in La1.48Nd0.4Sr0.12CuO4 (Nd-LSCO) [1] or dynamic like in YBa2Cu3O7-x [4]. At present, there is an intensive discussion and controversy, whether stripes are directly connected with and beneficial for the microscopic mechanism in HTSC [5, 6, 7, 8, 9, 10, 11]. What is clear, however, is that the apparent presence of static or dynamic stripes crucially influences low-energy excitations and thus the foundations for such a microscopic theory. Evidence for this has recently been accumulated by angle-resolved photoemission spectroscopy (ARPES) both on the static stripes in the Nd-LSCO system [3] and on dynamic domain walls in the LSCO compound [12, 13]. The electronic structure revealed by ARPES contains characteristic features consistent with other cuprates, such as the flat band at low energy near the Brillouin zone face (). In Nd-LSCO, the frequency-integrated spectral weight is confined inside 1D-segments in -space, deviating strongly from the more rounded Fermi surface expected from band calculations.
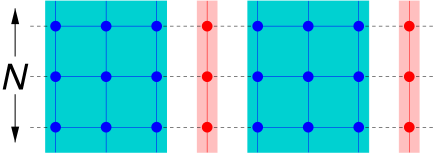
In this Letter, we present a numerical study of the single-electron excitations in a striped phase via cluster perturbation theory (CPT) [14] and a detailed comparison with recent ARPES results. The basic idea of our application of the CPT is indicated in Fig.(1): it is based on dividing the 2D plane into alternating clusters of metallic stripes and AF domains. The individial clusters are modeled by the microscopic - hamiltonian and solved exactly via exact diagonalization (ED). Then the inter-cluster hopping linking the alternating metallic and AF domains is incorporated perturbatively via CPT on the basis of the exact cluster Green’s functions thus yielding the spectral function of the infinite 2D plane in a striped phase. Using this CPT approach, the important short-distance interaction effects within the stripes are taken into account exactly while longer-ranged hopping effects are treated perturbatively. A study of the properties of experimentally observed stripe phases solely by ED[15] is precluded by the prohibitively large unit cells. The manageable clusters for ED are simply too small to accommodate even a single such unit cell.
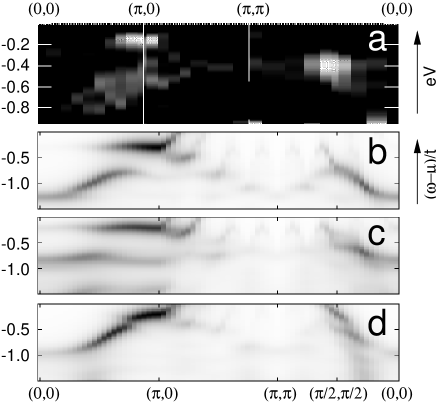
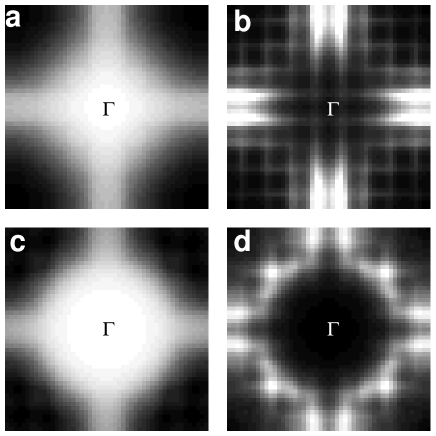
Our main results are: (i) close to we see, like in experiments, a two-component electronic feature (see Fig.(2)): a sharp low-energy feature close to and a more broad feature at higher binding energies. Both features can be explained by the mixing of metallic and antiferromagnetic bands at this -point. (ii) the excitation near is at higher binding energies than the low-energy excitation at and of reduced weight. (iii) the integrated spectral weight of the cluster-stripe calculation resembles the quasi-one-dimensional segments in momentum space (see Fig.(3a)) as seen in the Nd-LSCO experiment. Also in agreement with the Nd-LSCO experiment our calculation finds the low-energy excitations near and (Fig.(3b)). Interestingly, this agreement with experiment occurs only for so called ”site-centered” metallic stripes (as shown in Fig.(1)) and not for ”bond-centered” metallic stripes. This seems important since it has been argued [16], that, for bond-centered stripes, superconductivity is expected to survive stripe ordering. In the DMRG calculations by White and Scalapino [17] as well as in dynamical mean-field (DMFT) studies by Fleck et al. [18], bond-centered and site-centered domains are very close in energy (ground-state). However, our technique allows to distinguish them dynamically.
The computational technique for our calculation of the single-particle spectral weight and the Green’s function is illustrated in Fig.(1). We solve the AF cluster (here, ) and the metallic cluster (here with a hole filling by ED and combine the individual clusters to an infinite lattice via CPT as in the homogeneous case. Where it was technically feasible, we extended the unit cell by a factor of two and diagonalized two AF 3-leg clusters with a staggered magnetic field pointing in opposite directions, resulting in a -phase shifted Néel order in the final configuration. This site-centered ”” configuration with -phase shifted Néel order of stripes was first suggested by Tranquada et al. [1]. Bond-centered stripes, on the other hand, are modeled by 2-leg ladders with alternating filling (half-filled, and doped, ). In the following we will refer to this bond-centered configuration as ””.
Holes can propagate out of the metallic stripes into the AF insulating domains via the inter-cluster hoppings. In the Hubbard model, these hoppings correspond to one-body operators and can be treated within a systematic strong-coupling perturbation expansion. For homogeneous systems such an expansion was constructed in ref.[14]. We take the lowest order contribution:
| (1) |
which is of RPA form. Here, is a superlattice wave vector and is the Green’s function of the ”-size” 2D system, however, still in a hybrid representation: real space within a cluster and Fourier-space between the clusters. This is related to the fact that is now an matrix in the space of site indices (in the inhomogeneous stripe configuration of Fig.(1) ). Likewise, and are matrices in real space with standing for the perturbation, which includes hoppings out of the clusters. A true Fourier representation of in terms of the original reciprocal lattice then yields the lowest order CPT approximation. As discussed in ref.[14] for the homogeneous case, the approximation in eq.(1) is exact for vanishing interaction. When the interactions are turned on, eq.(1) is no longer exact (apart from the local limit, i.e. ), but strong interactions are known to be important mainly for short-range correlations. These correlations are incorporated with good accuracy in modest-size clusters and are treated here by ED within the cluster. It has been shown by Sénéchal et al. [14] that the CPT reproduces the spectral weight of the 1D and 2D Hubbard models in quantitative agreement with exact results.
To allow for larger cluster sizes , we diagonalize the - model and take its spectral (Green’s) function as our local in eq.(1) as an approximation to the Hubbard model’s (cluster-) Green’s function. A comparison of the Hubbard and - model’s spectral function on small clusters [19] shows that the strong low energy peaks have similar dispersion and weight in both models, the main difference being a transfer of incoherent high energy spectral weight from momenta near to . The - hamiltonian is defined as
| (2) |
The hopping matrix element is nonzero only for nearest () and next-nearest neighbors (). The second sum counting the Heisenberg interaction runs over all nearest neighbor pairs. No double occupancy is allowed. We have chosen commonly accepted values for the ratio , , where . In this Letter we present calculations for systems with based on diagonalizations of a -site half-filled 3-leg ladder and a quarter-filled -site chain. Results for smaller do not differ much from results. , however, is somewhat pathological, since it has an odd number of electrons in the quarter-filled chain.
We proceed to the discussion of the spectra: Fig.(2a) shows the experimental ARPES results for LSCO at the superconductor-insulator transition (doping ) [12]. To enhance the structure in the obtained spectra, the authors of ref.[12] plotted the second derivative of the ARPES spectrum, so areas with high second derivative are marked white and areas with low curvature (i.e. flat intensity) are black. This result is compared with the theoretical CPT calculation for different stripe configurations with overall doping of . Figs.(2b,c) are for the ”” site-centered configuration. Fig.(2b) shows the result for a ”” configuration with alternating (i.e. -phase shifted) Néel order between the 3-leg ladders (induced by a staggered magnetic field ) without next-nearest neighbor hopping, Fig.(2c) shows the result for the ”” stripe configuration with next nearest-neighbor hopping , however without Néel order (due to the reduced symmetry, a diagonalization with staggered field is not technically feasible). Fig.(2d) shows the result for a bond-centered ”” stripe configuration. We observe that the spectra for the site-centered ”” configuration (Fig.(2b,c)) are in surprisingly good agreement with experiment, and, that the calculation (Fig.(2b)) results in much more coherent bands due to the enforced Néel order in the 3-leg ladders. Similar to recent DMFT calculations [18], the sharp excitation near the Fermi surface around , that has been interpreted by Ino et al. as the quasiparticle peak in the SC state, is visible as well as a dispersive band at higher binding energies which (at least away from ; see discussion below) can be interpreted as remnants of the insulating valence band resulting from the AF domains. Especially in the Néel ordered configuration, we observe a very coherent and pronounced band. This clear dispersion is also visible in the direction near . We note that, in agreement with the experimental result (Fig.(2a)), the excitation at is at significantly lower binding energy than the excitation at . Neither the 2D - model nor a 2D --- model, with its parameters fitted to the insulating state, can reproduce this result [20]. This is a crucial effect of the stripe assumption: With the stripes oriented along the -direction, the metallic band is dispersionless in -direction. Therefore, at , the minimum of the metallic spinon band (located at for any ) hybridizes with the top of the insulating valence band resulting in a two-peak structure with one peak pushed to higher and the other pushed to lower binding energies (see below). At , on the other hand, the metallic band has crossed the Fermi surface (its being ) and no mixing takes place. Finally, the ”” bond-centered stripe configuration (Fig.(2d)) does not show much resemblance to the experimental result. Its main band is much more two-dimensional, normal metal-like, comparable to the dispersion of a 2D tight-binding band.
Fig.(3a) plots the integrated spectral weight for the ”” site-centered stripe configuration with . Although not as clear as in the Nd-LSCO ARPES experiment (from ref.[3]), the ”Fermi surface” is rather one-dimensional in structure. Like in Nd-LSCO the low energy excitations (shown in Fig.(3b), calculated by integrating over a window below the Fermi-energy for each -point in the Brillouin zone) are located near the , points in momentum space. In Fig.(3b) we notice the square lattice of bright points. This is the repeated Brillouin zone of the supercell consisting of lattice sites (due to the Néel order in -direction). Clearly, the low energy excitations in the momentum space of the supercell are near the and points as well. Fig.(3c) shows the integrated spectral weight of the ”” - stripe calculation. Here, the CPT ”Fermi surface” is much more rounded, similar to the quasi-2D Fermi surface known from band calculations. The low energy excitations are located isotropically around the ”Fermi surface” as well (Fig.(3d)). The loss of one-dimensionality observed for this bond-centered ”” stripe configuration is accompanied by a substantial enhancement of spectral weight near . From these results we conclude that, at least in the Nd-LSCO system, the stripes are site-centered and of ”” type.
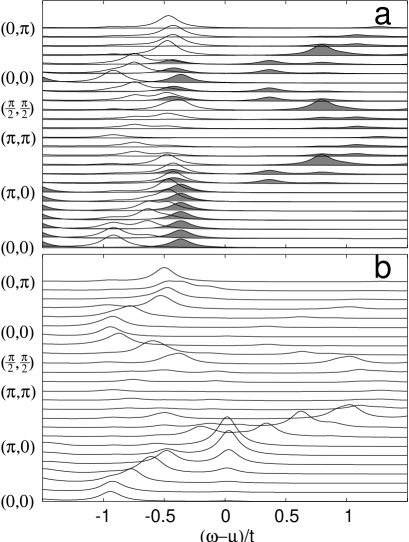
With our technique we are able to resolve for each excitation, whether its main origin is from the insulating or the metallic part of the stripe configuration: In Fig.(4) we compare the spectra for the unperturbed stripe configuration with inter-cluster hopping set equal to zero (in Fig.(4a): solid curve for the AF domains, shaded curve for the 1D metal) with the result of our CPT calculation (solid line in Fig.(4b)) with inter-cluster hopping (for the Néel ordered ”” configuration). All of the spectral weight in inverse photoemission () naturally stems from the chain since the half-filled 3-leg - ladder does not have target states for an inverse photoemission process. The stripes are oriented along the -direction. Therefore, we can conclude that peaks (in the calculation with ), that show a dispersion along to direction stem from the AF domains (solid line in (4a)) whereas the metallic excitations prior to the mixing (shaded curve in (4a)) are dispersionless. By comparing the three curves, we therefore conclude that the sharp quasiparticle peak near results from the mixing of the (dispersionless) minimum of the metallic spinon band and the top of the insulating valence band situated at . Going from to , the metallic band becomes dispersive and crosses, in agreement with experiment [3, 12] the Fermi surface at (since it is quarter-filled). The dispersion of the insulating band, however, is in the opposite direction. For this reason, in the final spectrum, we observe that the sharp quasiparticle peak at becomes dispersive going into direction and eventually crosses the Fermi surface, however, with diminishing weight due to the absence of mixing with the insulating band. This effect is best visible in the grayscale plot of Fig.(2b). This finding may serve to clarify questions raised in the experimental ref.[3] concerning the origin of the quasiparticle peak at .
To summarize, the single-particle spectral weight was calculated for different stripe configurations employing an application of the cluster perturbation technique for inhomogeneous systems. This technique allows to obtain all -points and, therefore, allows for a detailed comparison with ARPES data. The results for the ”” site-centered configuration display salient features observed in experiments such as a two-peak structure around with a sharp excitation close to the Fermi-energy and a broader feature at higher binding energies, a quasi-1D distribution of spectral weight, and low energy excitations located around the -points in the Brillouin zone. The theoretical results suggest to rule out the alternative bond-centered ”” configuration.
The authors acknowledge financial support from BMBF (05SB8WWA1) and DFG (HA1537/17-1). The calculations were carried out at the high-performance computing centers HLRS (Stuttgart) and LRZ (München).
REFERENCES
- [1] J.M. Tranquada et al., Nature 375, 561 (1995).
- [2] H.A. Mook et al., Nature 404, 729 (2000); Nature 395, 580 (1998).
- [3] X.J. Zhou et al., Science 286, 268 (1999).
- [4] R.P. Sharma et al., Nature 404, 736 (2000).
- [5] N. Ichikawa et al., cond-mat/9910037 (1999).
- [6] V.J. Emery, S.A. Kivelson, O. Zachar, Phys. Rev. B 56, 6120 (1997); S.A. Kivelson, E. Fradkin, V.J. Emery, Nature 393, 550 (1998), and ref. therein.
- [7] J. Zaanen, J. Phys. Chem. Sol. 59, 1769 (1995).
- [8] C. Castellani, C. Di Castro, M. Grilli, Z. Phys. B 103, 137 (1997).
- [9] M. Vojta, S. Sachdev, Phys. Rev. Lett. 83, 3916 (1999).
- [10] S.R. White, D.J. Scalapino, Phys. Rev. B 60, R753 (1999).
- [11] P. Wróbel and R. Eder, Phys. Rev. B 62, 4048 (2000).
- [12] A. Ino et al., Phys. Rev. B 62, 4137 (2000).
- [13] A. Bianconi et al., Phys. Rev. Lett. 76, 3412 (1996).
- [14] D. Sénéchal et al., Phys. Rev. Lett. 84, 522 (2000).
- [15] T. Tohyama et al., Phys. Rev. Lett. 82, 4910 (1999).
- [16] Y.A. Krotov, D.-H. Lee, A.V. Balatsky, Phys. Rev. B 56, 8367 (1997).
- [17] S.R. White, D.J. Scalapino, Phys. Rev. Lett. 80, 1272 (1998); Phys. Rev. Lett. 81, 3227 (1998); Phys. Rev. B 55, 6504 (1997).
- [18] M. Fleck et al., Phys. Rev. Lett. 84, 4962 (2000).
- [19] H. Eskes, R. Eder, Phys. Rev. B 54, R14226 (1996).
- [20] A. Nazarenko et al., Phys. Rev. B 51, 8676 (1995); V.I. Belinicher et al., Phys. Rev. B 54, 14914 (1996); R. Eder et al., Phys. Rev. B 55, R3414 (1997); F. Lema and A. Aligia, Phys. Rev. B 55, 14092 (1997).