[
Vortex melting and decoupling transitions in YBa2Cu4O8 single crystals
Abstract
The vortex correlation along the c-axis in high quality single crystals of YBa2Cu4O8 has been investigated as a function of temperature T in different magnetic fields, using the quasi-flux transformer configuration. A simultaneous sharp drop associated with the vortex lattice melting is observed in both the primary and secondary voltages(Vtop and Vbot). Just above the melting temperature, the vortices form three-dimensional line liquid with the correlation length along the c direction t, the sample thickness. The temperature where a resistive peak in Rbot develops corresponds to the decoupling temperature Td at which the vortices loose their correlation along the c-direction and they dissolve into the two dimensional pancake vortices. The H-T phase diagram for the YBa2Cu4O8 single crystal is obtained.
]
I Introduction
The vortex dynamics in the mixed state of high Tc superconductors (HTSCs) remains a topic subject to intense investigation because of its importance for both the fundamental research and future applications. It is now well established that the thermal fluctuation induces a second order transition from a high temperature vortex liquid phase to a low temperature vortex glass phase for the vortex matter in a superconductor with a strong disorder. In a clean superconductor the second order transition is replaced by a first order transition from a vortex liquid to an Abrikosov vortex lattice.[1]
Flux melting in various high quality high Tc superconducting single crystals has been observed by different experimental techniques.[2, 3, 4, 5, 6, 7, 8] It demonstrates itself as a sharp resistive drop or a jump in the magnetization. An important issue concerning the melting transition is that if the vortices lose their coherence in the c direction during the melting transition or they will keep the c-axis correlations intact and then lose them at a still higher temperature.[9] This issue has been widely pursued by doing transport measurements with the dc flux transformer configuration. So far the results remain controversial. Doyle et al.[10] and Fuchs et al.[11] found a coincidence of the melting transition and a decoupling one on Bi2Sr2CaCu2O8 (Bi2212) single crystals. However, Wan et al.[12] and Keener et al. [13] did similar measurements on Bi2212 single crystals. They concluded that the melting transition took place in a two-stage fashion, i.e., the rigid lattice at low temperature first melts into a three dimensional (3D) liquid followed by a decoupling transition upon an increase in the temperature. Recently Blasius et al.[14] performed -spin rotation measurements on Bi2212 single crystals with different oxygen contents and they obtained evidence for a two stage transition of the vortex matter as a function of temperature under equilibrium conditions. On the other hand, in the YBa2Cu3O7-δ (Y123) system a coincidence of vortex melting and loss of vortex correlation along the c-axis was observed by López et al.[15] A decoupling transition was not observed in the optimally doped Y123 system since the vortex in this system is always in the 3D region.
Underdoped YBa2Cu4O8 (Y124) is naturally stoichiometric and untwinned, it has a moderate anisotropy parameter as compared to those of Y123 and Bi2212. The weakness of the pinning strength in this material reduces the contribution from spurious effects in the melting transition in the vortex system. Thus it is a good prototype material for the investigation of the interplay between the vortex interaction and dimensionality on the vortex dynamics. Recently, we observed a first order melting transition in the Y124 single crystals. [16] It is of great interest to extend our previous work to examine the vortex dynamics along the c-axis. Here we report the transport data obtained in simultaneous measurements for both the primary (Vtop) and secondary (Vbot) voltages using the dc transformer configuration, in order to investigate the vortex correlation along the c-axis in the Y124 system. It is demonstrated that in Y124 single crystals, vortex lattice (VL) melts into a 3D vortex liquid via a first order transitionand and that the decoupling transition is seperated from the melting one. Our results support the two stage transition scenario that the vortices first undergo a melting transition, followed by a disappearance of correlation in the transverse direction at a higher temperature.
II Experimental and Results
YBa2Cu4O8 single crystals were grown by the high-pressure flux method as described previously.[17] These single crystals were needle-like with typical dimensions of 1.20.40.01 mm3. The zero field critical transition temperature Tc(0) of the single crystals was about 78 K. Two single crystals were used for these measurements. Each crystal was carefully cleaved to obtain optically flat surfaces with the c-axis normal to the sample surface. Gold wires were attached to the top and bottom surfaces of crystal by using Platinum epoxy. Then the crystal was heated in air at 100 ∘C for 1 hour, the resultant contact resistance was typically below 0.5 . The electrical contact geometry for the measurement is shown in the inset of Fig. 1. The secondary voltage contact pair (5 and 6) on the bottom ab face was placed directly beneath the top face primary voltage pair (2 and 3). The distance between each voltage pair was about 0.5 mm. The resistance were measured using a low frequency (17 Hz) ac lock-in technique with an excitation current of 0.1 mA injected from contact 1 to 4 while measuring simultaneously the voltage drops V23 and V56 with the help of a Keithley 228 scanner. The magnetic field was generated by a 15 Tesla Oxford superconducting magnet and was applied parallel to the c-axis of the crystal throughout the measurements.

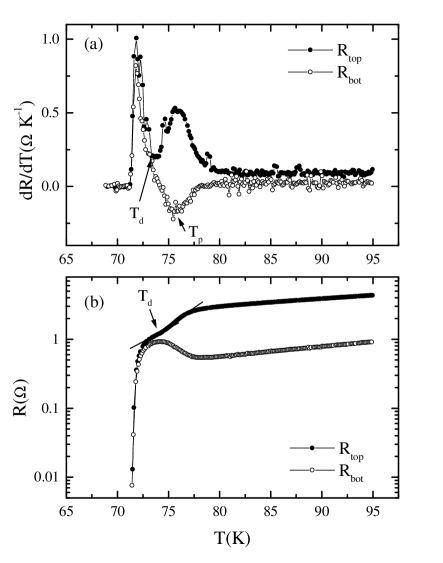
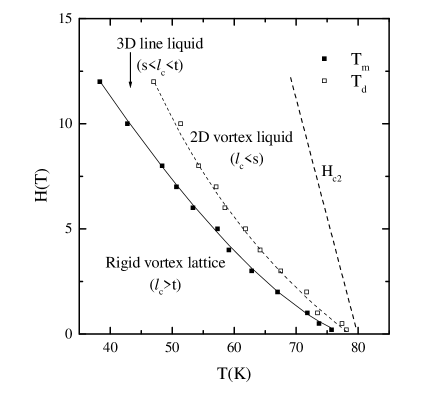
Shown in Fig. 1 are the representative Rtop(T) and Rbot(T) (defined as V23/I14 and V56/I14, respectively) curves taken at different applied magnetic fields up to 12 Telsa for one of the Y124 single crystals. Similar results were obtained for the other crystal. The resistivity was measured by first cooling down the sample below Tc and then collecting the data while warming up the sample. While the applied magnetic fields induce a negligible depression in the superconducting onset temperature for the in plane superconductivity, they appear to considerably suppress the temperature where Rbot deviates from its normal state value. A sharp jump in Rtop with a magnitude of R/Rn 10% (Rn being the normal state resistance) is clearly observed at each magnetic field. We attribute it to the occurrence of the vortex melting transition. We define the melting transition temperature Tm as the one where a sharp peak in dR/dT exists. The temperature Tm defined by Rtop(T) and Rbot(T) are equal, i.e., T=T. This is demonstrated more clearly by plotting the derivatives of Rtop and Rbot with respect to T together, as shown in Fig. 2a. Below the melting temperature, Rtop=Rbot. Immediately above the melting temperature Tm, Rtop becomes larger than Rbot. As the temperature increases, both Rtop and Rbot increase and the difference between Rtop and Rbot becomes larger and larger. Finally near a characteristic temperature Td, Rbot reaches its maximum and at the same temperature, a small kink develops in Rtop, as can be seen in a separated plot in Fig. 2b. It is interesting to notice that above Tm, dRtop/dT decreases with the increasing temperature, reaches a minimum at Td before a second local maximum appears at Tp. At exactly the same temperature Tp, dRbot/dT shows a local minimal. This behavior persists for the dR/dT curves at all applied magnetic fields. By plotting Tm and Td as a function of the magnetic field, we obtain a phase diagram for this Y124 single crystal as shown in Fig. 3. Previously we have found that Tm(B) could be well described by the anisotropic Ginzburg-Landau theory and the melting line could be fitted by an empirical formula Bm(T)=31.4(1-T/Tc)1.44 with Tc=78.6 K.[16] The fitting result is shown as the solid line in Fig.3. In the mean time, angular dependence of the melting transition gives for Lindermann criterium cL=0.14 and the anisotropy parameter =12.4.[16]
III Discussions
The dc flux transformer configuration is useful means for probing the dimensionality and longitudinal correlation of vortices in the mixed state. It measures the velocity correlation for vortices running along the CuO planes of Y124 since the voltage drops V23 and V56 (and thus Rtop and Rbot) in the mixed state is induced by the motion of vortices whose velocity is determined by the integrated Lorentz force on the vortex segments of length lc piercing the top and bottom surfaces, respectively. The relation between Rtop and Rbot is determined by the velocity of the vortices in the top and bottom surfaces. When the vortex correlation length along the c-axis is longer than the sample thickness, the voltage drops at the top and bottom surfaces would be of the same magnitude. The fact that immediately above the melting temperature Rtop is larger than Rbot suggests that the lc is smaller than the sample thickness t above the melting transition.
Above Tc in the normal state, Rtop is larger than Rbot because the sample geometrical aspect, electrode arrangement and anisotropy result in a nonuniform current distribution, i.e., more current will pass through the top surface than on the bottom surface. The fact that in the normal state the ratio Rtop/Rbot is nearly constant suggests that the anisotropy of Y124 is nearly temperature independent in this temperature region. Upon entering the superconducting state, the superconductivity will make an easy path for electrons to run across the CuO planes and therefore reduces the anisotropy. As we will discuss below, the vortices at this temperature region is the 2D pancakes, the voltage drop will be mainly determined by the anisotropy. Since we are measuring the resistance by passing a constant current, the decrease in anisotropy means that more current will pass through the CuO layers and that the current flowing in the bottom layers will increase. The decreasing anisotropy with decreasing temperature is reflecting in the reduction of dRbot/dT as shown in Fig.2a.
In the present measurement configuration, Rtop is equivalent to the in-plane resistance Rab commonly measured in a four terminal measurement. Our previous work on the in-plane resistivity demonstrated that for Rtop(T), above the melting temperature in the liquid state, there are two distinct parts where lnRtop shows linear dependence upon 1/T with different slopes, which is a typical characteristic for thermally activated flux flow (TAFF) behavior. [16] We have identified the temperature Td where the crossover between the two TAFF regions occurs as the decoupling transition through an activation energy analysis. The decoupling temperature is described by[9]
| (1) |
where s is the interlayer spacing between the neighboring CuO planes. With a value of 12.4 a satisfied fit is obtained by Eq. (1) for the decoupling line shown as the dashed line in Fig. 3.
We notice that the temperature where Rbot shows a maximum corresponds to exactly the same temperature where a crossover between two different TAFF regions occurs as we have identified before. Such a peak resembles that of the out-of-plane resistance Rc often appears in single crystals with large anisotropy such as Bi2212.[18, 19] However it can be seldom seen in single crystal with moderate anisotropy such as fully oxidized Y123. Although there is no consensus on the occurrence of the peak in Rbot and Rc yet, one possible reason for it could be the tunneling of vortices over the c-axis barrier in the liquid state following by the complete coupling of CuO planes. Recently, there have been considerable efforts devoted to the study of interlayer charge dynamics by far infrared reflectivity.[20, 21] Studies on the interlayer charge dynamics with the electric field component E polarized along the c-axis reveals that above a characteristic temperature Tpl, the superconductor behaves like a poor metal or an ionic insulator. The carriers are confined inside the CuO planes and the c-axis resistivity is controlled by the interlayer tunneling. The c-axis coherence is signaled by the appearance of a reflectivity edge associated with the Josephson plasma from the intrinsic Josephson junctions.[22, 23] Above Tpl, the electron transport along the c-axis is incoherent. Below Tpl, coherence is built up for the interlayer carrier transport. Therefore, given the high transition temperature and weak interlayer magnetic coupling between the pancake vortices in the neighboring CuO planes, Td would quite possibly correspond to Tpl (the Josephson plasma frequency) at which the phase coherence and thus the superconductivity is built up for the entire system along the c-axis. The suppression of the onset temperature for c-axis superconductivity by an applied magnetic field is due to the breakdown of the phase coherence along the c-axis by a magnetic field. This is consistent with the model proposed by Briceño et al.[19] and later developed by Suzuki et al.[24] who suggested that phase fluctuation induced dissipation controlled the dissipation and could be well described by the Ambegaokar-Baratoff theory.
Although the picture of vortex melting has been widely accepted, the mechanism of the vortex melting has yet not well understood. Recently, Nonomura et al.[25] carried out Monte Carlo simulations of the three dimensional frustrated XY model, in which the melting temperature was determined by the helicity modulus along the c-axis. They found that the melting transition is propagated through vortex entanglement. At the melting temperature, the percentage of entangled vortices abruptly changes. Upon increasing the temperature, the entanglement length becomes smaller than the sample thickness and decreases rapidly. The dissipation is governed by the cutting of vortices above the melting temperature. As a consequence of the entanglement mechanism of the FLL melting, Tm is scaled by the inverse of the system size along the c axis. Our results can be explained by their simulation results very well since we indeed observed a melting transition into 3D line liquid with its correlation length lc smaller than the sample thickness t.
The vortex melting scenario has been questioned by Moore[26] who argued that the melting transition could just be a second order crossover of the vortex matter from a three dimensional behavior to a two dimensional one when the lc in the vortex liquid becomes compatible to the sample thickness t. Because lc grows very rapidly as the temperature is lowered, the crossover region appears narrow enough to be misinterpreted as a first order melting transition. For a cutting length of the sample thickness t, the cutting temperature can be calculated according to [27]
| (2) |
by substituting L with t0.01 mm. Here =2.0710-7 Gauss cm-2 is the flux quantum, , being the Ginzburg-Landau parameter and Å, the penetration depth in the ab plane. The obtained vortex cutting line lies slightly below the melting line Bm(T). Although our result can also be qualitatively explained with this argument, it is not clear why such a sharp crossover is not observed in thin films (strong pinning disorder) since in any sample with a finite thickness larger than the distance between neighboring CuO planes, a crossover temperature is expected. One reason could be that the relatively smaller numbers of pinning centers in the single crystals (weak pinning) than in the thin films result in a larger Larkin correlation length Lp inside which an ordered VL can persist.[28] In the case of thin films, the transverse correlation length is smaller than the average lattice spacing, only a second order glass transition can be observed.[29] This in turn suggests that a regular VL with a relatively large radius is a necessity for the occurrence of a melting transition. This is consistent with the fact that artificially introduced pinning centers will induce a small Larkin length and smear out the melting transition. Further work on the study of the relatiohship between pinning strength and Larkin length need to be done in order to clarify this point.
Our results suggest the following physical scenario: in a clean Y124 single crystal, below the melting temperature Tm, the vortices form a rigid VL with l. As the superconductor is warmed up, at Tm, VL melting occurs. At this stage, the vortices lose their translational coherence while keeping the correlations along the c-axis. Thus the vortices in the temperature region just above the melting transition are in a 3D line liquid state. At this temperature region, the vortex form a kind of entangled vortices with their entanglement length lc smaller than the sample thickness t but much larger than the distance s between the CuO planes. The dissipation is governed by the vortex cutting and recombination. As the temperature increases, the correlation length in the c-axis becomes smaller and smaller and the difference between Rtop and Rbot gets larger and larger. Finally at the temperature Td, inter-plane decoupling occurs (lc s) and the vortices lose the coherence in the c direction and the vortices dissolve into 2D pancake vortices that move independently in the individual CuO planes.
IV Conclusions
In conclusion, we have observed the melting transition in Y124 single crystals. The vortices following the melting transition are in the 3D line liquid state with a correlation length in the c- direction lc smaller than the sample thickness but larger than the distance between the CuO planes of Y124. The temperature at which a resistive peak exists at Rbot is found to correspond to the interlayer decoupling transition temperature. Above the decoupling temperature, the vortices lose their coherence in the c-direction and the dissipation would be governed by tunneling of 2D vortices across the CuO planes. Our results also suggest that the interlayer decoupling transition is a continuous crossover rather than a sharp transition.
V Acknowledgments
We thank E. Rossel and P. Wagner for their help during the measurements and Y. Bruyneseraede for helpful discussions. This research has been supported by the ESF Programme ”VORTEX”, the Belgian IUAP and Flemish GOA and FWO Programmes.
REFERENCES
- [1] G. Blatter, M.V. Feigel’man, V.B. Geshkenbein, A.I. Larkin, and V.M. Vinokur, Rev. Mod. Phys. 66, 1125(1994).
- [2] R.H. Koch et al., Phys. Rev. Lett. 63, 1511(1989).
- [3] H. Safar et al., Phys. Rev. Lett. 69, 824(1992); Phys. Rev. Lett. 70, 3800(1993);Phys. Rev. B 46, 14238(1992).
- [4] W.K. Kwok et al., Phys. Rev. Lett. 69, 3370(1992); 72, 1088(1992).
- [5] E. Zeldov et al., Nature 375, 373(1995).
- [6] R. Liang, D.A. Bonn and W.N. Hardy, Phys. Rev. Lett. 76, 835(1996).
- [7] R. Cubitt et al., Nature 365, 407(1993).
- [8] A. Schilling et al., Nature 382,791(1996).
- [9] L. Glazman and A. Koshelev, Phys. Rev. B 43, 2835(1991); L.L. Daemen et al., Phys. Rev. Lett. 70, 1167(1993).
- [10] R.A. Doyle, D. Liney, W.S. Seow, A.M. Campbell, and K. Kadowaki, Phys. Rev. Lett. 75, 4520(1995);
- [11] D.T. Fuchs et al., Phys. Rev. B 55, 6156(1997).
- [12] Y.M. Wan, S.E. Hebboul and J.C. Garland, Phys. Rev. Lett. 72, 3867(1994).
- [13] C.D. Keener et al., Phys. Rev. Lett. 78, 1118(1997).
- [14] T. Blasius, Ch. Niedermayer, J. Tallon, D. Pooke, A. Golnik, and C. Bernhard, Phys. Rev. Lett. 82, 4926(1999).
- [15] D. Lopéz et al., Phys. Rev. Lett. 76, 4034(1996).
- [16] X.G.Qiu et al., Phys. Rev. B 58, 8826(1998).
- [17] J. Karpinski et al., Nature 336, 660(1988).
- [18] M.C. Hellerquist, S. Ryu, L.W. Lombardo, and A. Kapitulnik, Physica C 230, 170(1994).
- [19] G. Briceño, M.F. Crommie, and A. Zerl. Phys. Rev. Lett. 2164(1991).
- [20] K. Tamasaku, Y. Nakamura, and S. Uchida, Phys. Rev. Lett. 69, 1455(1992).
- [21] C.C. Homes, T. Timusk, R. Liang, D.A. Bonn, and W.N. Hardy, Phys. Rev. Lett. 71, 1645(1993).
- [22] M.Tachiki, T. Koyama, and S. Takahashi, Phys. Rev. B 50, 7065(1994).
- [23] P.W. Anderson, Science 268, 1154(1995); 279, 1196(1998).
- [24] M. Suzuki, T. Watanabe, and A. Matsuda, Phys. Rev. Lett. 81, 4248(1998).
- [25] Y. Nonomura, X. Hu, and M. Tachiki, Phys. Rev. B 59, 11657(1999).
- [26] M.A. Moore, Phys. Rev. B 55, 14136(1997); A. K. Kienappel and M. A. Moore, Phys. Rev. B 60, 6795(1999).
- [27] D.R. Nelson, Phys. Rev. Lett. 60, 1973(1988); A. Houghton, R. Pelcovits and A. Sudbf, Phys. Rev. B 40, 6763(1989).
- [28] L.I. Larkin and Y.N. Ovchinnikov, J. Low Temp. Phys. 34, 409(1979).
- [29] T. Giamarchi, and P. Le Doussal, Phys. Rev. B 55, 6577(1997).