Doping dependent evolution of the electronic
structure of La2-xSrxCuO4
in the
superconducting and metallic phases
Abstract
The electronic structure of the La2-xSrxCuO4 (LSCO) system has been studied by angle-resolved photoemission spectroscopy (ARPES). We report on the evolution of the Fermi surface, the superconducting gap and the band dispersion around the extended saddle point with hole doping in the superconducting and metallic phases. As hole concentration decreases, the flat band at moves from above the Fermi level () for to below for , and is further lowered down to . From the leading-edge shift of ARPES spectra, the magnitude of the superconducting gap around is found to monotonically increase as decreases from down to even though decreases in the underdoped region, and the superconducting gap appears to smoothly evolve into the normal-state gap at . It is shown that the energy scales characterizing these low-energy structures have similar doping dependences. For the heavily overdoped sample (), the band dispersion and the ARPES spectral lineshape are analyzed using a simple phenomenological self-energy form, and the electronic effective mass enhancement factor has been found. As the hole concentration decreases, an incoherent component that cannot be described within the simple self-energy analysis grows intense in the high-energy tail of the ARPES peak. Some unusual features of the electronic structure observed for the underdoped region () are consistent with the numerical works on the stripe model.
pacs:
PACS numbers: 74.25.Jb, 74.72.Dn, 79.60.-i, 71.18.+yI Introduction
For the detailed understanding of a high- cuprate system, the determination of the low-energy electronic structure, i.e., the Fermi surface, the band dispersion and the superconducting and normal-state gaps, is required as the ground for studies of superconducting mechanism and for the interpretation of thermodynamic and transport properties. Indeed, such information has been directly observed by angle-resolved photoemission spectroscopy (ARPES) for Bi2Sr2CaCu2O8+y (Bi2212),[2, 3, 4, 5, 6, 7, 8, 9, 10] Bi2Sr2CuO6+y (Bi2201)[11, 12] and YBa2Cu3O7-y (YBCO).[13] Since the electronic properties of the high- cuprates are strongly dependent on the hole concentration, it is necessary to investigate the doping dependence of ARPES spectra systematically over a wide hole concentration range in order to extract key features relevant to the high- superconductivity.
Among the high- cuprate systems, we have recently focused on the La2-xSrxCuO4 (LSCO) system [14, 15] because the hole concentration is well controlled over an exceptionally wide range and uniquely determined by the Sr concentration (and small oxygen non-stoichiometry). In addition, an instability towards spin-charge ordering in a stripe form has been extensively discussed from the incommensurate inelastic neutron peaks.[16, 17, 18] The suppression of at [19, 20] indicates that the stripe fluctuation has more static tendency in LSCO than in Bi2212.
In this paper, we address the evolution of the Fermi surface, the superconducting gap and the band dispersions with hole doping throughout the superconducting and metallic phases () of LSCO, focusing on the features around the extended saddle point at , which are crucial to the determination of the Fermi surface topology and the behaviors of superconducting and normal-state gaps. The discussion leads to the issue of the doping dependence common to three characteristic energies of the electronic structure, and the self energy and the electron effective mass are deduced. In the previous paper, ARPES spectra for and have been reported and the formation of a Fermi surface centered at for an overdoped sample has been addressed.[14] On the other hand, the evolution of the ARPES spectra around the superconductor-insulator transition () has been addressed in Ref. [15], where the suppression of quasiparticle weight around has been also discussed for underdoped superconducting LSCO.[15]
II Experimental
Single crystals of La2-xSrxCuO4 were grown by the traveling-solvent floating-zone method and were annealed so that the oxygen content became stoichiometric. The accuracy of the hole concentration was . The samples were insulating for , superconducting for , 0.15 and 0.22, and metallic without superconductivity for . Details of the growth conditions and characterization of the crystals are described elsewhere.[21, 22, 23]
ARPES measurements were carried out at the undulator beamline 5-3 of Stanford Synchrotron Radiation Laboratory (SSRL). Incident photons had energies of or 22.4 eV and were linearly polarized. The electric vector and the wave vector of the incident photons and the sample surface normal were kept in the horizontal plane. The samples were fixed with respect to the incident light with an incident angle of 45∘ and ARPES spectra were collected using a hemispherical analyzer of 50 mm radius. The total instrumental resolution including the analyzer and the monochromator was approximately 45 meV and the angular acceptance was . In the case of LSCO, corresponds to 1/19 and 1/23 of the distance in the Brillouin zone (BZ) of the CuO2 plane for the incident photon energies of and 22.4 eV, respectively. The samples were cleaved in situ at the plane parallel to the CuO2 planes by knocking a top-post glued on the sample under an ultra high vacuum better than Torr. The orientation of the sample surface normal was finely readjusted using the reflection of a laser beam. The direction of the - and -axes were finely corrected using the band folding in the ARPES spectra with respect to the line. Since the sample surface degraded rapidly at high temperatures, the samples were kept at low temperatures ( K) during the measurements. The cleanliness of the surface was checked by the absence of a hump at energy eV and of a shoulder of the valence band at eV. All the spectra presented here were taken within 12 hours after cleaving. The position of the Fermi level () was repeatedly calibrated with gold spectra during the measurement and the experimental uncertainty in the energy calibration was about meV. The intensities of the spectra at different angles have been normalized to the intensity of the incident light. In the present paper, the measured crystal momenta are referred to in units of , where is twice the Cu-O bond length within the CuO2 plane, and the extended zone notation is adopted, that is, a value larger than means that the momentum is in the second BZ.
III Results
A ARPES spectra
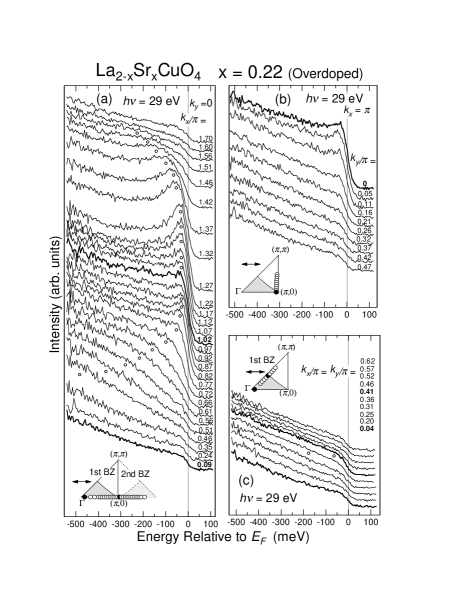
ARPES spectra of overdoped LSCO () in the superconducting state are shown in Fig. 1. Here, the spectra are the raw data recorded on the spectrometer except for that the energies have been calibrated to the Fermi edge of gold. It seems that the intensity of the dispersive component relative to the angle-independent background is weaker for LSCO than that for Bi2212. Probably, since the cleaved surface of LSCO is not so flat as that of Bi2212, some photoelectrons lose the momentum information at the surface of LSCO and thus detected as an angle-independent background. In addition, the peak intensity is also strongly affected by the transition matrix element, which is different among various cuprate materials. The relative weakness of the dispersive component due to the high background may induce some uncertainty of the spectral lineshape, compared to Bi2212. However, the peak energy is less affected by it, and the peak width of LSCO is practically similar to that of Bi2212 under the similar doping level and the same instrumental resolution [24]. Indeed, the energy position and width of the peak were well reproduced by several experiments, indicating validity of the analysis of the ARPES peak performed in Section III.E.
Usually the band dispersion is obtained by tracing the ARPES spectral peak. As one goes from (0,0) to or from to , the peak energy increases towards as shown in Fig. 1 (a). Around and , the peak reaches the vicinity of the Fermi level () and the peak intensity decreases between these points. However, part of the spectral weight remains below even at , and the weight completely disappears only in going from to [Fig. 1 (b)]. The remnant weight at is larger for than for ,[14] indicating that a band of flat dispersion around lies quite close to the Fermi level for .[12, 25] Since even for small weight remains below at ,[14] the band around is not a single peak but has a broad energy distribution, implying a complicated spectral weight distribution around as discussed recently.[26, 27] Along the (0,0) cut, although the dispersive feature is weak, the increase of the intensity at compared to the background around suggests a Fermi-surface crossing as in and 0.15.[14, 15] Overall, the electronic structure for is in transition between the electronic structures characterized by the Fermi surfaces centered at () and at ().[14]
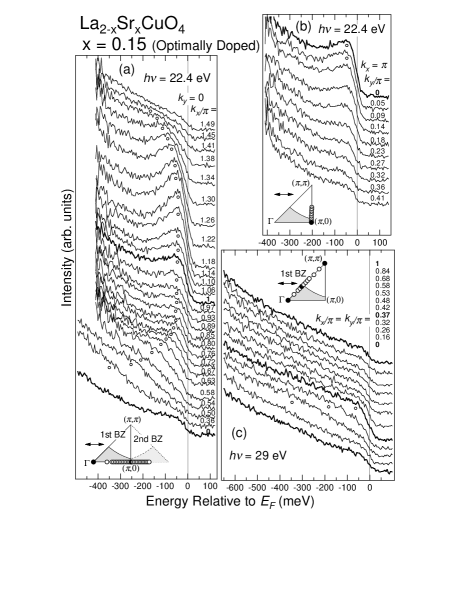
In Fig. 2, ARPES spectra for optimally doped LSCO () are displayed again[14, 15] in a similar way to Fig. 1. Even though the spectra were taken at a temperature ( K) well below ( K), the condensation peak is absent or unresolved for LSCO as in Bi2201,[11] while the lineshape with a peak, dip and hump has been observed around for Bi2212.[2, 28, 29] As one goes from to or from to , the peak approaches but clearly remains below at , indicating a Fermi surface centered at . In going from to , the peak intensity decreases, while the midpoint of a leading-edge is always below ( meV at the closest to , i.e., the minimum-gap locus), implying that the band goes above through the superconducting gap. The band around shows a very flat dispersion and is located slightly below .[12, 25] The spectra along for are similar to those for [14] and 0.22: one can identify the dispersion of the weak feature crossing at . Thus, the electronic structure for is similar to those for other optimally doped Bi2212[3] and Bi2201,[12] except for that the dispersive spectral peak along is weak for LSCO.
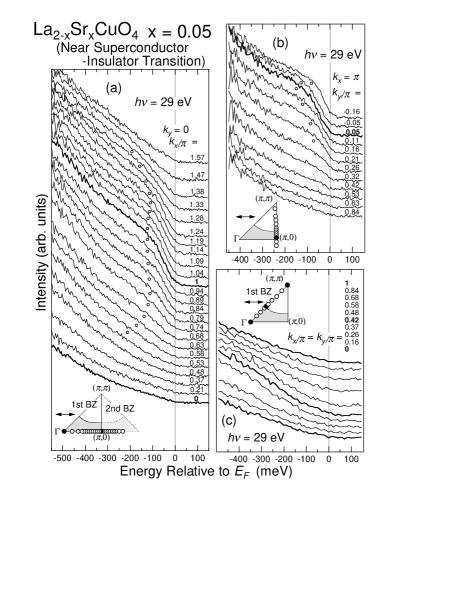
ARPES spectra of the heavily underdoped LSCO () in the normal state are shown in Fig. 3. As the hole concentration decreases, the peak near around becomes broader and weaker. This is consistent with the spectra of other underdoped cuprates, where the dispersive feature is so broad that it is merely a shoulder rather than a spectral peak.[4, 6] When the hole concentration decreases down to for LSCO, the feature near becomes too weak to discuss the dispersion because of the spectral weight transfer into a band around eV (see Fig. 6).[15] As shown in Fig. 3, while the band for stays below with very weak dispersion along , the band disperses rather strongly towards along and the feature disappears around before the leading-edge midpoint reaches , indicating that a gap is opened around for . Presumably, the gap is opened on the underlying Fermi surface as in the superconducting samples although , and may be regarded as a “normal-state gap”.[6, 7, 8, 9, 10] Remarkably, in the cut, no dispersive feature nor intensity modulation could be identified at for [15] in contrast to the spectra for . Therefore, the electronic structure near for is similar to that for reported in the previous paper [14]: the Fermi surface centered at is observed around , but it is invisible around .
B Band dispersions
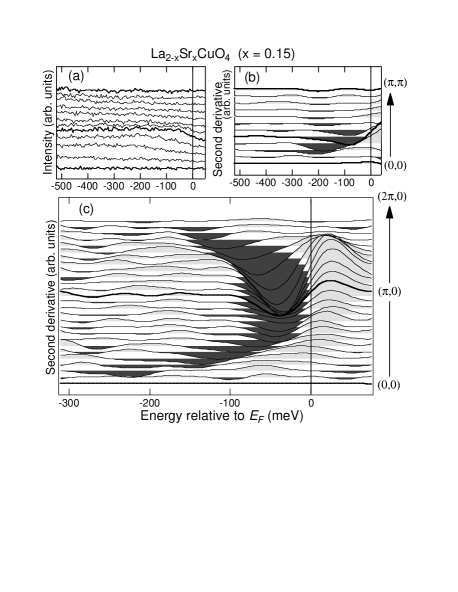
Overall band dispersions near are visualized in Fig. 5 by use of the second derivatives, which are shown in Fig. 4 for example. First, the step at seen in the spectrum at (0,0) seems to be present at all the angles with almost constant intensity, as shown in Figs. 1, 2 and 3. Hence, we assigned the spectrum at (0,0) to the angle-integrated signals likely due to the surface imperfection, because no emissions are allowed at (0,0) from the symmetry of Cu 3 orbitals due to the photoemission matrix-element effect. In order just to remove this extrinsic step, the spectra at (0,0) was subtracted from all the spectra at the other angles under simple normalization to the intensity of the incident light. The validity of this subtraction may be understood by a typical result shown in Fig. 4(a). Indeed, the spectrum at (0,0) is so featureless that its subtraction makes essentially no effect on the second derivatives except for the extrinsic step at . All the resulting spectra were then smoothed by convoluting with the gaussian whose energy width is the order of the energy resolution (typically meV), since the collected signals were of the order of counts for the peak component and thus the signal to noise ratio is the order of . Along the momentum direction, no smoothing nor interpolation is applied to the data and thus each horizontal pixel in Fig. 5 corresponds to each ARPES spectrum. Finally, the spectra are differentiated two times and displayed by the gray scale plot in Fig. 5, where white regions denote the negative peak of the second derivatives. In the differentiation, the energy step of the data was smaller enough (5 or 10 meV) compared to the energy resolution. Indeed, taking the second derivatives would be an appropriate way to visualize the band dispersion of this system, because for the dispersive feature does not show a clear peak but a shoulder. Practically, the second derivative method has been widely used and outlined the band dispersions excellently from the ARPES spectra.[30, 31, 32, 33, 34, 35, 36] The validity of the above data manipulations is assured by comparing the second derivatives in Fig. 4 (c) with the original raw spectra in Fig. 2 (a), and comparing Fig. 5 with the gray scale plot of the original data shown in the top panels of Fig. 10 for and 0.15. In Fig. 5, thin black curves following the negative peaks in the second derivatives are also drawn. Thus their error bars were represented by the half width of the white gradation. Note that, because of the Fermi cut-off and the finite instrumental resolution meV, spectral features near are pushed down below (dashed lines).[37] The obtained band dispersion for is similar to the ARPES results of other optimally doped cuprates such as Bi2212[3] and Bi2201.[12]
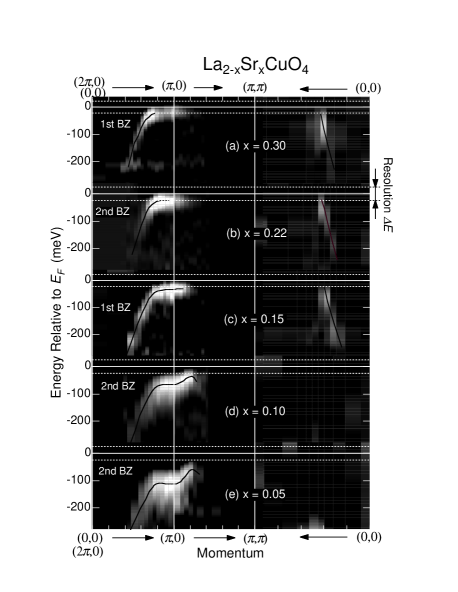
Figure 5 shows that the so-called “ flat band” is clearly observed for and 0.05 in the sense that the flat region around the saddle point at is extended up to .[12, 25] The flat band, which is meV below for , moves upwards monotonically with hole doping, crosses the Fermi level around causing the increase of the density of states (DOS) at as observed by angle-integrated photoemission (AIPES) [38] and the quasiparticle density reflected in the electronic specific heat,[39] and finally goes above the Fermi level. Since the chemical potential shift with hole doping is small ( meV) in the region ,[40] the energy shift of the flat band in this composition range is due to the deformation of the band structure itself. Probably the lowering of the flat band at is due to the influence of short-range antiferromagnetic correlations. Under the antiferromagnetic correlations, the spectral function of magnetic excitations is peaked near . Then, the photohole at is particularly dressed strongly in the collective magnetic excitations, because the photohole at can enter in the state of similar energy around with producing a collective excitation , as proposed by Shen and Schrieffer.[41, 42] Since the emissions from the dressed photoholes are predominant among the spectral intensity in the underdoped region, the kinetic energies of photoelectrons from are lowered by the stronger dressing of photoholes with decreasing hole concentration.
As for the underdoped samples ( and 0.10), the band dispersion around is not symmetric between the and directions. While the band is very flat showing almost no dispersion along , the dispersion along is substantial and consistent with a simple parabolic dispersion (with a gap at ). The asymmetric dispersion and the unclear Fermi surface around for underdoped LSCO are consistent with the electronic structures calculated by numerical exact diagonalization on small clusters with stripes[43] and calculated within the Hubbard model with the stripes using the Hartree-Fock approximation[44] and dynamical mean-field theory.[45]
The band around is thought to primarily contribute to the formation of the superconducting condensate in a -wave superconductor, because the quasiparticle weight near around is virtually absent in underdoped LSCO (). As shown in Fig. 5, when LSCO is optimally doped, the flat band around is located slightly below as in the other cuprate systems. This is the case for all the hole-doped high- cuprates studied by ARPES so far,[3] suggesting that the energy position of the flat band has an universal doping dependence among high- cuprates, and that the optimum requires the flat band to be near .[46] As for the relevance of the flat-band energy to the high-, the presence of the flat band near enhances the density of low-energy single-particle excitations which are involved in the formation of the superconducting condensate through a large portion of the -space.[25]
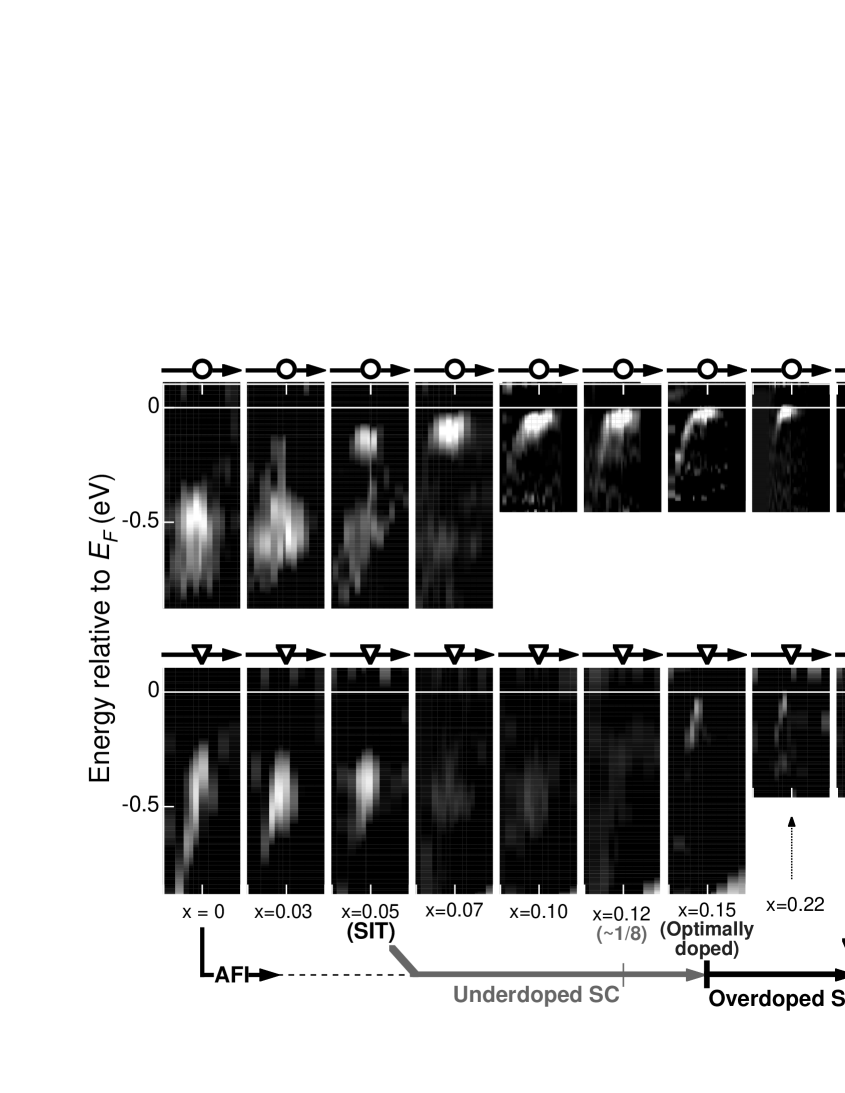
In Fig. 6, we summerize the doping dependences of the dispersions around and . It is clearly seen that the flat band around is lowered as decreases and loses its intensity in the insulating phase. As reported previously,[15] the spectral weight is transferred from the band near ( eV) to the lower Hubbard band at eV in the vicinity of the superconductor-insulator transition (). The evolution of the band near is different between and : with decreasing , the spectral weight is largely lost already at for , whereas it remains substantial down to for . On the other hand, the evolution of the insulating band at eV is similar between and .
C Fermi surface
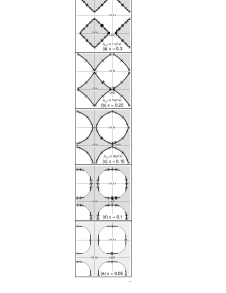
From the ARPES spectra taken at various doping levels, the doping dependence of the Fermi surface has been deduced as shown in Fig. 7. Here the Fermi-surface crossings have been determined to be the momenta where the leading-edge energy reaches a local maximum and the spectral peak intensity (quasiparticle weight) changes most strongly. They correspond to the minimum-gap loci, when a gap is opened on the Fermi surface. As for the superconducting gap, it has been confirmed that the minimum-gap locus coincides with the Fermi surface in the normal state.[47] In Fig. 7, thick error bars denote the actually measured positions of Fermi surface, and the width of the error bars indicate two momenta where the most weight of dispersive features is clearly below and has almost gone above . The area enclosed by the Fermi surface is , and of the half BZ area for , 0.22 and 0.15, respectively, consistent with the Luttinger sum rule for the electron density ( and , respectively). As for and 0.05, since the Fermi surface around was invisible, dotted curves are tentatively drawn in Fig. 7 so that the area enclosed by the Fermi surface is and , respectively,[23] of the half BZ area, supposing that the Luttinger sum rule is still satisfied. As the hole concentration decreases, the Fermi surface near smoothly moves through so that the topological center of the Fermi surface is turned over from to at . On the other hand, the position of the Fermi surface near is less sensitively dependent on the hole concentration and the weak spectral intensity near at becomes invisibly weak for .[15] The Fermi surface of LSCO is thus strongly doping dependent, while the Fermi surface of optimally doped LSCO is basically similar to that of Bi2212.[3, 4]
Figure 7 indicates that “small hole pocket” around is absent even in the underdoped LSCO. Hence the decrease in the carrier density proportional to , which has been observed in the hall coefficient measurement as ,[48] should be attributed to that the quasiparticle weight around decreases as due to the spectral weight transfer to higher binding energies.[15, 38]
D Energy gap
The doping dependence of the energy gap at may be estimated from the leading-edge shift on the Fermi surface.[5, 6, 7, 8, 9, 10, 11, 13] Figure 8(a) shows the ARPES spectra at the momenta where the leading edge reaches the maximum energy (minimum-gap locus) around as shown by open circles in the inset. Here, the spectrum at has been subtracted as the angle-independent background for each composition. For the non-superconducting () sample, the leading-edge midpoint is apparently pushed above ( meV) due to the finite instrumental resolution ( meV).[8] As the hole concentration decreases, the energy of the peak and the leading edge are shifted downwards as a result of the opening of the superconducting gap.
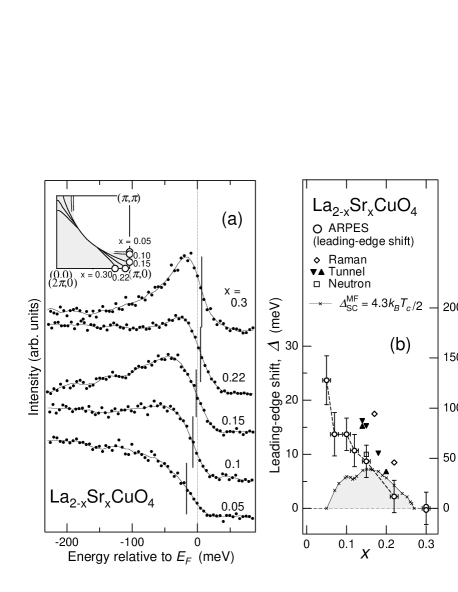
In Fig. 8(b), the energy shift of the leading-edge midpoint relative to that for ( meV) is plotted and compared with the results of other experiments on LSCO, i.e., Raman scattering,[49] tunneling [50] and neutron scattering[51] studies (left axis). Crosses indicate the superconducting transition temperature (right axis) and the prediction of the mean-field theory for the -wave superconducting gap [52] (left axis). In fact, what are measured in these experiments are different quantities, e.g., the neutron scattering measures the gap in the spin-excitation spectrum, which is not simply connected to the single particle excitation gap probed by ARPES. In addition, the magnitude of the ARPES leading-edge shift tends to be smaller than the tunneling result, probably because the broadness of the peak reduces the apparent shift of the ARPES leading edge, while it hardly affects the peak position observed in tunneling spectra, which represent the momentum-integrated spectral function. Nevertheless the doping dependence of the gap magnitude is consistent among the ARPES and the other experiments.
As the hole concentration decreases, the magnitude of keeps increasing even in the underdoped region, in spite of the decreasing . This remarkable feature has also been reported for Bi2212 [7, 9] and is thus likely to be an universal feature of the cuprate superconductors. The present data have ensured that this tendency is sustained down to . Although the sample of is not superconducting, still an energy gap is opened at as shown in Fig. 3(b), corresponding to the “normal-state gap” observed for underdoped Bi2212.[6, 7, 8, 9, 10] From the ARPES spectra [Figs. 3(b) and 8(b)], it appears that the superconducting gap smoothly evolves into the normal-state gap with decreasing hole concentration . This observation certainly has the same significance as the fact that the temperature dependence of the leading-edge shift is continuous at for underdoped Bi2212,[6, 7, 8, 9, 10] These connections between the normal-state and superconducting gaps suggest that these gaps have the same origin. Assuming that the magnitude of the energy gap represents the paring strength, the doping dependence of may be roughly described using the product of and the quasiparticle density at related to the flat-band energy. When the hole concentration is further decreased to , the normal-state gap becomes difficult to be identified because the spectral weight of the band near diminishes, and alternatively the wide insulating gap ( eV) becomes predominant[15].
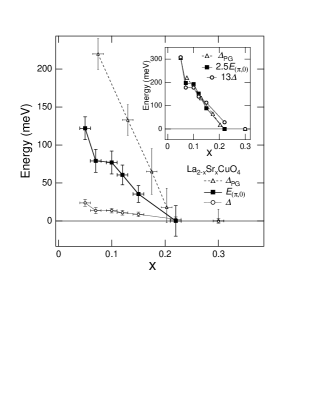
Figure 9 shows the binding energy of the band at [53] which is confidently determined by measuring several samples for each , compared with the energies of the superconducting or normal-state gap measured by the ARPES leading-edge shift and the “large pseudogap” , which would correspond to the high energy bump in AIPES spectra.[38, 54] These characteristic energies show quite similar doping dependences as shown in the inset, even though their energy scales are different: and . Therefore, the electronic structure of the underdoped LSCO is essentially characterized by a single parameter which rapidly increases as decreases for . The proportionality implies that the origin of the superconducting and normal-state gaps may be related to that of the large pseudogap and the flat-band energy, indicating that the behaviors of the cuprate superconductors are strongly affected by the short-range antiferromagnetic correlations.[38, 41, 55]
E Self-energy analysis
In order to deduce the energy position and width of the ARPES peak more precisely, a model for the spectral lineshape is necessary. The actual peak is asymmetric and fairly deviated from the simple Lorentzian even for the heavily overdoped sample () [14]. Therefore, we introduce a simple but more general form of the self-energy[56]:
which satisfies Kramers-Kronig relation. The denominator of the second term is to make converge to zero for , a sufficiently large being taken as a cut-off energy. Then, for , is expanded around as . Here, is the characteristic energy which scales for the quasiparticle energy , represents the scattering rate of the quasiparticles at and should be zero for an ideal Fermi-liquid, and represents the high energy limit of the peak width since for . In the present analysis, the momentum dependence of the self-energy is ignored for the simplicity. Then, the spectral function is given by
where is the dispersion of the single particle band. The calculated spectra have been obtained as the product of and the Fermi-Dirac distribution function , and then broadened by the energy and angular resolutions (42 meV and 2∘, respectively). Finally, upon comparing with experimental spectra, the angle-independent background, i.e., the spectrum at (0,0), is commonly added to the calculated spectra.
Parameters fixed in the analysis are the temperature and the energy and momentum resolutions, and the single-particle dispersion has been taken from the local-density-approximation (LDA) energy band of undoped La2CuO4[57]. On the other hand, the parameters, , and , describing the self-energy are obtained from the present least-square-fit analysis, and the results are shown in Table I. Here, the chemical potential shift of the LDA band due to the hole doping into La2CuO4 is adjusted to reproduce the experiment, and the spectral intensity at each angle has also been adjusted to the experiment, because the momentum dependence of the matrix element is unknown.
| (ARPES) | (eV) | (eV) | (eV) | Fermi surface | () | |
|---|---|---|---|---|---|---|
| 2.0 | 0.20 | 0.21 | 0.077 | centered at | 2.5 | |
| 2.1 | 0.30 | 0.34 | 0.081 | centered at | 2.5 |
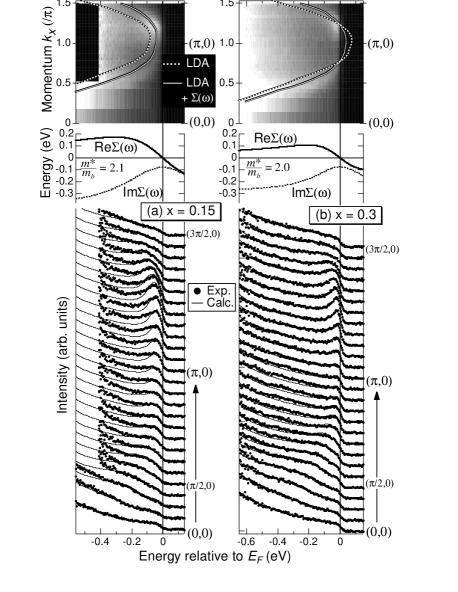
Figure 10 shows the results of such analysis for cut. Both the peak lineshape and the peak dispersion are successfully reproduced for the heavily overdoped sample (), confirming the dispersion relation and Fermi surface crossings shown in Figs. 5 and 7. Note that the weak residual spectral weight around is also present in the calculated spectra even though the band energy at is above , indicating that the experimental spectra are consistent with the Fermi surface centered at . For the optimally doped sample (), on the other hand, the high-energy tail of the peak was difficult to reproduce after extensive trials particularly around , although the peak dispersion and the peak leading-edge are almost correctly reproduced by a self-energy similar to that of . The result for indicates that the high-energy tail around contains an intense incoherent component which cannot be described by the simple model self-energy analysis. This difficulty, in addition to the limited experimental resolution, indicate that the obtained , which describes the peak shape, has some uncertainties, while obtained from the peak position is reliably determined.
The effective mass relative to the bare-electron mass is also obtained from the self energy:
and the result is shown in Table I. Namely, the electron effective mass has been directly obtained from the band dispersion around the Fermi level. The effective-mass enhancement factor deduced from ARPES spectra is approximately consistent with that from the electronic specific heat coefficients [39], indicating that the used self-energy is reasonable to some extent. Furthermore, we also find the peak in the spectral function at has a width of meV for both and 0.15, in addition to the broadening due to the instrumental resolutions. The quantities of obtained by the present analysis are approximately consistent with that the result for overdoped Bi2212 is meV independent of temperature in the normal state [58]. Although the spectrum of the sample was taken in the superconducting state, our preliminary temperature-dependent measurements indicated no significant broadening of the peak above except for the thermal broadening.
IV Conclusions
In summary, the systematic ARPES study of LSCO has revealed the evolution of the Fermi surface, the superconducting gap and the band dispersion around with hole doping. While the Fermi surface and the band dispersion of the optimally doped LSCO are essentially consistent to the result of Bi2212,[3] those low-energy electronic structures have been found to change drastically for the wide hole concentration range () available for LSCO. Notably, the magnitude of the superconducting gap keeps increasing as decreases down to , and the superconducting gap appears to evolve smoothly into the normal-state gap for . It has been shown that the doping dependence of deviates from the decreasing in the underdoped region but follows a doping dependence common to other two characteristic energies: the energy of the extended flat band at and the pseudogap energy obtained from AIPES. Therefore, the electronic structure of the underdoped cuprates may be characterized by a single parameter. For the heavily overdoped region (), the simple self-energy analysis have successfully reproduced both the band dispersion and the spectral lineshape and indicated the effective mass . However, as hole concentration decreases, the incoherent component which cannot be described by the simple self-energy analysis grows intense in the high-energy tail of the ARPES peak. As the flat band at is lowered with decreasing , the band dispersion along becomes faster, while almost no dispersion along is kept. Such electronic structure is consistent with some stripe-model calculations. This picture is also supported by the earlier observation of two components in the electronic structure.[15]
Acknowledgment
This work was supported by the New Energy and Industrial Technology Development Organization (NEDO), a Special Coordination Fund for Promoting Science and Technology from the Science and Technology Agency of Japan, a Grant-in-Aid for Scientific Research “Novel Quantum Phenomena in Transition Metal Oxides” from the Ministry of Education, Science, Culture and Sports of Japan, and the U. S. DOE, Office of Basic Energy Science and Division of Material Science. Stanford Synchrotron Radiation Laboratory is operated by the U. S. DOE, Office of Basic Energy Sciences, Division of Chemical Sciences.
REFERENCES
- [1] Present address: Japan Atomic Research Institute (JAERI), SPring-8, Hyogo 679-5148, Japan.
- [2] Z.-X. Shen and D. S. Dessau, Phys. Rep. 253, 1 (1995).
- [3] D. S. Marshall, D. S. Dessau, A. G. Loeser, C.-H. Park, A. Y. Matsuura, J. N. Eckstein, I. Bozovic, P. Fournier, A. Kapitulnik, W. E. Spicer, and Z.-X. Shen, Phys. Rev. Lett. 76, 4841 (1996).
- [4] H. Ding, M. R. Norman, T. Yokoya, T. Takeuchi, M. Randeria, J. C. Campuzano, T. Takahashi, T. Mochiku, and K. Kadowaki, Phys. Rev. Lett. 78, 2628 (1997).
- [5] H. Ding, M. R. Norman, J. C. Campuzano, M. Randeria, A. F. Bellman, T. Yokoya, T. Takahashi, T. Mochiku, and K. Kadowaki, Phys. Rev. B 54, R9678 (1996).
- [6] H. Ding, T. Yokoya, J. C. Campuzano, T. Takahashi, M. Randeria, M. R. Norman, T. Mochiku, K. Kadowaki, and J. Giapintzakis, Nature 382, 51 (1996).
- [7] P. J. White, Z.-X. Shen, C. Kim, J. M. Harris, A. G. Loeser, P. Fournier, and A. Kapitulnik, Phys. Rev. B 54, R15669 (1996).
- [8] A. G. Loeser, Z.-X. Shen, D. S. Dessau, D. S. Marshall, C.-H. Park, P. Fournier, and A. Kapitulnik, Science 273, 325 (1996).
- [9] J. M. Harris, Z.-X. Shen, P. J. White, D. S. Marshall, M. C. Schabel, J. N. Eckstein, and I. Bozovic, Phys. Rev. B 54, 15665 (1996).
- [10] M. R. Norman, H. Ding, M. Randeria, J. C. Campuzano, T. Yokoya, T. Takeuchi, T. Takahashi, T. Mochiku, and K. Kadowaki, P. Guptasarma and D. G. Hinks, Nature 392, 157 (1998).
- [11] J. M. Harris, P. J. White, Z.-X. Shen, H. Ikeda, R. Yoshizaki, H. Eisaki, S. Uchida, W. D. Si, J. W. Xiong, Z.-X. Zhao, and D. S. Dessau, Phys. Rev. Lett. 79, 143 (1997).
- [12] D. M. King, Z.-X. Shen, D. S. Dessau, D. S. Marshall, C.-H. Park, W. E. Spicer, J. L. Peng, Z. Y. Li, and R. L. Greene, Phys. Rev. Lett. 73, 3298 (1994).
- [13] M. C. Schabel, C.-H. Park, A. Matsuura, Z.-X. Shen, D. A. Bonn, R. Liang, and W. N. Hardy, Phys. Rev. B 55, 2796 (1997).
- [14] A. Ino, C. Kim, T. Mizokawa, Z.-X. Shen, A. Fujimori, M. Takaba, K. Tamasaku, H. Eisaki and S. Uchida, J. Phys. Soc. Jpn. 68, 1496 (1999).
- [15] A. Ino, C. Kim, M. Nakamura, T. Yoshida, T. Mizokawa, Z.-X. Shen, A. Fujimori, T. Kakeshita, H. Eisaki and S. Uchida, Phys. Rev. B62, 4137 (2000).
- [16] J. M. Tranquada, B. J. Sternlieb, J. D. Axe, Y Nakamura, and S. Uchida, Nature 375, 561 (1995).
- [17] J. Zaanen and A. M. Oleś, Ann. Physik 5, 224 (1996).
- [18] M. I. Salkola, V. J. Emery, and S. A. Kivelson, Phys. Rev. Lett. 77, 155 (1996).
- [19] A. R. Moodenbaugh, Y. Xu, M. Suenaga, T. J. Folkerts, and R. N. Shelton, Phys. Rev. B 38, 4596 (1988).
- [20] M. K. Crawford, R. L. Harlow, E. M. McCarron, W. E. Farneth, J. D. Axe, H. Chou, and Q. Huang, Phys. Rev. B 44, 7749 (1991).
- [21] Y. Nakamura and S. Uchida, Phys. Rev. B 47, 8369 (1993).
- [22] S. Uchida, K. Tamasaku, and S. Tajima, Phys. Rev. B 53, 14558 (1996).
- [23] K. Tamasaku, Y. Nakamura, and S. Uchida, Phys. Rev. Lett. 69, 1455 (1992).
- [24] D. S. Dessau, Z.-X. Shen, D. M. King, D. S. Marshall, L. W. Lombardo, P. H. Dickinson, A. G. Loeser, J. DiCarlo, C.-H. Park, A. Kapitulnik and W. E. Spicer, Phys. Rev. Lett. 71, 2781 (1993).
- [25] R. S. Markiewicz, J. Phys. Chem. Solids. 58, 1179 (1997).
- [26] Y.-D. Chuang, A. D. Gromko, D. S. Dessau, Y. Aiura, Y. Yamaguchi, K. Oka, A. J. Arko, J. Joyce, H. Eisaki, S. Uchida, K. Nakamura and Y. Ando, Phys. Rev. Lett.83 3717 (1999).
- [27] H. M. Fretwell, A. Kaminski, J. Mesot, J. C. Campuzano, M. R. Norman, M. Randeria, T. Sato, R. Gatt, T. Takahashi and K. Kadowaki, Phys. Rev. Lett.84 4449 (2000).
- [28] A.-G. Loeser, Z.-X. Shen, M. C. Schabel, C. Kim, M. Zhang, A. Kapitulnik and A. Fpirnier, Phys. Rev. B56 14185 (1997).
- [29] M. R. Norman, H. Ding, J. C. Campuzano, T. Takeuchi, M. Randeria, T. Yokoya, T. Takahashi, T. Mochiku and K. Kadowaki, Phys. Rev. Lett.79 3506 (1997).
- [30] H. Kumigashira, H.-D. Kim, A. Ashihara, A. Chainani, T. Yokoya, T. Takahashi, A. Uesawa, and T. Suzuki, Phys. Rev. B56, 13654 (1997).
- [31] T. Takahashi, T. Yokoya, A. Ashihara, O. Akaki, H. Fujisawa, A. Chainani, M. Uehara, T. Nagata, and J. Akimitsu, and H. Tsunetsugu, Phys. Rev. B56, 7870 (1997).
- [32] H. Kumigashira, Hyeong-Do Kim, T. Ito, A. Ashihara, T. Takahashi, T. Suzuki, M. Nishimura, O. Sakai, Y. Kaneta and H. Harima, Phys. Rev. B58, 7675 (1998).
- [33] H. Fujisawa, T. Yokoya, T. Takahashi, S. Miyasaka, M. Kibune, and H. Takagi, Phys. Rev. B59, 7358 (1999).
- [34] T. Ito, H. Kumigashira, Hyeong-Do Kim, T. Takahashi, N. Kimura, Y. Haga, E. Yamamoto, Y. Onuki and H. Harima, Phys. Rev. B59, 8923 (1999).
- [35] Akinori Tanaka, Koji Tamura, Hiroshi Tsunematsu, Kazutoshi Takahashi, Masayuki Hatano, Shoji Suzuki, Shigeru Sato, Satoru Kunii, Ayumi Harasawa, Akio Kimura, and Akito Kakizaki, Phys. Rev. B56, 7660 (1997).
- [36] T. Mizokawa, C. Kim, Z.-X. Shen, A. Ino, A. Fujimori, M. Goto, H. Eisaki, S. Uchida, M. Tagami, K. Yoshida, A. I. Rykov, Y. Siohara, K. Tomimoto, and S. Tajima, Phys. Rev. B60, 12335 (1999).
- [37] If the peak at in the spectral function were a delta function as expected for a conventional Fermi liquid, the finite resolution would make no effect on the peak position. However, the actual ARPES spectra seem to have a finite peak width ( meV) at in addition to the broadening due to the energy and angular resolutions, as indicated by the analysis in Sec. III E. Therefore, the ARPES peak due to a band near appears below in the acutual spectra.
- [38] A. Ino, T. Mizokawa, K. Kobayashi, A. Fujimori, T. Sasagawa, T. Kimura, K. Kishio, K. Tamasaku, H. Eisaki and S. Uchida, Phys. Rev. Lett. 81, 2124 (1998).
- [39] N. Momono, M. Ido, T. Nakano, M. Oda, Y. Okajima and K. Yamaya, Physica C 233, 395 (1994).
- [40] A. Ino, T. Mizokawa, A. Fujimori, K. Tamasaku, H. Eisaki, S. Uchida, T. Kimura, T. Sasagawa and K. Kishio, Phys. Rev. Lett. 79, 2101 (1997).
- [41] Z.-X. Shen and J. R. Schrieffer, Phys. Rev. Lett.78, 1771 (1997).
- [42] C. Kim, P. J. White, Z.-X. Shen, T. Tohyama, Y. Shibata, S. Maekawa, B. O. Wells, Y. J. Kim, B. J. Birgeneau, and M. A. Kastner, Phys. Rev. Lett. 80, 4245 (1998).
- [43] T. Tohyama, S. Nagai, Y. Shibata, and S. Maekawa, Phys. Rev. Lett. 82, 4910 (1999).
- [44] M. Ichioka and K. Machida, J. Phys. Soc. Jpn. 68, 4020 (1999).
- [45] M. Fleck, A. I. Lichtenstein, E. Pavarini and A. M. Oles, Phys. Rev. Lett.84, 4962 (2000).
- [46] M. Imada and M. Kohno, Phys. Rev. Lett. 84, 143 (2000).
- [47] J. C. Campuzano, H. Ding, M. R. Norman, M. Randeria, A. F. Bellman, T. Yokoya, T. Takahashi, H. Katayama-Yoshida, T. Mochiku, and K. Kadowaki, Phys. Rev. B 53, 14737 (1996).
- [48] S. Uchida, H. Takagi, Y. Tokura, N. Koshihara, and T. Arima, in Strong Correlation and Superconductivity, edited by H. Fukuyama, S. Maekawa, and A. P. Malozemof (Springer-Verlag, Berlin, 1989), p. 194.
- [49] X. K. Chen, J. C. Irwin, H. J. Trodahl, T. Kimura, and K. Kishio, Phys. Rev. Lett. 73, 3290 (1994).
- [50] T. Nakano, N. Momono, M. Oda, and M. Ido, J. Phys. Soc. Jpn. 67, 2622 (1998).
- [51] K. Yamada, S. Wakimoto, G. Shirane, C. H. Lee, M. A. Kastner, S. Hosoya, M. Greven, Y. Endoh, and R. J. Birgeneau, Phys. Rev. Lett. 75, 1626 (1995).
- [52] H. Won and K. Maki, Phys. Rev. B 49, 1397 (1994).
- [53] As for , it is due to the Fermi cut-off and the finite instrumental resolution that a weak spectral peak appears slightly below at . In reality, the Fermi-surface crossing for is quite close to the point as discussed in Sec. III. A and C. Therefore, in Fig. 9 (b), for is plotted at zero with a relatively large error bar.
- [54] T. Sato, T. Yokoya, Y. Naitoh, T. Takahashi, K. Yamada and Y. Endoh, Phys. Rev. Lett. 83, 2254 (1999).
- [55] T. Nakano, M. Oda, C. Manabe, N. Momono, Y. Miura and M. Ido, Phys. Rev. B 49, 16000 (1994).
- [56] T. Saitoh, A. Sekiyama, T. Mizokawa, A. Fujimori, K. Ito, H. Nakamura and M. Shiga, Solid. State. Comm. 95, 307 (1995).
- [57] W. E. Pickett, Rev. Mod. Phys. 61, 433 (1989).
- [58] M. R. Norman, M. Randeria, H. Ding and J. C. Campuzano, Phys. Rev. B57, R11093 (1998).