Vortex precession in Bose-Einstein condensates: observations with filled and empty cores
Abstract
We have observed and characterized the dynamics of singly
quantized vortices in dilute-gas Bose-Einstein condensates. Our
condensates are produced in a superposition of two internal states
of 87Rb, with one state supporting a vortex and the other
filling the vortex core. Subsequently, the state filling the core
can be partially or completely removed, reducing the radius of the
core by as much as a factor of 13, all the way down to its bare
value. The corresponding superfluid rotation rates, evaluated at
the core radius, vary by a factor of 150, but the precession
frequency of the vortex core about the condensate axis changes by
only a factor of two.
PACS number(s): 03.75.Fi, 67.90.+z, 67.57.Fg, 32.80.Pj
The dynamics of quantized vortices in superfluid helium and superconductors have been fascinating and important research areas in low-temperature physics [2]. Continued study of vortex dynamics may, for example, lead to a better understanding of energy dissipation in these systems [3]. Work on optical vortices has also become an active area of research [4]. More recently, demonstrations of the creation of quantized vortices in dilute-gas Bose-Einstein condensates (BEC) [5, 6] have proven to be striking examples of the similarities between the condensed matter, optical, and dilute-gas quantum systems. Because of the observational capabilities of dilute-gas BEC experiments and the ability to manipulate the quantum wavefunction of the condensates, these systems provide a unique approach to the study of quantized vortices and their dynamics. This paper reports direct observations and measurements of singly quantized vortex core precession in a BEC.
Numerous theoretical papers have explored the expected stability and behavior of vortices in BEC [7, 8, 9, 10, 11, 12, 13, 14]. One interesting predicted effect is vortex core precession about the condensate axis [7, 9, 10, 11, 12, 13]. Radial motion of the core within the condensate can also occur, and may be understood as being due to energy dissipation and damping processes.
Core precession may be described in terms of a Magnus effect – a familiar concept in fluid dynamics and superfluidity [2]. An applied force on a rotating cylinder in a fluid leads to cylinder drift (due to pressure imbalances at the cylinder surface) that is orthogonal to the force. Analogously, a net force on a vortex core in a superfluid results in core motion perpendicular to both the vortex quantization axis and the force. In the condensate vortex case, these forces can be due to density gradients within the condensate, for example, or the drag due to thermal atoms. The density-gradient force may be thought of as one component of an effective buoyancy: just as a bubble in a fluid feels a force anti-parallel to the local pressure gradient, a vortex core in a condensate will feel a force towards lower condensate densities. The total effective buoyancy, however, is due less to displaced mass (the “bubble”) than it is to dynamical effects of the velocity-field asymmetry, which in turn is a consequence of a radially offset core. Typically, the total buoyancy force is towards the condensate surface, and the net effect is a precession of the core around the condensate axis via the Magnus effect. Drag due to the motionless (on average) thermal atoms opposes core precession, causing the core to spiral outwards towards the condensate surface. In the absence of this drag (for temperature ), radial drift of the core may be negligible.
Our techniques for creating and imaging a vortex in a coupled two-component condensate are described in refs. [5, 15]. The two components are the and internal states of the 87Rb atom, henceforth labeled as states and respectively. We start with a condensate of atoms, confined in a spherical potential with oscillator frequency 7.8 Hz. A near-resonant microwave field causes some of the atoms to convert to atoms. The presence of a rotating, off-resonant laser beam spatially modulates the amplitude and phase of the conversion. The net result is a conversion of about half of the sample into an annular ring of atoms with a continuous quantum phase winding from 0 to 2 about the circumference – a singly quantized vortex. The balance of the sample remains in the non-rotating state and fills the vortex core. With resonant light pressure we can selectively remove as much of the core material as we desire. In the limit of complete removal, we are left with a single-component, bare vortex state.
In this bare-core limit, the core radius is on the order of the condensate healing length , where is the peak condensate density and is the scattering length. For our conditions, m, well under our imaging resolution limit. The bare core can be observed after ballistic expansion [6] of the condensate, but this is a destructive measurement. On the other hand, if we leave some of the -state atoms filling the core, the pressure of the filling material opens up the radius of the vortex core to the point where we can resolve the core in a time series of nondestructive phase-contrast images.
Filled-core dynamics – We first discuss vortex dynamics in two-component condensates, where of the atoms were in the fluid filling the vortex core. We took successive images of the atoms in the magnetic trap, with up to 10 images of each vortex. The vortex core is visible as a dark spot in a bright distribution, as shown in Fig. 1(a). Instabilities in our vortex creation process usually resulted in the creation of off-center vortex cores, allowing us to observe precession of the cores. We observed precession out to 2 s, after which the fluid had decayed to the point that the vortex core was too small to be observed in the trapped condensate.
The recorded profile of each trapped condensate was fit with a smooth Thomas-Fermi distribution. Each vortex core profile was fit with a Gaussian distribution to determine its radius and position within the condensate. From the fits, we determined the overall radius of the trapped condensate (typically 22 m), the HWHM radius of the filled vortex core, and the displacement and angle of the core center with respect to the condensate center. Core angles and radii for the images in Fig. 1(a) are shown in Figs. 1(c) and (d). The vortex core is seen precessing in a clockwise direction, which is the same direction as the vortex fluid flow around the core.
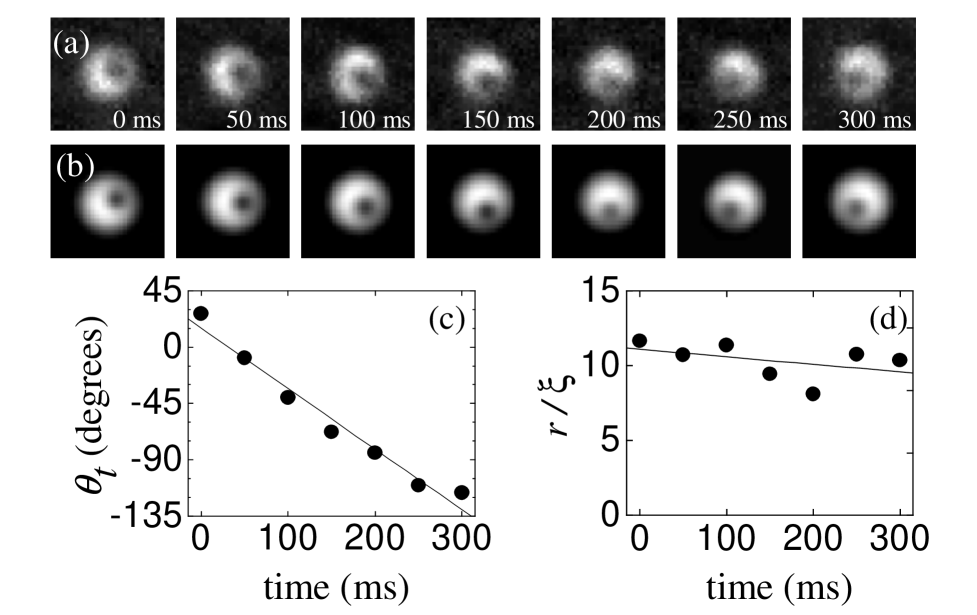
The angular precession frequency was determined from the time dependence of (Fig. 1(c)). This and other similar data sets showed no reproducible radial motion of the core over the times and parameters examined. However, consistent decrease in the size of the core was observed, which we interpret as being due to known decay of the fluid through inelastic atomic collisional processes.
For each data set, we determined a mean core radius and displacement. The data cover a range of core radii ( to ), displacements ( to ), and percentage of atoms in the core ( to ). Except for a few “rogue vortices” (discussed below), the measured precession frequencies are clustered around 1.4 Hz, as shown in Fig. 2, precessing in the same direction as the vortex fluid rotation. The data (Fig. 2(a)) suggest a slight increase in frequency for cores further from the condensate center, in qualitative agreement with two-dimensional numerical simulations for two-component condensates [16]. We also see (Fig. 2(b)) a slight decrease in precession frequency for larger cores.
As indicated in Fig. 2, a few vortex cores exhibited precession opposite to that of the fluid flow, but with absolute frequencies similar to the bulk of the data. The quality of the corresponding vortex images was routinely lower than for the positive-frequency precession points, with vortices looking more like crescents and “D” shaped objects rather than like the images of Fig. 1. We speculate that this “inverse precession” may be due to distorted configurations of vortices in the two-component condensate in which vortex dynamics are not as well understood. Such configurations have received recent theoretical attention [14].

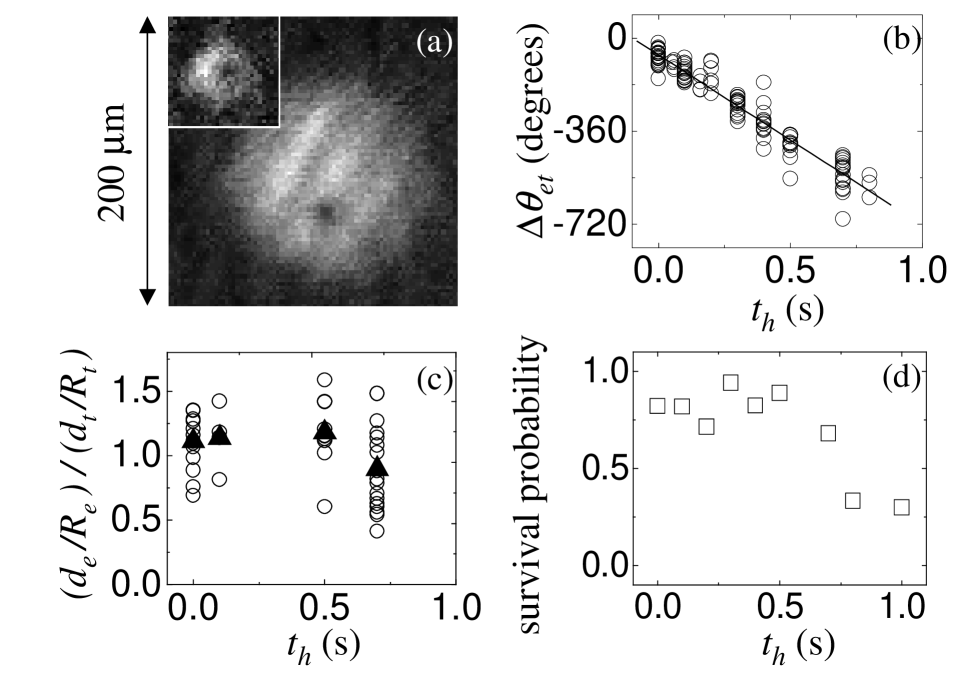
Bare core dynamics – To examine the dynamics of bare vortices, our procedure consisted of taking a nondestructive phase-contrast picture of the partially filled vortex distribution (Fig. 3(a) inset), as previously discussed, followed by complete removal of the core filling [17]. We then held the bare vortex in the trap for a variable hold time , after which the condensate was released from the trap. We took a final near-resonance phase-contrast image [18] of the atomic distribution (Fig. 3(a)) after the condensate had ballistically expanded by a factor of [19] and the core had expanded [20] to a fit radius of m.
Displacements and angular positions of the cores for the in-trap images were extracted as described before. The images of the expanded clouds were fit with identical distributions, and the Thomas-Fermi radius of the expanded cloud and the vortex core displacement and angle were obtained for each image. For each pair of images, we determined the angular difference between the cores in the expanded and in-trap images. We also determined the core displacement ratio , an indicator of the radial motion of the core during the hold time .
From the measurements of at different hold times (Fig. 3(b)), we find a bare core precession frequency of 1.8(1) Hz, which is slightly faster than the precession of filled cores and consistent with the trend shown in Fig. 2(b) for filled cores. To emphasize that our measurements of filled and empty cores are different limits in a continuum of filling material, we indicate the measured bare core precession frequency in Fig. 2(b) as a point at .
From Fig. 2(b) it is apparent that the structure and content of the vortex core have a relatively modest effect on precession frequency. One can calculate, for instance, the fluid rotation rate at the inner core radius. The value of is given by the quantized azimuthal superfluid velocity evaluated at the radius of the core, divided by the circumferential length at that radius. For the bare-core vortex (the triangle in Fig. 2(b)) is about 260 Hz, while for the largest filled cores of Fig. 2(b) (for which nearly half of the sample mass is composed of core filling), is only about 1.7 Hz. Thus between vortices whose inner-radius fluid rotation rates vary by a factor of 150, we see only a factor of 2 difference in precession frequency.
The slower precession of filled cores can be understood in terms of our buoyancy picture. Due to its slightly smaller scattering length, fluid has negative buoyancy with respect to fluid, and consequently tends to sink inward towards the center of the condensate [21]. With increasing amounts of material in the core, the inward force on the core begins to counteract the outward buoyancy of the vortex velocity field, resulting in a reduced precession velocity. It is predicted that with a filling material of sufficiently negative buoyancy in the core, the core precession may stop or even precess in a direction
opposite to the direction of the fluid flow [16], but our data do not reach this regime.
Various theoretical techniques involving two- and three-dimensional numerical and analytical analyses have been explored to calculate the precession frequency of a vortex core within a condensate [11, 12, 13, 22]. We briefly compare those most readily applied to our physical parameters, assuming a spherical, single-component condensate with atoms in a non-rotating trap. Where relevant, we assume a core displacement of which is near the center of our measurement range. A two-dimensional hydrodynamic image charge analysis has been analytically explored in the non-interacting [13] and weakly-interacting (Thomas-Fermi) [22] limits. The latter of these predicts a bare core precession frequency of Hz. Svidzinsky and Fetter’s two-dimensional [12] and three-dimensional [23] solution to the Gross-Pitaevskii equation predicts a precession frequency of Hz. Jackson et. al. [11] have obtained results in close agreement with this analytical solution using a numerical solution to the Gross-Pitaevskii equation. Finally, a two-dimensional simulation by McGee and Holland [16] using a steepest-descents technique predicts a precession frequency of 1.2 Hz.
Measurement of for different hold times shows the radial motion of the bare cores and is a probe of energy dissipation of the vortex states. The plot of Fig. 3(c) displays no trend of the core towards the condensate surface during , indicating that thermal damping is negligible on the 1 s timescale [24]. However, a peculiar feature of our bare core measurements is the lack of visible cores in the expanded pictures for hold times of 1 s (Fig. 3(d)). The absence of observed radial motion of the core suggests that the vanishing of the vortex is not due to thermal damping (which would result in the core moving towards and annihilating at the condensate surface). Possible explanations are that the vortex core may tilt or bend along its length [23], suppressing contrast in optical depth below our signal-to-noise threshold.
The hypothesis that the vortices are disappearing due to imaging limitations rather than true decay is supported by an alternative assay for the presence of vortices: It has been predicted that the presence of a vortex will break the degeneracy of the condensate surface modes [25]. We have experimentally verified this prediction [26] and used this technique to verify that the vortex continues to be present in the condensate well after we can no longer image a core in expansion. These measurements will be the topic of a future paper [27].
Through a combination of destructive and nondestructive imaging techniques we have obtained measurements of vortex dynamics in bare- and filled-core vortices in dilute-gas BEC. Vortex precession frequencies show only modest dependence on the radius and content of the vortex core. We plan to extend these studies to investigate higher-order dynamical behavior and to characterize the dissipative effects of finite temperatures.
We gladly acknowledge helpful discussions with Murray Holland and Sarah McGee. This work was supported by funding from NSF, ONR, and NIST.
REFERENCES
- [1] Quantum Physics Division, National Institute of Standards and Technology.
- [2] D. R. Tilley and J. Tilley, Superfluidity and Superconductivity, 3rd ed. (IOP Publishing Ltd, Bristol, 1990); R. Donnelly, Quantized Vortices in Helium II (University Press, Cambridge, 1991).
- [3] D. J. Thouless et al., Int. J. Mod. Phys. B 13, 675 (1999).
- [4] G. A. Swartzlander, Jr. and C. T. Law, Phys. Rev. Lett. 69, 2503 (1992); Y. S. Kivshar et al., Optics Communications 152, 198 (1998).
- [5] M. R. Matthews et al., Phys. Rev. Lett. 83, 2498 (1999).
- [6] K. W. Madison, F. Chevy, W. Wohlleben, and J. Dalibard, Phys. Rev. Lett. 84, 806 (2000).
- [7] D. S. Rokhsar, Phys. Rev. Lett. 79, 2164 (1997).
- [8] D. A. Butts and D. S. Rokhsar, Nature 397, 327 (1999); H. Pu, C. K. Law, J. H. Eberly, and N. P. Bigelow, Phys. Rev. A 59, 1533 (1999); J. J. García-Ripoll and V. M. Pérez-García, Phys. Rev. A 60, 4864 (1999).
- [9] E. L. Bolda and D. F. Walls, Phys. Rev. Lett. 81, 5477 (1998).
- [10] D. V. Skryabin, cond-mat/0003041.
- [11] B. Jackson, J. F. McCann, and C. S. Adams, Phys. Rev. A 61, 013604 (1999).
- [12] A. A. Svidzinsky and A. L. Fetter, cond-mat/9811348.
- [13] P. O. Fedichev and G. V. Shlyapnikov, Phys. Rev. A 60, R1779 (1999).
- [14] J. J. García-Ripoll and V. M. Pérez-García, Phys. Rev. Lett. 84, 4264 (2000); V. M. Pérez-García and J. J. García-Ripoll, cond-mat/9912308.
- [15] J. E. Williams and M. J. Holland, Nature 401, 568 (1999).
- [16] Sarah McGee and Murray Holland, in preparation.
- [17] The core-filling material is removed slowly enough (100 ms) that the vortex core has time to shrink adiabatically to its final bare size, but rapidly enough that the initial location of the bare core is well correlated with the location of the original filled core.
- [18] We use phase-contrast imaging for both the in-trap and expansion images to simplify imaging procedures. When imaging the expanded atom cloud, we obtain good signal when the probe is detuned 3 linewidths from resonance.
- [19] Because of our low trapping frequencies (7.8 Hz), expansions are correspondingly slow. We get larger final spatial distributions by giving the atoms a 6-ms preliminary “squeeze”at high spring constant, followed by a 50-ms expansion period.
- [20] F. Dalfovo and M. Modugno, Phys. Rev. A 61, 023605 (2000).
- [21] Tin-Lun Ho and V. B. Shenoy, Phys. Rev. Lett. 77, 3276 (1996); D. S. Hall et. al., Phys. Rev. Lett. 81, 1539 (1998).
- [22] E. Lundh and P. Ao, cond-mat/9910233.
- [23] A. A. Svidzinsky and A. L. Fetter, poster S36.186, American Physical Society March Meeting 2000, Minneapolis, March 2000.
- [24] Our measurements are performed at temperatures , where is the critical temperature for BEC.
- [25] S. Sinha, Phys. Rev. A 55, 4325 (1997); R. J. Dodd, K. Burnett, M. Edwards, and C. W. Clark, Phys. Rev. A 56, 587 (1997); A. A. Svidzinsky and A. L. Fetter, Phys. Rev. A 58, 3168 (1998); F. Zambelli and S. Stringari, Phys. Rev. Lett. 81, 1754 (1998).
- [26] P. C. Haljan, B. P. Anderson, C. E. Wieman, and E. A. Cornell, abstract QPD1, Quantum Electronics and Laser Science Conference 2000, San Francisco, May 2000.
- [27] P. C. Haljan, B. P. Anderson, C. E. Wieman, and E. A. Cornell, in preparation. See also F. Chevy, K. W. Madison, and J. Dalibard, cond-mat/0005221.