[
Magnitude and Sign Correlations in Heartbeat Fluctuations
Abstract
We propose an approach for analyzing signals with long-range correlations by decomposing the signal increment series into magnitude and sign series and analyzing their scaling properties. We show that signals with identical long-range correlations can exhibit different time organization for the magnitude and sign. We find that the magnitude series relates to the nonlinear properties of the original time series, while the sign series relates to the linear properties. We apply our approach to the heartbeat interval series and find that the magnitude series is long-range correlated, while the sign series is anticorrelated and that both magnitude and sign series may have clinical applications.
pacs:
PACS numbers: 87.10.+e, 87.80.+s, 87.90+y]
A broad class of physical and biological systems exhibits complex dynamics, associated with the presence of many components interacting over a wide range of time or space scales. These often-competing interactions may generate an output signal with fluctuations that appear “noisy” and “erratic” but reveal scale-invariant structure. One general approach to study these systems is to analyze the ways that such fluctuations obey scaling laws [2, 3, 4].
Here, we take into account that the fluctuations in the dynamical output of any system can be characterized by their magnitude (absolute value) and their direction (sign). These two quantities reflect the underlying interactions in a system — the resulting “force” of these interactions at each moment determines the magnitude and the direction of the fluctuations. For an important representative of complex dynamics — human heartbeat intervals — we find unexpected results for the time ordering of the heartbeat interval fluctuations by studying the scaling properties of their magnitude and sign. We also demonstrate that fluctuations following identical long-range correlations can exhibit very different time ordering for the magnitude and sign.
We consider the time series formed by consecutive cardiac interbeat intervals (Fig. 1a) and focus on the correlations in the time increments between consecutive beats. This time series is of general interest, in part because it is the output of a complex integrated control system, including competing stimuli from the neuroautonomic nervous system [5]. These stimuli modulate the rhythmicity of the heart’s intrinsic pacemaker, leading to complex fluctuations. Previous reports indicate that these fluctuations exhibit scale-invariant properties, and are anticorrelated over a broad range of time scales (i.e., the power spectrum follows a power-law where the amplitudes of the higher frequencies are dominant) [6, 7].
The time series of the fluctuations in heartbeat intervals can be “decomposed” into two different time series. We analyze separately the time series formed by the magnitude and the sign of the increments in the time intervals between successive heartbeats (Fig. 1b,c). We use 2nd order detrended fluctuation analysis [7] (and not the conventional power spectrum) since it has the ability to accurately estimate correlations in the heartbeat fluctuations even when they are masked by linear trends [8]. We find for each subject in a group of 18 healthy individuals [9], that the time series of the magnitudes exhibits correlated behavior (Fig. 2b) (unlike the original
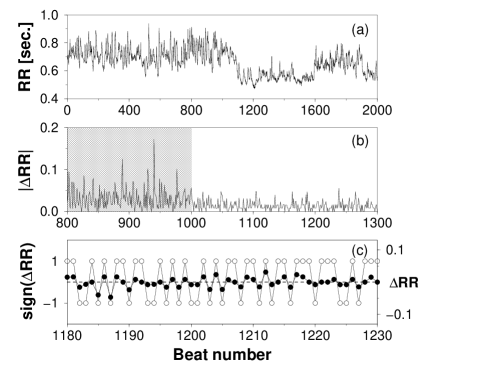
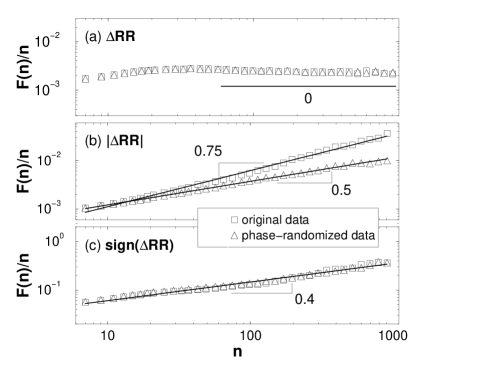
heartbeat increment time series, which is anticorrelated, Fig. 2a). The sign series, however, exhibits anticorrelated behavior (Fig. 2c) [10]. Correlation in the magnitude series indicates that an increment with large magnitude is more likely to be followed by an increment with large magnitude. Anticorrelation in the sign series indicates that a positive increment is more likely to be followed by a negative increment. Our result for the temporal organization of heartbeat fluctuations thus suggests that, under healthy conditions, a large increment in the positive direction is more likely to be followed by a large increment in the negative direction. We find that this empirical “rule” holds over a broad range of time scales from several up to hundreds of beats (Fig. 2) [11].
To show that fluctuations following an identical scaling law can exhibit different time ordering for the magnitude and sign, we perform a Fourier transform on a heartbeat interval increment time series, preserving the amplitudes of the Fourier transform but randomizing the Fourier phases. Then we perform an inverse Fourier transform to create a surrogate series. This procedure eliminates non-linearities, preserving only the linear features (i.e. two-point correlations) of the original time series [12]. The new surrogate series has the same power spectrum as the original heartbeat interval increment time series, with a scaling exponent indicating long-range anticorrelations in the interbeat increments (Fig. 2a). Our analysis of the sign time series derived from this surrogate signal shows scaling behavior almost identical to the one for the sign series from the original data (Fig. 2c). However, the magnitude time series derived from the surrogate (linearized) signal exhibits uncorrelated behavior — a significant change from the strongly correlated behavior observed for the original magnitude series (Fig. 2b). Thus, the increments in the surrogate series do not follow the empirical “rule” observed for the original heartbeat series, although these increments follow a scaling law identical to the original heartbeat increment series. Moreover, our results raise the interesting possibility that the magnitude series carries information about the nonlinear properties of the heartbeat series, while the sign series relates importantly to linear properties.
Next, we investigate the relation between the scaling exponent of the original series and the scaling exponents
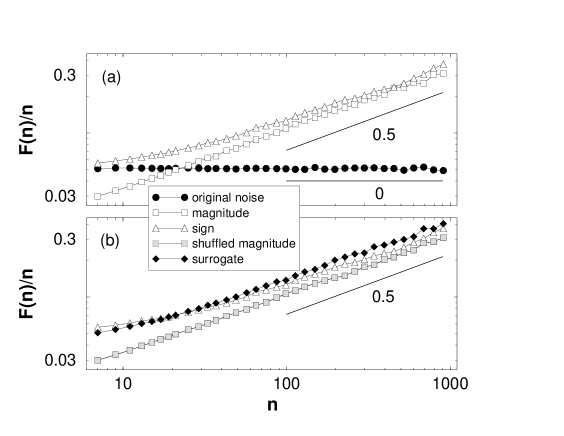
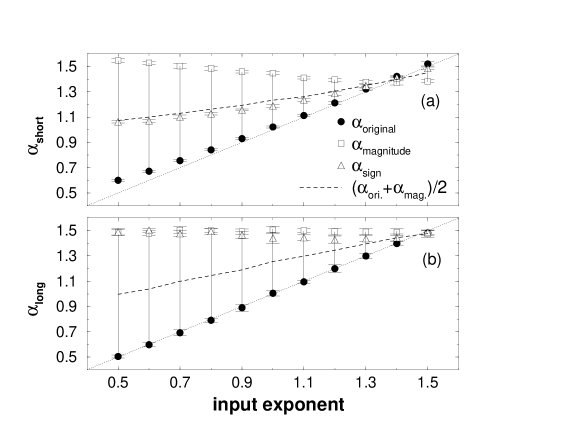
of the magnitude and the sign series. For this purpose, we test our approach on well-defined signals with built-in correlated behavior that show uncorrelated behavior for the magnitude and sign. First, we consider a particular example of correlated noise with scaling exponent equal to 1, for which the increment series is anticorrelated with scaling exponent equal to 0 (Fig. 3a). Surprisingly, at large time scales, we find that the magnitude series and the sign series of the increments exhibit uncorrelated behavior (scaling exponent of 0.5) although the original increment series, which is the multiplication of the elements of these two series, is strongly anticorrelated. Moreover, we find that for linear colored noise with correlation exponent less than 1.5 (i.e., with anticorrelations for the increment series), the magnitude and sign series of the increments are uncorrelated (Fig. 4b). Next, we shuffle the magnitude series by randomly exchanging pairs of elements. After multiplication of the elements of the shuffled magnitude series with the elements of the sign series, we find that the resulting time series is uncorrelated, in contrast to the original increments time series which is strongly anticorrelated. Note that the scaling exponents of the magnitude and sign series remain the same as before the shuffling (Fig. 3b). This test indicates that the correlations in a time series are not related to the correlations in the magnitude and sign series, but rather to the particular pairing of the elements of the magnitude and sign series.
At small time scales, however, we find an empirical approximate relation for the scaling exponents (Fig. 4a), We observe that for the heartbeat series this relation is valid over a larger range of scales (i.e., for time scales ).
| magnitude | |||
| measure | healthy | heart failure | value |
| 0.01 | |||
| 0.13 | |||
| 0.14 | |||
| sign | |||
| measure | healthy | heart failure | value |
| 0.04 | |||
Finally, we test our analysis on a group of 12 subjects with congestive heart failure [9]. Compared to the healthy subjects, the magnitude exhibits weaker correlations with a scaling exponent closer to the exponent of an uncorrelated series. The change in the magnitude exponent for the heart failure subjects is consistent with a previously reported loss of nonlinearity with disease [13, 14]. The sign time series of heart failure subjects shows scaling behavior similar to the one observed in the original time series, but significantly different from the healthy subjects (Table I).
We conclude that series with identical correlation properties can have completely different time ordering which can be characterized by different scaling exponents for the magnitude and sign series. Moreover, we show that the magnitude series carries information regarding the nonlinear properties of the original series while the sign series carries information regarding the linear properties of the original series. The significant decrease in the short-range scaling exponent for the sign series in heart failure may be related to perturbed vagal control affecting relatively high frequency fluctuations. The decrease of the long-range scaling exponent for the magnitude series of the heart failure patients indicates weaker correlations and loss of nonlinearity which may be related to impaired feedback mechanisms of neurohormonal cardiac regulation. Because information obtained by decomposing the original heartbeat time series into magnitude and sign time series likely reflects aspects of neuroautonomic regulation, this type of analysis may help address the challenge of developing realistic models of heart rate control in health and disease.
Partial support was provided by the NIH/National Center for Research Resources (P41 RR13622), the Mathers Charitable Foundation, the National Aeronautics and Space Administration (NASA), the Centers for Disease Control, the Fetzer Institute, and the Israel-USA Binational Science Foundation. We thank two referees for their helpful comments.
REFERENCES
- [1]
- [2] M.F. Shlesinger, Ann. NY Acad. Sci. 504, 214 (1987).
- [3] H. Takayasu, Fractals in the Physical Sciences (Manchester Univ. Press, Manchester, UK, 1997).
- [4] M. Kobayashi and T. Musha, IEEE Trans. Biomed. Eng. 29, 456 (1982).
- [5] R.M. Berne and M.N. Levy, Cardiovascular Physiology, 7th edn (Mosby, St. Louis, 1996).
- [6] By long-range anticorrelations we also mean that the root mean square fluctuations function of the integrated series is proportional to where is the window scale and the scaling exponent is smaller than 0.5. In contrast, for uncorrelated behavior , while for correlated behavior . In the present study we integrate the series before applying the scaling analysis and thus indicates uncorrelated behavior while () indicates correlated (anticorrelated) behavior.
- [7] C.-K. Peng, S.V. Buldyrev, S. Havlin, M. Simons, H.E. Stanley, and A.L. Goldberger, Phys. Rev. E 49, 1685 (1994); C.-K. Peng, S. Havlin, H.E. Stanley, and A.L. Goldberger, Chaos 5, 82 (1995); C.-K. Peng, S. Havlin, J.M. Hausdorff, J.E. Mietus, H.E. Stanley, and A.L. Goldberger, J. Electrocardiol. 28, 59 (1995); Y. Ashkenazy, M. Lewkowicz, J. Levitan, S. Havlin, K. Saermark, H. Moelgaard, P.E. Bloch Thomsen, M. Moller, U. Hintze, and H.V. Huikuri, Europhys. Lett. (in press).
- [8] The 1st order detrended fluctuation analysis (DFA) eliminates constant trends from the original series (or, equivalently, linear trends from the integrated series) [7]; the 2nd order DFA removes linear trends, and the order DFA eliminates polynomial trends of order .
- [9] MIT-BIH Normal Sinus Rhythm Database and BIDMC Congestive Heart Failure Database available at http://www.physionet.org/physiobank/database/#ecg.
- [10] The magnitude/sign decomposition consists of the following steps: (i) given series we create the increment series, ; (ii) we decompose the increment series into a magnitude series () and a sign series (); (iii) to avoid artificial trends we subtract from the magnitude and sign series their average; (iv) because of limitations in the accuracy of the detrended fluctuation analysis method for estimating the scaling exponents of anticorrelated signals (), we integrate the magnitude and sign series; (v) we perform a scaling analysis using 2nd order detrended fluctuation analysis on the integrated magnitude and sign series; (vi) to obtain the scaling exponents for the magnitude and sign series we measure the slope of on a log-log plot, where is the root mean square fluctuation function and is the scale of analysis (in beat numbers).
- [11] Heartbeat increment series were investigated by . Babloyantz and P. Maurer, Phys. Lett. A 221, 43 (1996) and P. Maurer, H.-D. Wang, and A. Babloyantz, Phys. Rev. E 56, 1188 (1997). These studies differ from ours because we investigate, quantitatively, normal heartbeats by evaluating the scaling properties of the magnitude and sign series. In addition, our calculations are based on window scales larger than 6 and up to one thousand heartbeats.
- [12] P.F. Panter, Modulation, Noise, and Spectral Analysis Applied to Information Transmission (New York, New York, 1965). We also applied a test for nonlinearity using the phase randomization procedure described in J. Theiler, S. Eubank, A. Longtin, B. Galdrikian, and D.J. Farmer, Physica (Amsterdam) 58D, 77 (1992), and find that the magnitude scaling exponent drops to 0.5 while the sign scaling exponent remains unchanged.
- [13] J. Kurths, A. Voss, P. Saparin, A. Witt, H.J. Kleiner, N. Wessel, Chaos 5, 88 (1995); A. Voss, N. Wessel, H.J. Kleiner, J. Kurths, R. Dietz, Nonlinear Anal. Theory Methods Appl. 30, 935 (1997).
- [14] G. Sugihara, W. Allan, D. Sobel, and K.D. Allan, Proc. Natl. Acad. Sci. U.S.A. 93, 2608 (1996); P.Ch. Ivanov, L.A.N. Amaral, A.L. Goldberger, S. Havlin, M.G. Rosenblum, Z.R. Struzik, and H.E. Stanley, Nature 399, 461 (1999).