Structure and relaxations in liquid and amorphous Selenium
Abstract
We report a molecular dynamics simulation of selenium, described by a three-body interaction. The temperatures and and the structural properties are in agreement with experiment. The mean nearest neighbor coordination number is 2.1. A small pre-peak at about Å-1 can be explained in terms of void correlations. In the intermediate self-scattering function, i.e. the density fluctuation correlation, classical behavior, - and -regimes, is found. We also observe the plateau in the -regime below . In a second step, we investigated the heterogeneous and/or homogeneous behavior of the relaxations. At both short and long times the relaxations are homogeneous (or weakly heterogeneous). In the intermediate time scale, lowering the temperature increases the heterogeneity. We connect these different domains to the vibrational (ballistic), - and -regimes. We have also shown that the increase in heterogeneity can be understood in terms of relaxations.
pacs:
PACS numbers: 61.20.Lc, 66.10-x, 61.43.Dq, 61.43.FsI Introduction
Although glass is one of the most common materials, the glass transition is still poorly understood. It is a continuous transition in which the viscosity of the glass forming liquid increases from Pa s in the liquid to more than Pa s in the super-cooled state. It is, therefore, easy to understand that very different time scales become important near the glass transition, and different types of relaxations might be observed.
The Mode Coupling Theory (MCT) [1] gives a microscopic picture of this transition. This theory focuses on the density correlation function , the intermediate self-scattering function, and proposes a mechanism of back-flow to explain the increase of the viscosity and/or of the time-scales [2]. One of the most striking results of the MCT is the prediction of a critical temperature below which the system becomes non-ergodic. In other words the system is trapped in a well of the energy landscape. This feature is related to a non-zero value of when . Above , the function shows a short time relaxation, related to the vibrational (often called ballistic) regime, and a long time one, also called -relaxation. Below , a third regime appears, the so-called -regime, which is first seen as a shoulder and saturates at a finite value below .
This non-ergodicity has been seen in many experimental measurements [3, 4, 5, 6] and computer simulations [7, 8, 9, 10] on different types of materials ranging from the fragile polymeric glasses to strong glasses, such as SiO2. In this paper we want to go a step further. Using a model of selenium, we check for the presence of these two or three (depending on the temperature) relaxation steps, and ask the following question. Does each atom have the same probability to relax? If below the system becomes non-ergodic, and is trapped in a well of the energy landscape, are all atoms still equivalent, or are some more (or less) mobile than others? We can reformulate this question and ask whether the relaxations are homogeneous or heterogeneous. According to some authors [11, 12] the relaxations should be more homogeneous, in particular in the -regime, whereas others [13, 14, 15, 16, 17, 18, 19, 20, 21] claim that the relaxations in amorphous or disordered materials are more heterogeneous. The answer therefore does not seem to be obvious.
From the theoretical point of view, simple one-atomic systems such as soft or hard spheres or Lennard-Jones systems would be optimal to study. Unfortunately these simple systems crystallize rapidly at temperatures near the glass transition temperature () and, therefore, can be utilized only for studies in the liquid, well above , or deep in the glassy state, . One possibility to avoid crystallization is to introduce special features in the inter-atomic interaction potential which penalize ordering [22, 23]. The most common approach is to use binary mixtures of atoms. A different approach is to simulate a real mono-atomic glass former, such as selenium, which has been studied extensively in experiment, see the reviews [24, 25]. Se is covalently bound and prefers a coordination number of two. This is reflected in the different crystal structures. The most stable trigonal phase consists of parallel helical chains. Two monoclinic forms are composed of rings of eight atoms. The polymorphs are distinguished by the correlation between neighboring dihedral angles. Depending on this correlation one has either a trans- (chains) or a cis-configuration (rings). The energy difference between the cis- and trans-configuration was estimated as only eV [26]. This low energy difference implies that in glasses both configurations should coexist, which in turn strongly hinders crystallization. From a first-principles molecular dynamics simulation using 64 atoms Hohl and Jones [27] conclude that both amorphous and liquid selenium can be viewed as consisting of branched chains which include rings of different length. The small size prevented quantitative statistics of chain and ring lengths and branching points. The fraction of atoms having twofold coordination varies in the literature between 95% and 71% [27, 28, 29, 30].
To study dynamical properties, larger systems are needed and one has to resort to effective inter-atomic interactions. This immediately leads to the difficulty of simultaneously having to describe the covalent binding in the chains and rings and the van-der-Waals like interaction between the rings, as well as possible branching and bond breaking. One possibility is to disregard the last two, and to use different interactions for atoms in the same chain and in different chains, respectively. Similar to simulations of polymers one then considers a glass or a liquid of chains of a predefined length. This fragmented chain method has been employed both for electronic structure calculations [31] and for classical molecular dynamics simulations [32, 33]. Another possibility is to use a more simple description of the electronic properties, such as tight binding models [28].
We follow a different line. As done before by Stillinger et al. in their study of liquid sulfur [34], we use one effective inter-atomic potential for both, the intra-chain and the inter-chain interactions.
This paper is laid out as follows: in section II we report the details of the simulations, and of the production of the liquid and glassy samples used in the measurements of the different properties reported in this work. Section III is devoted to the determination of the glass transition temperature and the critical temperature . Given these temperatures, we report the evolution of the structure through the glass transition in section IV. In the next section we focus on the relaxations and the intermediate self-scattering function. In section VI we present the tools, used to study the homogeneity or heterogeneity of these relaxations, report the measurements and discuss them. Finally we conclude.
II Simulations
We performed classical molecular dynamics simulations on a system of atoms interacting via a 3-body potential. This potential was built to reproduce the properties of small clusters of selenium and of the trigonal crystalline phase. Details of the potential are given in Ref. [35]. The potential has previously been used to calculate the vibrations [36] and local relaxations in amorphous Se [37]. In these simulations it was shown that both the low frequency resonant vibrations and the local relaxations are centered on groups of ten and more atoms. This finding is in agreement with the interpretation of experiments by the soft potential model [38]. From a Monte Carlo study of liquid Se it was concluded that the model provides a sound basis for the study of both the microscopic and the electronic structure, despite some deficiency in the treatment of the van-der-Waals interaction [39].
During the simulations the pressure was fixed to zero Pa, i.e. we worked with equilibrium structures. In order to keep the pressure constant we used a Parrinello-Rahman algorithm [40, 41]. The temperature was kept constant by rescaling the velocities at each integration step. We checked that the way we control the pressure and temperature influenced neither the dynamics of the system nor the results of our simulations.
The equations of motion were integrated using the velocity Verlet algorithm [42]. Taking care of the stability of the algorithm, we chose the time steps equal to fs in the liquid, fs in the glassy phase and fs for the lowest temperature ( K).
To improve the statistics we used four independent starting configurations to obtain the different samples used in the measurement. These samples were produced as follows: first we equilibrated a liquid at K (above the melting point), and cooled it to K with a quench rate of K/s. At this temperature we let the systems equilibrate during ns and then quenched them to K with the same quench rate. During both quenches we saved configurations at several temperatures and again equilibrated them before using them as input of the measurements. The equilibration times were ns above K, ns between K and K, and ns at K. After the equilibration period several relevant physical quantities were computed.
III Tg and Tc determination
To obtain the relevant temperature scale, we first determined the glass transition temperature . For this we followed the evolution of the volume during the quench process. As the coefficient of volume expansion is higher in the liquid than in the solid phase, one observes a change of slope of the volume curve when the system is quenched through the glass transition.

From Fig. 1 the glass transition temperature is estimated as K. Experimentally is about K [43]. The good agreement between the simulated and experimental values of might seem surprising regarding the high quench rate and the usual discrepancies observed in simulation. However, one should notice that due to the aging over several ns the effective quench rate is lower, K/s.
Another characteristic temperature is the critical temperature given by the Mode Coupling Theory. This temperature can be obtained from the diffusion constant which, according to the MCT, follows a power law [1]. The diffusion constant is related to the atomic mean square displacement by
| (1) |
The diffusion constants obtained, Fig. 2, are in reasonable agreement with experiments on liquid Se [44, 45]. At the higher temperatures can be fitted by an Arrhenius law with an activation energy of eV, in agreement with results from first-principle molecular dynamics simulations [29]. In the inset of Fig. 2 we also show, by a dashed line, the fit by the MCT power law. Due to the correlation between and such a fit can only approximately determine these values.
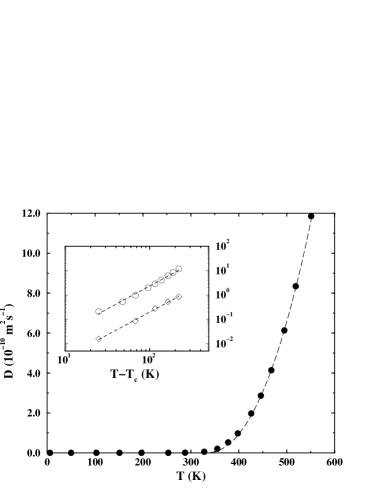
Fixing about 10% above , i.e. K we get . From the same fit to the decay time of the -process, see section V, we obtain for K a value , which is in excellent agreement.
IV Structural properties
Having obtained the relevant temperature scales we now turn to structural properties. First we compute the pair correlation function (PCF) at temperatures ranging from the liquid down into the glass. The PCF is defined by:
| (2) |
where denotes the average over configurations.

Fig. 3 shows the PCF for three different temperatures, K in the liquid phase, K just below and K deep in the glassy phase. The inset shows the mean coordination number. The positions of the peaks do not change strongly upon cooling, but broaden markedly. As usual oscillations at large distances are more strongly damped at high temperatures. The spatial correlations at large distances weaken with increasing temperature. In all cases the correlations are weak for distances greater than Å. The minimum near Å for low temperatures signals that the second neighbor shell becomes more pronounced. The mean coordination number (Fig. 3 inset) indicates the same behavior. The mean nearest neighbor coordination is about at all temperatures, similar to the experimental value[46]. This value of around 2 is the signature of the chains and rings forming the amorphous selenium structure. The small excess of compared to the ideal value of 2 indicates a prevalence of over-coordinated atoms (branching) over under-coordinated ones (chain ends). At the lowest temperature ( K) we also observe a small plateau in the coordination number near Å. The change of neighbor numbers with temperature for larger distances reflects the lower density at high temperatures. This indicates that with increasing temperature the chain structure remains, but the distance between chains increases.
From the PCF the structure factor can be computed by a spatial Fourier transform:
| (3) |
Fig. 4 shows for the three temperatures used in Fig. 3. As in the PCF, the peaks do not shift strongly with temperature, they merely become more damped with increasing temperature. The positions of the peaks agree with experiments [46, 47] and previous simulations on Se [29, 48]. In addition we see a small pre-peak near Å-1. Experimentally the pre-peak in amorphous selenium merges with the first diffraction peak at about Å-1 and is only seen as a shoulder.

To study this pre-peak, we quenched two more sets of 10 independent liquids, each to zero K applying two different pressures: zero pressure and GPa. Finally we minimized the potential energy for both sets, and released the pressure for the second set. This gave us at K two sets of samples with different densities kg/m3 and kg/m3, both with equilibrium structures. The average potential energy per atom of the low density samples is only meV less than the one at the high density. This low value might indicate that at high temperature voids are present in thermodynamic equilibrium. For both sets of equilibrium structures we computed the structure factors by
| (4) |
where are the -vectors compatible with the simulation box. The minimal -values, given by the periodic boundary conditions are Å-1 and Å-1 for the high and the low density samples, respectively.

Whereas the low density samples show a small pre-peak near Å-1, it is absent in those of high density (Fig. 5). Checking the mean coordination number at the two densities (Fig. 6), one sees that the number of first neighbors changes very little with density: there are chains and rings at both densities. The number of second neighbors, however, is reduced for the lower density.

This is the same effect as previously noted for the temperature dependence. When the density is low, i.e. when the volume is high the system is constituted of chains and rings which are further apart from each other. In other words we interpret the pre-peak as the signature of correlations between holes in the structure. A similar effect was seen in simulations of SiO2 [49]. As a consequence of the too high density of the crystalline structure [35], the density of our amorphous selenium is too high in comparison with the experimental value.
V Intermediate self-scattering function
We now focus on the local relaxations. First, we compute the intermediate self-scattering function (ISSF), the correlation function of the density fluctuations,
| (5) |
This can be rewritten as the spatial Fourier transform of the van Hove self correlation function
| (6) |
where is given by [50]:
| (7) |
The ISSF of Se is not easily accessible in experiment. It corresponds to the time Fourier transform of the incoherent dynamic structure factor, but neutron scattering by Se is mainly coherent. Nevertheless this quantity is accessible to simulation.

In Fig. 7 we report the ISSF at Å-1 corresponding to the first diffraction peak of the in Fig. 4. A fast decrease of on the time-scale of a picosecond, is observed at all temperatures. Decreasing the temperature a shoulder appears for intermediate time scales. As the system approaches the glass transition temperature, starts to saturate and finally shows a plateau for intermediate and long times. As customary this curve is described as follows: First there is the ballistic or vibrational regime (corresponding to the fast decreases at low time). Then, for , goes to zero (the so-called -regime). The shoulder or plateau at lower corresponds to the so-called -regime. This plateau indicates that the system is trapped in a limited area of phase-space.
According to the MCT, the -regime above is driven by a master curve which is obtained by rescaling the time by a characteristic decay time, defined as the time when the ISSF has drops to , . Above , similarly to the diffusion constant these values should obey a power law . Fixing K we get a good fit with , see inset in Fig. 2. Using this the master curve can be written in scaled form as [2]:
| (8) |
Fig. 8 presents the curves for temperatures above rescaled by their respective . We get a value for temperatures ranging from K to K. We do not intend to give an elaborate test of the MCT but show the rescaled curves merely to indicate that the rescaling procedure holds approximately.

The most striking effect is the plateau corresponding to the -regime. It indicates that the system falls out of equilibrium, and that atoms are trapped in a well of the energy landscape. This poses the question of whether all the atoms are affected equally or not.
The same question can be asked for the -regime which can be represented by a stretched exponential decay law. Such a law can either mean that a stretched exponential decay law governs the whole system, or it originates from an average of normal exponential laws with different time constants. The first picture is called homogeneous scenario (the system is everywhere the same) and the second one heterogeneous.
VI Heterogeneity or homogeneity ?
To answer this question, we use again the van Hove correlation function (VHF) which represents the probability for an atom to move a distance during a time . If all the atoms have the same mobility the VHF is a Gaussian multiplied by the geometrical factor . In the following this factor is always thought to be included when we speak of Gaussianity. In the opposite case if some atoms are trapped or some are more mobile than the majority the VHF will, in general, be non-Gaussian. As example we show in Fig. 9 the VHF for two different temperatures for the same length range but for two different times. Obviously at high temperatures the system has a higher diffusion constant and the atoms will move faster over a given distance. More striking is that at high temperatures (in the liquid) the VHF has Gaussian shape, whereas at low temperatures (in the glass) the VHF has an extended tail and cannot be described by a Gaussian. Some atoms move over much larger distances than the average atom, i.e. they have a much higher mobility.

In order to quantify these findings, and in accordance with previous work, we introduce the non-Gaussianity parameter (NGP) [51]
| (9) |
where and are the second and fourth moments of the VHF, and , respectively. The NGP is identical to zero for a Gaussian VHF.
Fig. 10 shows, in a log-linear representation, the at different temperatures from the liquid to the glass for a time span covering 6 decades. At very short times the NGP is nearly zero at all temperatures. The limiting behavior for large times is more difficult to observe, especially at low temperatures. Nevertheless the NGP clearly tends to zero. Furthermore, all the curves, below and above the glass transition, scale to the same curve in the short time range as already shown by Kob et al. in their study of a binary super-cooled Lennard-Jones liquid [21]. Our work shows that this property persists in the glassy phase and for a completely different structure.

In the intermediate time range the NGP has a maximum indicating heterogeneity. At high temperatures, in the liquid above , this maximum is small and located around ps. Upon cooling, it slowly moves to higher times. For the temperatures below , the behavior is different. The value of the maximum is larger than 2 and it grows by a factor 2 upon cooling by K. Similarly the position of the maximum shifts by about an order of magnitude for each K. These two observations suggest that as the system is cooled especially below , the non-Gaussianity becomes more and more pronounced at intermediate time scales.

We now focus on the short time behavior at very low temperatures. In Fig. 11, we present the evolution of the NGP for two different samples A and B (out of our 4 different samples) at a very low temperature, K. The inset gives the same curves in linear-linear representation to show them clearly at intermediate times. The curves coincide during the first ps in the vibrational regime. For the larger, intermediate time scale the NGP of sample A (Fig. 11.a) oscillates around a value of 0.2, but the one of sample B (Fig. 11.b) rises. The two other samples behave similarly to sample A. What is the reason of this difference in the non-Gaussian behavior of these two kinds of samples? The evolution of both total energy and volume were equivalent.

The mean square displacements, however, evolve differently (fig. 12). In sample A (Fig. 12.a) it oscillates around a mean value during the entire simulation run, whereas it shows steps for sample B (Fig. 12.b). Thus, while sample A stays in one well of the energy landscape, sample B moves from one well into another. We can identify at least two different wells for sample B. We conclude that the value of the NGP corresponds to the vibrations in the liquid and amorphous selenium. Relaxations from one minimum of the energy landscape to another lead to an increase in the NGP. It has been shown previously that that these local relaxations are collective jumps of 10 and more atoms.[37] The jump length of a single atom is much less than the nearest neighbor distance. The different behavior of the samples, shown in Fig. 12 reflects the low probability for relaxations at low temperature. It is not restricted to Se but is typical for glasses. The same has been reported also from a simulation of simple soft sphere glass [52] and is observed experimentally in the telegraph noise of the electric resistivity of point contacts [53].
VII conclusion
In this article we have presented results of a molecular dynamics simulation on the structure and relaxations of liquid and amorphous Se. We determined the glass transition and critical temperatures, the pair correlation function and the structure factor. From the pair correlation function, and in agreement with experiments, we concluded that both liquid and amorphous selenium are constituted of chains and rings with a mean coordination number of 2.1, slightly above the ideal value 2. Rings and chains are interconnected. The structure factor shows a small pre-peak around Å-1 which in experiment only shows as a shoulder of the main peak. This pre-peak is explained in terms of a correlation of voids between the selenium chains. To prove this assumption we computed the structure factors of two sets of samples with two different densities. At the higher density no pre-peak is observed.
The van Hove correlation function was calculated and utilized to compute the intermediate scattering function and the non-Gaussianity parameter. For the intermediate self-scattering function, the time correlation of the density fluctuation, we find the classical behavior: at short times a rapid decrease corresponding to the ballistic (or vibrational) regime, and at long times a slow decay corresponding to the -regime. When the system reaches a shoulder and below a plateau evolves between these two regimes. This corresponds to the -regime, and to a memory effect of the correlation function, in other words the system falls out of equilibrium.
The non-Gaussianity parameter shows that, both at short and long times, the relaxations are homogeneous or only weakly inhomogeneous and all the atoms are largely equivalent. For the intermediate time range (corresponding to the -regime) NGP depends on the temperature. The lower the temperature the higher the NGP, i.e. the higher the heterogeneity. At low temperatures the increase of non-Gaussianity is due to relaxations. We conclude the following scenario for the heterogeneity: at all temperatures, both above and below , there is a small increase of heterogeneity () due to vibrations at short time, at intermediate times a pronounced increase, due to the relaxations especially at temperatures below , and finally a decrease, due to long range diffusion (flow motion). These different regimes correspond to the different regimes observed in the intermediate self-scattering function . This scenario seems to be common to different materials.
VIII Acknowledgment
We would like to thank C. Oligschleger for her help at the beginning of this work. We also thank M. Kluge, J. Matsui and U. Buchenau for fruitful and exciting discussions. One of us (D. C.) is grateful to the A. von Humboldt foundation for financial support.
REFERENCES
- [1] W. Götze, in Liquids, Freezing and the Glass Transition, edited by J.-P. Hansen, D. Leveque and J. Zinn-Justin (North-Holland, New York, 1991).
- [2] J.-L. Barrat, in Physics of Glasses: structure and dynamics, vol. 489 AIP Conference proceedings, edited by P. Jund and R. Jullien (AIP, Woodbury, 1999).
- [3] F. Mezei, W. Knaak and B. Farago, Phys. Rev. Lett. 58, 571 (1994).
- [4] C. Alba-Simionescu and M. Krauzman, J. Chem. Phys. 102 , 6574 (1995).
- [5] D. Richter, R. Frick, W. Knaak and B. Farago, Phys. Rev. Lett. 61 , 2465 (1988).
- [6] Y. Scheyer, C. Levelut, J. Pelous and D. Durand, Phys. Rev. B 57, 11212 (1998).
- [7] W. Kob and H. C. Andersen, Phys. Rev. E 51, 4134 (1995).
- [8] H. Teichler, Phys. Rev. E 53, 4287 (1996).
- [9] R. Yamamoto and A. Onuki, Phys. Rev. E 58, 3515 (1998).
- [10] F. Affouard and M. Descamps, Phys. Rev. B 59, 9011 (1999).
- [11] A. Arbe and J. Colmenero, Phys. Rev. Lett. 81, 590 (1998).
- [12] J. Colmenero, A. Arbe, A. Alegría, M. Monkenbusch and D. Richter, J. Phys.: Condens Matter 11, A363 (1999).
- [13] M. T. Cicerone, F. R. Blackburn and M. D. Ediger, J. Chem. Phys. 102, 471 (1995).
- [14] G. Williams and J. Fournier, J. Chem. Phys. 104, 5690 (1996).
- [15] R. Zorn, Phys. Rev. B 55, 6249 (1997).
- [16] T. Kanaya, I. Tsukushi and K. Kaji, Prog. Theor. Phys. Suppl. 126, 133 (1997).
- [17] B. Doliwa and A. Heuer, Phys. Rev. Lett. 80, 4915 (1998).
- [18] B. Doliwa and A. Heuer, J. Phys.: Condens. Matter 11, A 277 (1999).
- [19] H. Miyagawa and Y. Hiwatari, Phys. Rev. A 40, 6007 (1989).
- [20] T. Ogadaki and J. Matsui, in Slow Dynamics in Complex Systems, vol. 469 AIP conference proceedings, edited by M. Tokuyama and I. Oppenheim (AIP, Woodburry 1999).
- [21] W. Kob and H.C. Andersen, Phys. Rev. E 51, 4626 (1995).
- [22] M. Dzugutov, Phys. Rev. A 46, 2984 (1992).
- [23] R. DiLeonardo, L. Angelani, G. Parisi, and G. Ruocco, cond-mat/0001311
- [24] P. Andonov, J. Non-Cryst. Sol. 47, 297 (1982).
- [25] B. W. Corb, W. D. Wei and B. L. Averbach, J. Non-Cryst. Sol. 53, 29 (1982).
- [26] M. Misawa and K. Suzuki, J. Phys. Soc. Jap. 44, 1612 (1978).
- [27] D. Hohl and R. O. Jones, Phys. Rev B 43, 3856 (1991).
- [28] C. Bichara, A. Pellegati, and J.-P. Gaspard, Phys. Rev. B 49, 6581 (1994); C. Bichara, J.-Y. Raty and J.-P. Gaspard, J. Non-Cryst. Sol. 250, 419 (1999).
- [29] F. Kirchhoff, M. J. Gillan, J. M. Holender, G. Kresse, and J. Hafner, J. Phys.: Condens. Matter 8, 9353 (1996); F. Kirchhoff, G. Kresse and M. J. Gillan, Phys. Rev. B 57, 10482 (1998).
- [30] F. Shimitsu, H. Kaburaki, T. Oda and Y. Hiwatari, J. Non-Cryst. Sol. 250, 433 (1999).
- [31] T. Yamaguchi, H. Ohtani and F. Yonezawa, J. Non-Cryst. Sol. 250, 437 (1999).
- [32] N. G. Almarza, E. Enciso, and F. J. Bermejo, Europhys. Lett. 17, 595 (1992); M. Garcia-Hernández, B. Fåk, J. L. Martínez, E. Enciso, N. G. Almarza, and A. Criado, Phys. Rev. B 48, 149 (1993); F. J. Bermejo, E. Enciso, A. Criado, J. L. Martínez, and M. Garcia-Hernández, Phys. Rev. B 49, 8689 (1994); F. J. Bermejo, M. Garcia-Hernández, T. Mason, J. L. Martínez, E. Enciso, and A. Criado, Phys. Rev. B 50, 13286 (1994); F. J. Bermejo, M. Garcia-Hernández, F. J. Mompeán, D. MacMorrow, and J. L. Martínez, Phys. Rev. B 51, 11932 (1995).
- [33] S. Balalasubramian, K. V. Damodaran, and K. J. Rao, Chem. Phys. 166, 131 (1992).
- [34] F. H. Stillinger, T. A. Weber, and R. A. LaViolette, J. Chem. Phys. 85, 6460 1986.
- [35] C. Oligschleger, R. O. Jones, S. M. Reimann and H. R. Schober, Phys. Rev. B 53, 6165 (1996).
- [36] C. Oligschleger and H. R. Schober, Physica A 201, 391 (1993); C. Oligschleger and J. C. Schön, J. Phys.: Condens. Matter 9, 1049 (1997).
- [37] C. Oligschleger and H. R. Schober, Solid State Commun. 93, 1031 (1995); H. R. Schober, C. Gaukel, and C. Oligschleger, Prog. Theor. Phys. Suppl. 126, 67 (1997).
- [38] U. Buchenau, Yu. Galperin, V. L. Gurevich, and H. R. Schober, Phys. Rev. B 43, 5039 (1991).
- [39] T. Koslowski, Z. Phys. Chem. 210, 45 (1999).
- [40] M. Parrinello and A. Rahman, Phys. Rev. Lett. 45, 1196 (1980).
- [41] M. Parrinello and A. Rahman, J. Appl. Phys. 52, 7182 (1981).
- [42] W. C. Swope, H. C. Andersen, P. Berens and K. R. Wilson, J. Chem. Phys. 76, 637 (1982).
- [43] U. Buchenau and R. Zorn, Europhys. Lett. 18, 523 (1992).
- [44] W. A. Philips, U. Buchenau, N. Nücker, A.-J. Dianoux and W. Petry, Phys. Rev. Lett. 63, 2381 (1989).
- [45] A. Axmann, W. Gissler, A. Kollmar, and T. Springer, Discuss. Faraday Soc. 50, 74 (1970).
- [46] M. Edeling and W. Freyland, Ber. Bunsenges. Phys. Chem. 85, 1049 (1981).
- [47] K. Tamura and S. Hosokawa, Ber. Bunsenges. Phys. Chem. 96, 681 (1992).
- [48] N. G. Almarza, E. Enciso and F.J. Bermejo, J. Chem. Phys. 99, 6798 (1993).
- [49] S. R. Elliott, J. Non-Cryst. Solids 182, 40 (1995).
- [50] L. van Hove, Phys. Rev. 95, 249 (1954).
- [51] A. Rahman, Phys. Rev. 136, A 405 (1964).
- [52] C. Oligschleger and H. R. Schober, Phys. Rev. B 59, 811 (1999).
- [53] V. I. Kozub and C. Oligschleger, J. Phys.: Condens. Matter 10, 8033 (1998).