Deviations from linear theory for fluctuations below the supercritical primary bifurcation to electroconvection
Abstract
We report measurements of thermally-induced mean-square director-angle fluctuations below primary supercritical bifurcations to electroconvection of the nematic liquid crystals I52 and “Merck Phase V”. For ( is the amplitude of the applied alternating voltage) we find with given by linear theory (LT). Closer to the bifurcation there are deviations from LT with a smaller and with . For I52 measurements as a function of the conductivity of above suggest a tricritical bifurcation at , and increases strongly as is approached from above.
pacs:
05.70.Jk, 05.40.-a, 64.60.Fr, 45.70.QjConvection in fluids is a classical system for the study of pattern formation under nonequilibrium conditions because of its similarity to numerous pattern-forming phenomena in nature [1]. Rayleigh-Bénard convection (RBC) is the most prominent example. Here a horizontal fluid layer, confined at the bottom and top, is heated from below. If the temperature difference exceeds a threshold, the system undergoes a sharp but continuous (supercritical) bifurcation from a uniform state to a state where patterns, e.g., stripes, squares, or spirals, occur [2]. However, already below this bifurcation there exist fluctuations of the temperature field which become “large” near the bifurcation point and which are induced by thermal noise. The fluctuation amplitudes have zero mean but a finite mean-square . For RBC quantitative predictions of were made three decades ago [3, 4, 5, 6] on the basis of linear theory (LT) which neglects interactions between the fluctuations. Since is extremely small, quantitative experimental verifications could be obtained only much more recently [7, 8].
Closer to the bifurcation, LT should break down because of nonlinear interactions between the fluctuations. In analogy to critical phenomena in equilibrium systems, one then expects a modified “critical” (rather than “mean field”) behavior of the system. For RBC it was predicted by Swift and Hohenberg[6] that the fluctuation interactions should lead to a first-order transition, i.e., to a subcritical bifurcation. Experimentally this interesting phenomenon has been out of reach so far because under most circumstances it is expected to become noticeable only within a few parts per million of the bifurcation point [6, 9].
A more favorable system to study the influence of thermal noise in pattern-forming systems is electroconvection (EC) in a nematic liquid crystal (NLC) [10]. Here an alternating voltage of amplitude is applied to a cell filled with NLC. The role of the temperature difference is now taken by , and EC occurs for . For NLCs the effects of thermal noise are larger than for RBC because of the small elastic constants of the NLC [11]. This already large susceptibility is enhanced even further in EC by the very small thickness of the cell. Indeed, already a decade ago it was possible to visualize the fluctuating convective patches and to measure their amplitudes below onset [12]. Good agreement with LT was found. We do not know of a detailed nonlinear theory for this system. Its critical behavior need not be the same as that of RBC because the anisotropy of the NLC suggests that it may belong to a different universality class. Although one expects the critical region to be wider than for RBC, its study had been beyond experimental resolution heretofore.
We report results for thermally-induced fluctuations of the director angle of the NLCs I52 and “Merck Phase V” (MPV) both far below and very close to the primary supercritical bifurcation. For I52 we measured the mean square , averaged over time as well as over all fluctuating modes of the system as described in [13, 14]. In the case of MPV, however, we measured the time averaged mean square amplitudes of the fluctuations of only the -component of the critical mode of the system, as described in [15]. In agreement with earlier work, [12, 13, 14] our data well below are consistent with () with () as predicted by LT for the multi-mode (single-mode) measurements (here ). The data extrapolate to a mean-field threshold at . However, closer to the bifurcation we find with , a smaller () for the multi-mode (single-mode) measurements, and a shifted threshold . So far as we can tell the bifurcation remains supercritical unlike the prediction for RBC. We suggest that an explanation of this deviation from LT may be found in the nonlinear interactions of the fluctuations. Unfortunately there is as yet no detailed theory for the critical behavior of this system with which our results could be compared.
| mrad | (rad-2) | ||||
|---|---|---|---|---|---|
| 38 | 5.16 | 160.848 | 155.296 | 1.83 | 1.77 |
| 42 | 6.36 | 137.978 | 135.367 | 1.81 | 3.87 |
| 46 | 7.76 | 124.495 | 122.685 | 1.79 | 7.63 |
| 50 | 9.51 | 114.774 | 114.027 | 1.84 | 9.17 |
In the experiments reported here we used samples with planar alignment. The I52 (4-ethyl-2-fluoro-4′-[2-(trans-4-pentylcyclohexyl)ethyl]-biphenyl) was doped with by weight of molecular iodine (I2) and studied in the apparatus and by the cell-assembly techniques of Ref. [14]. The bifurcation to EC is supercritical over a range of the electrical conductivity [16]. Above the bifurcation the pattern consists of chaotic traveling zig and zag modes. The cell had a thickness m. We changed by varying the temperature (see Tab. I) and measured at a frequency of 50 Hz and V. For the experiment we used a frequency of 25 Hz. At each voltage we waited 110 s, and then took 128 images 10 s apart. The combination of cell thickness, I2 concentration, and drive frequency assured that the “worm” state [17] did not occur for . For MPV we used a frequency of 30 Hz and m [18].
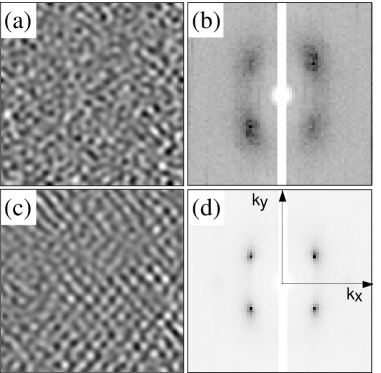
Figure 1 shows two examples of single snapshots for I52 at different and for m-1. Far below onset [Fig. 1(a)] we see patches of patterns with a small correlation length. The patterns are very weak, although dividing by a background image, Fourier filtering, and using the full available greyscale uncovers the expected zig and zag modes. Much closer to onset [Fig. 1(c)] a pattern containing extended patches of zig and zag rolls is found.
For the multi-mode analysis with I52 we closely followed the method of Ref. [14] to extract . We calculated for each image . Here are the coordinates in real space and is a background image obtained by averaging 128 images at the same . For each we derived the structure factor (the square of the modulus of the Fourier transform) and averaged 128 to get , where is the wave vector. Figures 1(b) and (d) are examples. In agreement with Refs. [13, 14, 18] we see two pairs of peaks corresponding to two sets of rolls oriented obliquely to the director which get sharper and larger as we approach the onset of convection. The two modes are called zig and zag modes and correspond to those of the extended chaos above onset [16]. We computed the total power under the peaks of as described in [14], and then converted it to [19] (see also Eq. (5) in [14]).
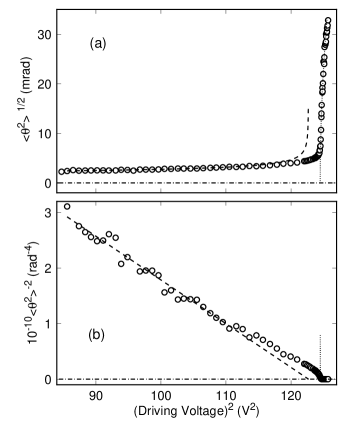
Figure 2(a) shows as a function of for I52 and . It is small for low voltages but then increases sharply above onset. As expected, [16] the primary bifurcation is supercritical in this intermediate region of , and the points above onset follow a square-root law. The square-root fit above onset [dotted line in (a)] extrapolates to at .
In Fig. 2(b) we plotted versus . The data are the same as those in Fig. 2(a). For they can be fitted by a straight line. This is in agreement with LT, which gives . The straight-line fit shown in the linear region of Fig. 2(b) yielded and mrad. The value of is in fairly good agreement with the approximate theoretical estimate mrad (see Ref. [12] and Eq. (6) in [14]). Hence, the measured mean-square director-angle fluctuations are consistent with thermal noise. The mean-field threshold is well below the actual bifurcation point at . A similar, albeit somewhat smaller, shift was found for MPV (see Fig. 3(b) below).
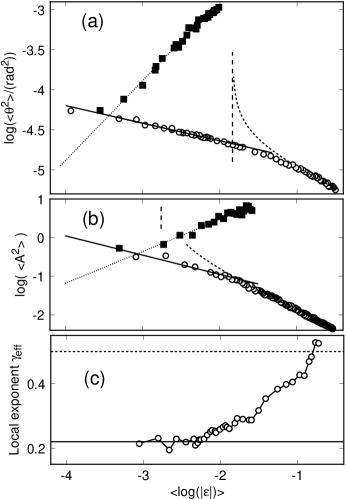
Figure 2(b) reveals that the points close to but below onset deviate from the prediction of LT. Similar deviations were observed over a range of (see Tab. I), as well as for MPV. To illustrate the behavior close to the bifurcation, we plotted versus in Fig. 3(a) for I52 and m-1. For (open circles) the data points far away from (far right of the figure) follow the behavior predicted by LT (short-dashed curve). Note that in a plot where the horizontal axis is this should give a straight line with a slope of -1/2 for the multi-mode analysis used here. The line is curved and diverges at the -value corresponding to . Closer to onset the data points deviate from the linear prediction. We find a crossover to a regime which can be described by a new powerlaw: with . In order to characterize this crossover, we calculated the local exponent from fits to data spanning half a decade of . Figure 3(c) shows that matches the expected in the linear region at large . As we approach the onset of convection, the exponent approaches a plateau of 0.22. Thus we plotted a line in Fig. 3(a) with the slope of -0.22 (straight solid line) and found good agreement with the data over a wide range.
Data for MPV are shown for comparison in Fig. 3(b). As mentioned above, they are based on a single-mode analysis. Far below the bifurcation they yield the expected LT exponent (note that the resolutions of the vertical scales of Figs. 3(a) and (b) differ by a factor of two so that the corresponding slopes look equal). With decreasing there is a crossover to a smaller exponent close to , which is consistent with the crossover from to found from the multimode-analysis for I52.
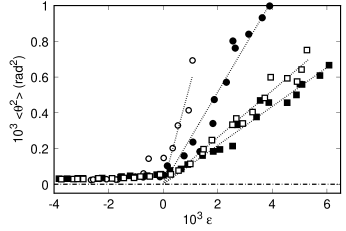
For I52, measurements similar to those discussed above were made at four different conductivities (see Tab. I). Figure 4 shows the results in the vicinity of onset. The data for can be fit by as expected for a supercritical bifurcation. The slope increases as decreases. In Fig. 5 we show (open circles) as a function of . The data suggest that vanishes at m-1. This is consistent with a tricritical bifurcation at , with a transition from a supercritical to a subcritical bifurcation as decreases below . The results for are consistent with recent weakly-nonlinear calculations [20].
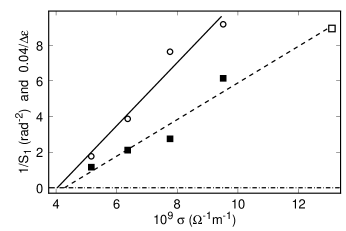
In Fig. 5 we also show where . Here the solid squares are from the present work, and the open square is from [14] [21]. The dashed straight line is a least-squares fit to the data. Within our resolution it passes through zero at , suggesting that the critical region broadens strongly near [22].
In this paper we showed that the fluctuations below onset of electroconvection reveal a crossover as the bifurcation is approached from the behavior predicted by linear theory to a different region characterized by a smaller exponent and a shifted threshold. In analogy to equilibrium phase transitions, we suggest that this phenomenon may be attributable to nonlinear interactions between the fluctuations. Equivalent behavior was found in the two NLCs I52 and MPV, even though we used very different methods of analysis for the two cases.
The work on I52 was done at Santa Barbara and supported by National Science Foundation Grant DMR00-71328. The work on MPV was supported by Deutsche Forschungsgemeinschaft Grant Re-588/6. One of us (MAS) greatfully acknowledges support through a Feodor Lynen Fellowship from the Alexander von Humboldt-Foundation.
REFERENCES
- [1] For a comprehensive review, see M. C. Cross and P.C. Hohenberg, Rev. Mod. Phys. 65, 851 (1993).
- [2] For a review, see E. Bodenschatz, W. Pesch, and G. Ahlers, Annu. Rev. Fluid Mech. 32, 709 (2000).
- [3] V.M. Zaitsev and M.I. Shliomis, Zh. Eksp. Teor. Fiz. 59, 1583 (1970) [Sov. Phys. JETP 32, 866 (1971)].
- [4] R. Graham, Phys. Rev. A 10, 1762 (1974).
- [5] R. Graham, in Fluctuations, Instabilities, and Phase Transitions, edited by T. Riste, NATO Advanced Study Institutes, Ser. B, Vol. 11 (Plenum, NY, 1975).
- [6] J. Swift and P.C. Hohenberg, Phys. Rev. A 15, 319 (1977). See also P.C. Hohenberg and J.B. Swift, Phys. Rev. A 46, 4773 (1992).
- [7] G. Quentin and I. Rehberg, Phys. Rev. Lett. 74, 1578 (1995).
- [8] M. Wu, G. Ahlers, and D.S. Cannell, Phys. Rev. Lett. 75, 1743 (1995).
- [9] The critical region is expected to become wider near a liquid-gas critical point [this was noted also by Assenheimer and V. Steinberg, Europhysics News 27, 143 (1996)] because a small cell spacings can be used and because the Prandtl number becomes large (see Eqs. 2.17 and 3.12c of P.C. Hohenberg and J.B. Swift, in Ref. [6]).
- [10] For a review of pattern formation in liquid crystals, see L. Kramer and W. Pesch, Annu. Rev. Fluid Mech. 27, 515 (1995); and W. Pesch and U. Behn, in Evolution of Spontaneous Structures in Dissipative Continuous Systems, edited by F.H. Busse and S.C. Müller, Lecture Notes in Physics M55 (Springer, NY, 1998).
- [11] The large susceptibility to external noise of NLCs was recognized by R. Graham (see Sect. 4.2 of Ref. [5]).
- [12] I. Rehberg, S. Rasenat, M. de la Torre-Juarez, W. Schöpf, F. Hörner, G. Ahlers, and H.R. Brand, Phys. Rev. Lett. 67, 596 (1991).
- [13] U. Bisang and G. Ahlers, Phys. Rev. Lett. 80, 3062 (1998).
- [14] U. Bisang and G. Ahlers, Phys. Rev. E 60, 3910 (1999).
- [15] I. Rehberg, F. Hörner, L. Chiran, H. Richter, and B.L. Winkler, Phys. Rev. A 44, R7885 (1991).
- [16] M. Dennin, G. Ahlers, and D. S. Cannell, Science 272, 388 (1996); M. Dennin, D.S. Cannell, and G. Ahlers, Phys. Rev. E 57, 638 (1998).
- [17] M. Dennin, G. Ahlers, and D. S. Cannell, Phys. Rev. Lett. 77, 2475 (1996).
- [18] F.-D. Hörner, Ph.D. Thesis, Universität Bayreuth, Bayreuth, Germany, 1996 (unpublished).
- [19] S. Rasenat, G. Hartung, B.L. Winkler and I. Rehberg, Experiments in Fluids 7, 412 (1989).
- [20] M. Treiber and L. Kramer, Phys. Rev. E 58, 1977 (1998).
- [21] We re-analyzed the data in Fig. 4 of Ref. [14] by fitting those for to a straight line. This gave and .
- [22] We note that such a broadening could possibly be caused by a strong increase of with decreasing , i.e., with a strongly decreasing angle between the experimental path of constant and the bifurcation line. However, the data for given in Tab. I show that remains finite near , indicating that path renormalization is unlikely to be responsible for the strong increase of and at .