Ageing of Natural Rubber under Stress
Abstract
We report a dynamical-mechanical study of stress relaxation at small deformation in a natural (polyisoprene) rubber well above its glass transition temperature . We find that an almost complete relaxation of stress takes place over very long relaxation periods, even though the elastic network is retained. The relaxation rate and the long-time equilibrium modulus are sensitive functions of temperature which do not follow time-temperature superposition. Many characteristic features of non-ergodic ageing response are apparent at both short and very long times. We interpret the observed behaviour in terms of the nature of rubber crosslinks, capable of isomerisation under stress, and relate the results to recent models of slow glassy rheology.
pacs:
61.41.+ePolymers, elastomers and plastics. and 62.40.+iAnelasticity, internal friction. and 83.50.ByTransient deformations; stress relaxation, creep, recovery.1 Introduction
Physical ageing, defined as a dependence of linear response functions on the time passed since the system was prepared, is a characteristic feature of non-equilibrium glassy dynamics and a subject of much current attention from all areas of theoretical and experimental condensed matter physics. Polymers and rubbers are also expected to fall into this class of non-equilibrium fluctuation-dissipation behaviour when at temperatures below their glass transition, . However, above , polymers and their networks are expected to be capable of reaching equilibrium and not to exhibit such ageing effects.
Uncrosslinked polymeric materials exhibit a complex behaviour on deformation, being able to flow like a liquid, or responding elastically, like a solid, depending upon the time scale of the deformation relative to the dynamics of the molecules. This duality of mechanical response is called viscoelastically and is a subject of a great number of classical studies doi ; mcrum . In contrast, rubbers or elastomers are unable to flow because the polymer molecules are permanently connected or crosslinked into a percolating network. Elastomers are normally defined in terms of their ability to support a stress indefinitely on extension and to recover their original shape once the deforming influence has been removed. This behaviour can be expressed in terms of a linear rubber elastic modulus, , the ratio of the applied stress to the strain as the frequency of deformation tends to zero so that . In an ideal Gaussian network with the average crosslinking density (or, strictly, the effective density including the effect of topologically permanent entanglements in the network). At sufficiently high frequency the mechanical response of rubbers is not different from that of a corresponding polymer melt, being dominated by dynamic entanglement effects.
Below their glass transition polymeric materials become brittle and exhibit creep behaviour when a stress is applied and the resulting strain measured. In the original study of polymer glasses, Struik struick has demonstrated that polymer glasses exhibit ageing behaviour where the time scale of response is scaled by the waiting time, , measured from the moment the glass was quenched. As expected, above the glass transition polymers did not exhibit ageing behaving, in accordance with laws of equilibrium thermodynamics, although, it was speculated that in the regions surrounding the network cross-links or filler particles, the glass transition temperature could be effectively increased due to the locally higher polymer density and loss of ‘free volume’.
Interest in the fundamental nature of the glass transition has always been high, since this represents one of the few major outstanding challenges in condensed matter physics. The development of models of ‘soft glassy rheology’ (SGR) sgr1 ; sgr2 has renewed the interest in experimental study of mechanical properties in other systems with quenched disorder. The SGR model considers the long-time relaxation of mechanical response in materials where there is the opportunity for random yields and local stress relief when in the deformed state. In an application of the model sgr2 , the elements of the material are capable of ‘hopping’ to a new position allowing local stress relief. This hopping is enhanced under the influence of a strain that adds a directional bias, providing an aspect of flow. On making such a move the elements reconnect in increasingly deeper potential wells, which makes the next hop increasingly difficult. The direct application of such a mechanism are in the rheology of foam or cellular solids. Such models have been demonstrated to exhibit a ‘glass transition’ with the corresponding breaking of time temperature invariance, and ageing phenomena.
In the related systems of ‘spin glasses’, where magnetic spins are trapped in states with glassy orientational correlations, there have been reports of a characteristic temperature dependence of the non-ergodic relaxation behaviour bouchaud . This work, and experiments vincent ; alberici , indicate that at each temperature only specific modes of relaxation contribute to the overall relaxation processes.
In this study we present experimental results on the long time relaxation behaviour of a sample of natural rubber. The data show, unexpectedly, that the stress response to an applied strain can relax to virtually zero, if one waits long enough, even though the short time linear rubber modulus is essentially unchanged. We also have investigated the temperature dependence of the relaxation. The behaviour is interpreted in terms of the models of glassy rheology and spin glasses. We identify the relevant elastomer microstructure, in the form of isomerising sulphur crosslinks, which allows local stress relaxation by ‘hops’ arising from directionally biased breaking and remaking of crosslinks. We argue that such a ‘transient network’ property makes many elastomers non-ergodic even well above their glass transition.
2 Experiment
The step-strain relaxation measurements were made on a custom built stretching device as described elsewhere we . In this device the samples, cut into thin strips approximately mm, were clamped at two ends, and were extended in a step-strain fashion by 5%, measured with a micrometer. The force on the sample was carefully measured as a function of time. The nominal stress was calculated from the sample dimensions prior to extension. The stress relaxation was followed over a period of (typically) 40 days. Some effort was made to carefully control the temperature over such an extended period, with further addition of a temperature controlled environment enclosing the active temperature controller that maintained the samples at a typical working temperature C, with deviations not exceeding C. Polymer melts are well known to exhibit faster relaxation at higher temperatures. An elevated temperature of C allows us to probe longer effective relaxation times than at room temperature and also avoids any effects of strain induced crystallisation. This particular working temperature was selected as being well above the glass transition temperature but avoiding thermal decomposition. There was no attempt to control humidity.
The stress values were obtained in arbitrary units and converted to (Pa) by calibration with weights. Although the stress-measuring device (Pioden Controls Ltd) was specially temperature compensated, calibrations were performed over a range of temperatures. Data will be presented as engineering strain (, where is the unstretched length and the extended length) and nominal stress (, equal to the measured force divided by the original cross-section of the sample).
The samples of polyisoprene natural rubber were taken from a commercial product. These samples were characterised by controlled thermal decomposition and NMR, and by swelling in dichloromethane with subsequent gel fraction measurements. The experimentally determined gel fraction was 94%. Natural rubbers are complex mixtures of biological components which will include proteins and other chemical impurities not directly attached to the stress-supporting network. The loss of some of these elements could easily account for this small weight loss during swelling. Natural rubbers can be crosslinked in a number of ways but the most common vulcanisation approach employs polysulphur crosslinks formed by reacting the polymer, essentially poly(cis-isoprene), with sulphur, zinc oxide and an accelerator at elevated temperatures (e.g. C) morrison . To ensure that there were no artifacts from chemical decomposition or further crosslinking at the elevated temperatures of our experiments, the samples were pre-conditioned by long annealing at C before the experiments. The gel fractions determined after such pre-conditioning were unchanged, within experimental error. All samples were taken from adjacent parts of the same rubber sheet and fresh samples were used for each experiment to maintain a controlled and similar thermal and mechanical history.
It was convenient in these studies to compare the behaviour of the natural rubber crosslinked with sulphur with another elastomer crosslinked with more stable carbon-carbon and carbon-oxygen covalent bonds. In this respect we prepared a weakly photocrosslinked polyacrylate consisting of steryl acrylate, 0.3% w/w crosslinks of ethane 1,2 diol, diacrylate, initiated with Ergacure 184 (CIBA). These synthetic samples were sandwiched between two glass slides m apart irradiated for 1hr to ensure complete reaction, and then removed and cut to shape for mechanical experiments.
3 Results
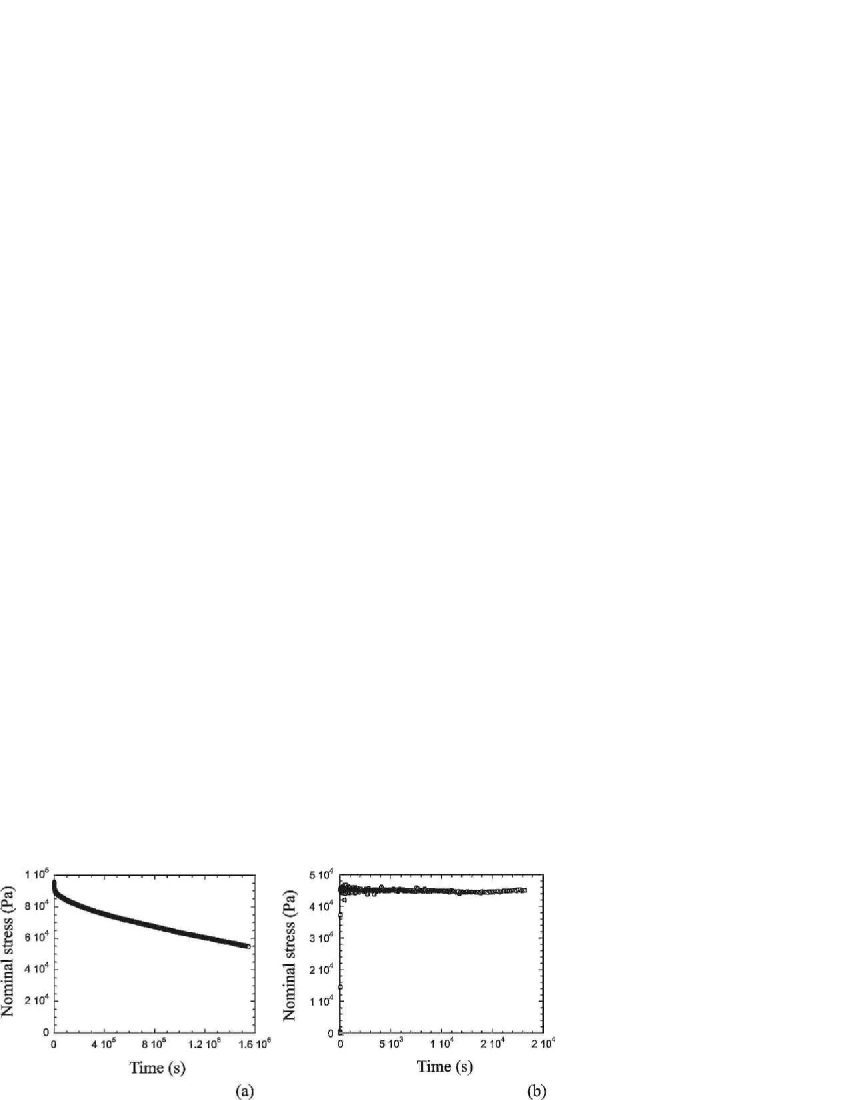
Figure 1(a) shows the typical stress relaxation for the natural rubber after the imposition of a 5% strain at C. The most striking feature of this behaviour is that the stress falls continuously over long periods. In the subsequent discussion we will show that the final stress value can fall to essentially zero if one waits long enough. Clearly, on very long timescales this elastomer is not behaving elastically, but has a viscous response. This behaviour should be compared with Figure 1(b) which presents data from the sample of photocrosslinked polyacrylate under similar thermal and mechanical conditions. These plots show that the stress in the synthetic elastomer remains essentially constant (i.e. equilibrium) over extended periods of time, where the natural rubber is relaxing significantly. This data also provides comfort that the experimental device and environmental conditions are reasonably stable.
A significant loss of elastic resistance in the natural rubber illustrated in Figure 1(a) could arise from the scission of the polymer chains or cross-links of the network. The static linear rubber elastic modulus would be an ideal indicator of effective cross-link density and the possible effects of network degradation. It is impractical to wait infinitely long for and, besides, the whole point of this work is to show that additional physical but irreversible processes take place in some networks. We, therefore, determine the effective linear modulus after relatively short times when we expect to probe the crosslink-dominated network elasticity but not yet come into regime of significant transient flow (see below). The choice of such a time (or, equivalently, the effective frequency) for measurements of has to be made carefully, taking into account the effects of chain entanglements which will dominate at very short times. We considered 1800s (0.5hr) relaxation sufficient to allow rapid dynamic processes to have completed after each small step of strain.
To illustrate the elongation of the sample after a period of stress relaxation we plot in Figure 2(a) the length of the sample in absolute units (mm). The point at which the stress begins to rise significantly is taken as the natural length of the sample. Figure 2(a) presents the short time stress-extension curves for the rubber before and after a step-strain experiment (constant 5% extension) of different duration (0, 5 hrs and 7.5 days). The natural length (the zero-stress length) of the samples clearly increases after the stress relaxation, however, the gradients of the curves are unchanged. This is more clearly illustrated if the -axis is converted from the absolute length of the sample to the units of strain , Figure 2(b). The data are now found to all collapse on the same stress-strain curve. The measured elastic modulus before and after the long stress-relaxation experiment is MPa, essentially unchanged within the experimental error. We conclude that although there has been significant stress relaxation, as in Figure 1(a) corresponding to extension duration of 188hrs, the material has not degraded or significantly altered its elastomeric network integrity. Clearly, there has been a rearrangement of the network resulting in stress relief, but the essential network topology and the number of crosslinks remains constant.
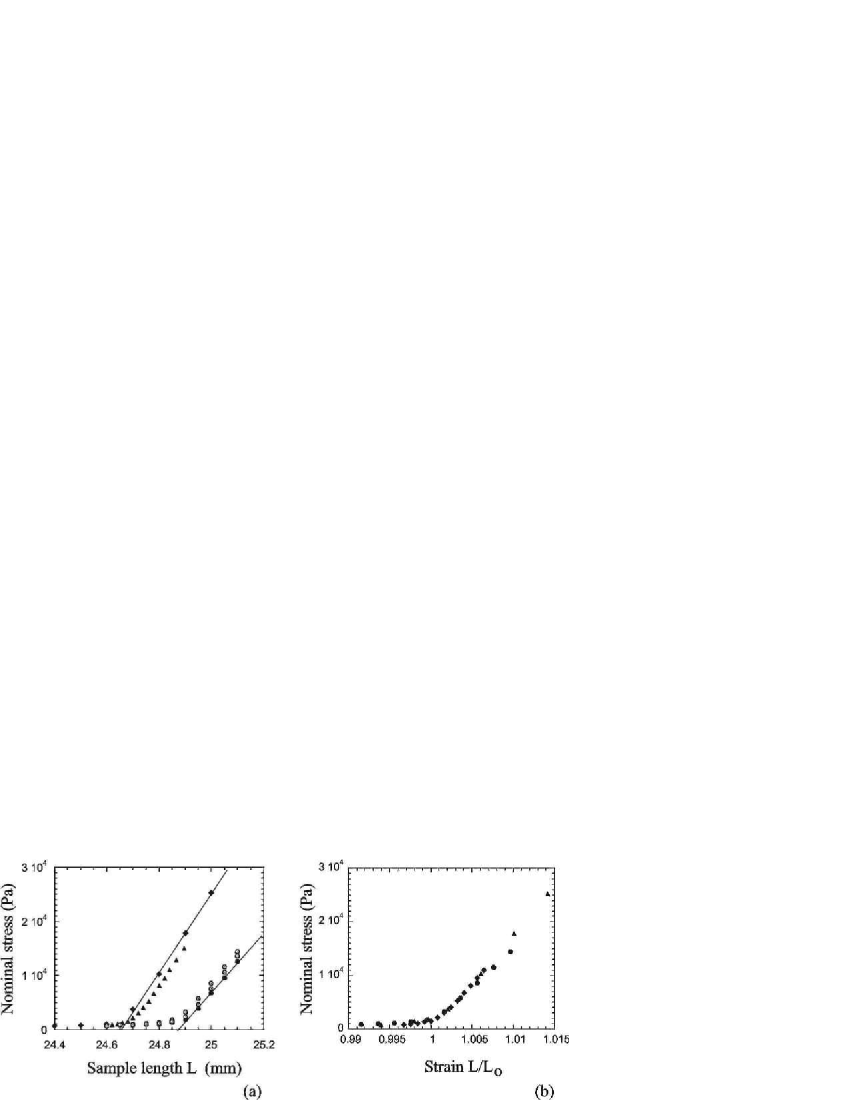
Although the survival of the elastomeric network is unambiguously confirmed by this argument, we also notice the lack of the recovery of original natural length of the sample after prolonged extensions. Complete recovery of the natural length could be discerned in a reasonable time for short periods of stress relaxation. For long periods, such as 188hrs shown by circles in Figure 2(a), partial recovery was evident but it was clearly incomplete. The open circles show the behaviour on the modulus measurement performed 18, 36 and 119hrs after the constant strain step was removed. Clearly, unreasonably long time periods would be required for any significant recovery to be observed and all the evidence suggests that the original length will not be fully recovered.
3.1 Temperature Effects
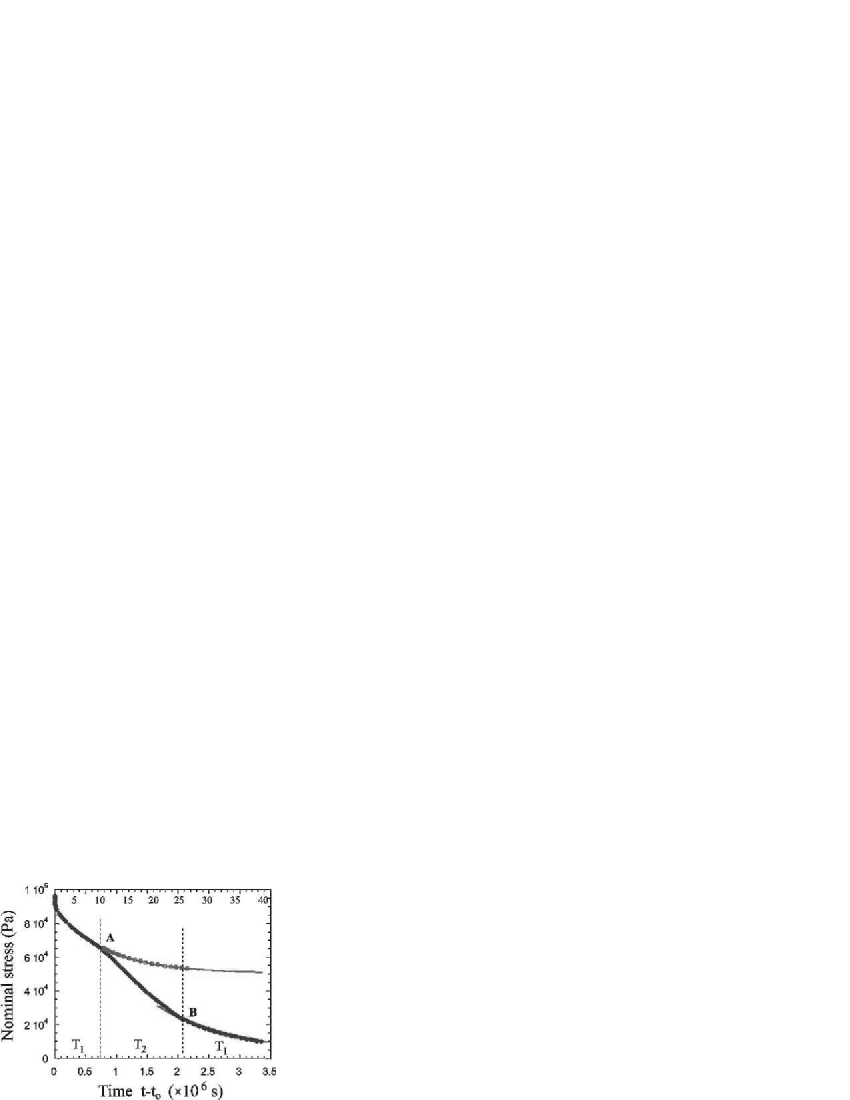
As highlighted above bouchaud , only particular modes of relaxation are accessible at each temperature to magnetic spin glasses. On increasing the temperature, certain modes of relaxation switch off and others switch on, with the reverse on cooling. We have imposed a temperature history to our sample to make a comparison with this model. Initially there is an extended period ( days) of stable relaxation at a temperature (in this case C). After this the temperature was increased to a higher value (e.g. C) and the relaxing stress data was collected for a further 12 days. Finally the temperature is returned to the initial temperature (e.g. C) and the final stages of stress relaxation were monitored. The effect of temperature on the stress response is illustrated in Figure 3. The stress response during the initial period at constant , analogous to that in Figure 1(a), follows a simple exponential law of decay (a variety of fast dynamic processes take place during the first few minutes or even hours after the strain step; the simple exponential decay is the longest apparent mode – the relatively short times are discussed in the next section). The corresponding longest relaxation time days at C, the stress decay represented by the extrapolated solid line in the Figure 3:
| (1) |
(all units in Pa, the argument “1” signifying the first stage of stress relaxation in Figure 3) with the time measured from the moment when the extension has been applied. This fit, when extrapolated to , implies that the residual equilibrium value of stress would be Pa. The equilibrium rubber modulus would then be Mpa, almost a half of that observed during the first hours of stress relaxation.
However, when the temperature increases, the relaxation rate is seen to significantly increase and the extrapolated final stress level decreases. In particular, it appears that the equilibrium value of stress that the system would have reached remaining at constant temperature , according to eq. (1), has been surpassed already.
When, subsequently, the temperature returns to its original value the relaxation resumes with the rate that has been seen in the first stage. This portion of experimental data is fitted by the exponential analogous to the eq. (1) where we assume that the rate and the pre-exponential coefficient take exactly the same values as in (1), but the time is now shifted by the amount – the time rubber has spent in a different regime (at ). In this way one obtains an excellent fit with only one free parameter, the new value of the equilibrium stress level :
| (2) |
with from the Figure 3 and the same as in the eq. (1). As with the fit by , we deliberately extrapolate the plot of eq. (2) outside the experimental data points, to highlight the quality of the fit. Now, it appears, the rubber will end up its relaxation with the effective linear modulus Mpa, more than an order of magnitude lower than in the first day under deformation.
Remarkably, the drop in the equilibrium stress (we obtain now , instead of ) is almost exactly equal to the difference in experimental stress readings between the points A and B in Figure 3(a). In other words, the conclusion appears to be that the modes of relaxation that were active during the -temperature interval are different and independent of the relaxation modes at . The amount of stress the rubber has lost during the high-temperature interval, and the time spent at , are simply subtracted from the data. This point is emphasized in Figure 3 by the following transformation: we take the experimental data points in the third region (the system returned to ) and shift them up in and back in time such that the point B is rejoined with the point A. The experimental points fall onto the extrapolated equation (1) for the whole available period of another 15 days, indicating that the physical processes in the initial relaxation regime and that after the temperature step are exactly the same, as if the temperature rise had not occurred.
Similar effects are observed on increasing the temperature from C by to C and by to C, except the fall in stress during the period at the higher temperature is greater, as one might expect. Again, the stress relaxation after the increment forms a continuous curve with that before the increment. This data indicates that the modes of relaxation and the final equilibration value of are sensitive functions of temperature and also of the sample history, suggesting that the traditional time temperature superposition principle will be invalid here.
Our observation is similar to the behaviour of magnetic susceptibility in spin glasses vincent and dielectric susceptibility in disordered dielectrics alberici (at constant applied strain, we too are measuring the linear response function, the dynamic modulus ). In these experiments the relaxation modes acting at one temperature completely stop when the temperature is rapidly changed to a different value and then re-continue when the temperature is returned to the initial value. The relaxation, as in our case, forms a continuous line following the same time dependence as before the temperature increment but just delayed by the time spent at the higher temperature. This has been shown bouchaud to be an inherent feature of glass-like ageing response.
3.2 Relaxation at relatively short times
The analysis above has focused on the very long times of stress relaxation, on the scale of many hours and days. The model exponential decay , equation (1), describes the data in Figure 3 only after a time of order s ( day). At earlier times, which may be considered ‘a long time’ in a different sort of experiment (with a corresponding frequency range Hz), the deviations are substantial. This deviation reflects the physical processes that take place in the rubbery network if we neglect the longest-time effect of what we expect to be a crosslink isomerisation under stress. Figure 4 (plotted in the log-log format) shows the time dependence during this relatively short initial time period.
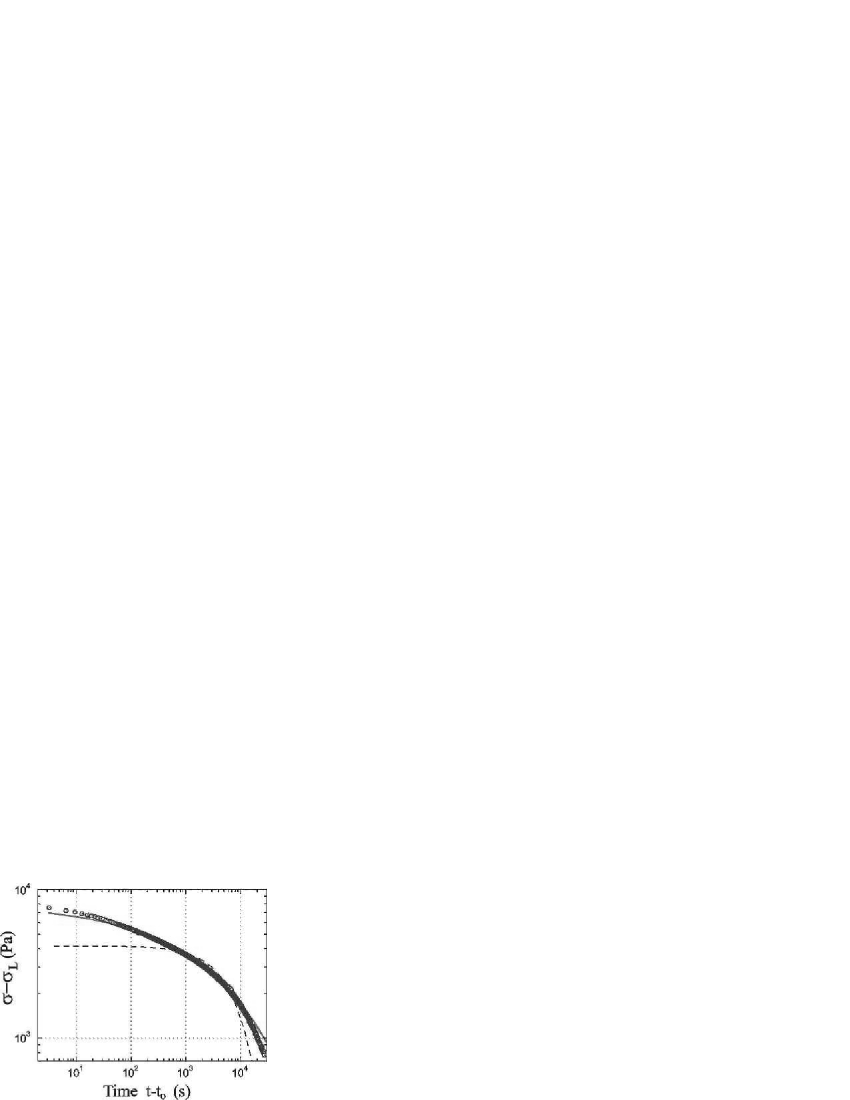
The experimental data points with the subtracted model decay are clearly faster than a power law, but equally evidently slower than a simple exponential. An attempt to fit the data by an exponential law is shown by the dashed line in Figure 4, to contrast with the best fit which is robustly achieved by the stretched exponential with a power , that is
| (3) |
(stress units in Pa) with relaxation time . We do not have an explanation for the observed time dependence, modelled by the eq. (3). The exponent of the stretched exponential relaxation has been known to appear in a number of spin-glass problems, such as the short-time relaxation of average magnetisation after field-quenching the spin glass bouchaud .
In classical studies of rubber relaxation, e.g. of Ferry ferry and of Chasset and Thirion chasset , the time scale of experiments was usually under s – rather like our ‘relatively short time regime’ in Figure 4. Authors reported power-law dependencies of stress, , which has been attributed to the effect of retracting of freely dangling chains on network deformation curro . We study the relaxation over at least an order of magnitude longer time; it is also important to emphasize that Figure 4 plots not the stress itself, but a difference with the slowest mode subtracted.
4 Discussion
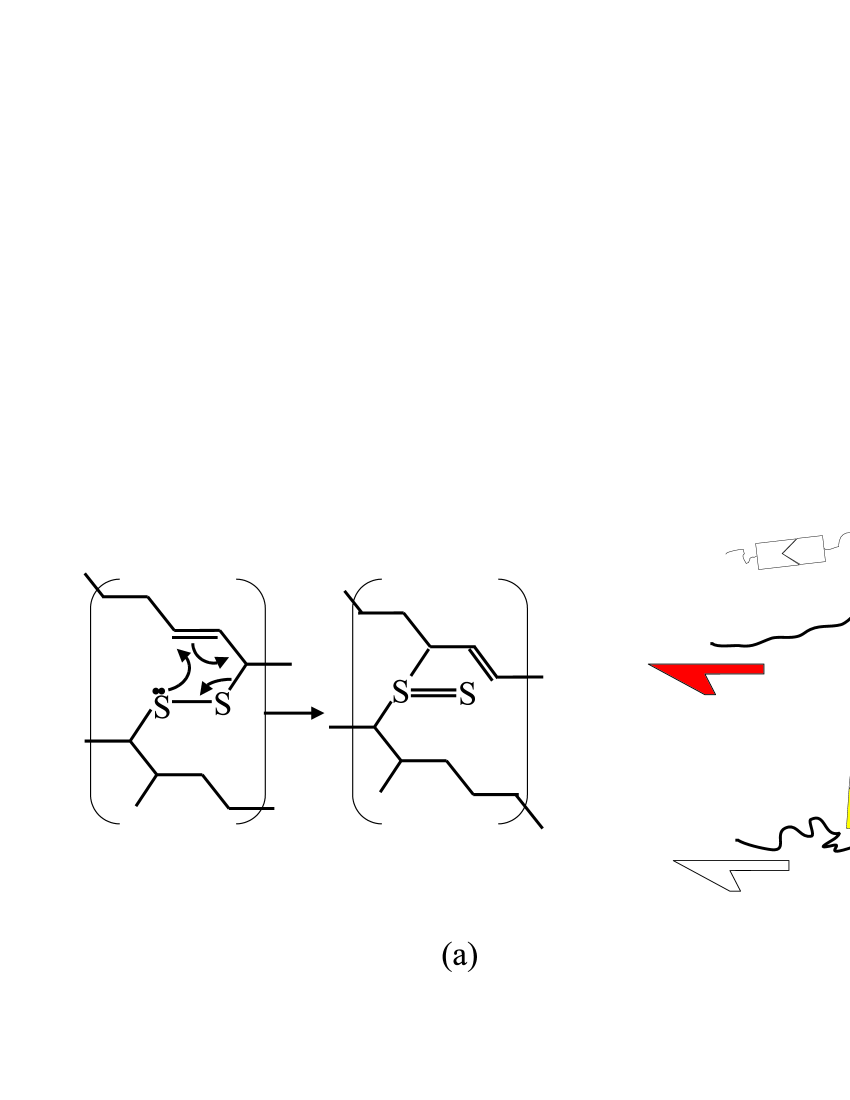
The significant loss of stress response on extending a sample of natural rubber over a long period of time is very surprising, particularly when combined with the fact that the linear rubber modulus before and after such an experiment is almost unchanged. This behaviour is most likely linked to the isomerisation of the sulphur-sulphur bonds that form the crosslinks in this type of material. Sulphur is the most common means of vulcanising rubbers and its isomerisation in natural rubbers has been reported before sulphur . An example of the sulphur-sulphur isomerisation that could lead to the stress relaxation but with retention of the crosslink is illustrated in Figure 5. We note that the two chains are still connected before and after the isomerisation but that the position of the crosslink moves along the chain. This isomerisation is likely to be an activated process with some activation energy , which should crudely determine the rate of relaxation at a given temperature. Bias in the direction of crosslink isomerisation is expected when the sample is under an external strain, leading to local stress relief. This will continue until there is insufficient external strain to allow further ‘hops’ and the ‘natural’ barrier height will again control the kinetics. In this fashion the residual stress level at long time, in an relaxation experiment run at constant temperature, is expected to be related to the barrier height.
The fact that the samples are able to recover their natural length after relatively short periods under strain indicates that the crosslinks are still in their original configuration in the network and pull the material back to its original shape. As the periods of stress relaxation become extended, more and more isomerisation and stress relief events occur and the sample is unlikely to ultimately return to its original shape. When, eventually, the relaxing stress at fixed extension falls to its low saturation value, , we expect that the sample shape will not be recoverable at all. However, at any moment of time, the total number of elastically active crosslinks in the network remains the same and thus the effective rubber modulus measured at different times remains the same too. The measure of the time when the effect of crosslink isomerisation becomes significant should be the same as that discussed in Figure 4 for the decaying difference .
The fact that the (newly measured) linear rubber modulus recovers its value tells that the average number of effective crosslinks in the system remains constant at any given time. This sort of system has been examined theoretically, as the problem of relaxation in a transient network where crosslinks (such as hydrogen bonds) reorganise under stress. Flory flory has presented an intuitive model, later improved by Scanlan scanlan . Fricker and Edwards edwards ; ed2 have developed a statistical-mechanical formalism, with essentially the same conclusion – that, under a constant extension, the stress remaining in the system where the crosslink breaking and re-forming occurs at a rate decays with time as
| (4) |
(the earliest and simplest result by Flory assuming the re-formed crosslinks are not bearing stress and are thus permanent). We could fit our data to this type of model relation equally well, with the same number of (two) free parameters. We chose not to do so because of an obvious discrepancy. According to these models, a definite value of final stress [approximately 37% of the initial stress in eq. (4)] is predicted, with temperature only affecting the rate . In contrast, we find that at a given temperature there appear to be characteristic modes of relaxation and long time stress relief, while different modes become active at a different temperature, thus affecting the final stress . Secondly, when the temperature was returned to a lower value after a period at a higher , as in Figure 3, the local rate of relaxation (the tangent of curve) should be lower than that after the same time in a parallel experiment with no temperature elevation period. Instead, we find unambiguously that the relaxation rate at point B is higher, in fact equal to that at the earlier point A just before the temperature rise, as is illustrated in Figure 3. It appears that different relaxation modes are active at each temperature, in contrast to the thermally activated kinetic effects when all modes are active simultaneously.
The behaviour we observe is rather analogous to the relaxation in spin glasses bouchaud ; vincent where only specific modes are accessible at each temperature. Recent models of soft glassy rheology also highlight similar behaviour to that reported here. The SGR model requires a microscopic mechanism of strain-enhanced relief of stress and a distribution of well depths to exhibit a whole range of glassy, non-ergodic behaviour. Our experimental data clearly indicates that there is such a strain-induced relief of stress. Additionally, because of the variety of sulphur-sulphur links that will be present in the rubber, it is likely that a broad distribution of potential well depths is also present. This behaviour should be contrasted with an elastic network with permanently fixed crosslinks, Figure 1(b) where one finds an essentially equilibrium response as is, in fact, expected in an ideal elastic network above . In general terms, one finds long relaxation and ergodicity breaking above when the elastic degrees of freedom are coupled to an additional randomly quenched field, which frequently arises in materials with microstructure. In SGR, this corresponds to a model distribution of yield events (as may occur in, e.g., a foam when cells reconnect and move past each other sgr2 ). Here in our study of natural rubber, we argue that the isomerisation of sulphur crosslinks provides also provides such an effect and is very close to the SGR model in its spirit.
The stress response fits well to an exponential time dependence
with the longest relaxation time of order 10-15 days. This
contrasts with the earlier reported power-law behaviour, often
attributed to the effect of free chain retraction. Our results are
also in contrast with the reported logarithmic decay of linear
response function for the related process of creep derham .
In the field of rubber technology the rate of relaxation is
usually expressed as the percent per decade pond reflecting
this kind of time dependence. However, unlike the exponential
response we observe, such a logarithmic time dependence gives
unphysical behaviour at long times and so cannot provide physical
insight into the fundamental processes. This highlights the fact
that there are fundamental issues at the heart of rubber
technology left outstanding even after more than 50 years of
research.
The authors wish to thank Prof. Sir Geoffrey Allen, Prof. Sir Sam Edwards, Dr K. Fuller and Dr P. Sollich for interesting discussions.
References
- (1) M. Doi and S. F. Edwards, The Theory of Polymer Dynamics, OUP, Oxford (1986).
- (2) N. G. McCrum, B. E. Read and G. William, Anelastic and Dielectric Effects in Polymeric Solids, Dover Publishers, NY (1967).
- (3) L. C. E. Struik, Physical Ageing in Amorphous Polymers and other Materials, Elsevier (1978).
- (4) P. Sollich, F. Lequeux, P. Hebraud and M. E. Cates, Phys. Rev. Lett. 78 (1997) 2020.
- (5) S. M. Fielding, P. Sollich and M. E. Cates, J. Rheology: to be published (e-print cond-mat/9907101).
- (6) J. P. Bouchaud, L. F. Cuglaindolo, J. Kurchan and M. Mezard, in: Out of Equilibrium Dynamics in Spin Glasses and other Glassy Systems, ed. A. P. Young, World Scientific, Singapoure (1998).
- (7) K. Jonason, E. Vincent, J. Hammann, J. P. Bouchaud and P. Nordblad, Phys. Rev. Lett. 81 (1998) 3243.
- (8) F. Alberici-Kious, J.P. Bouchaud, L.F. Cugliandolo, P. Doussineau and A. Levelut, Phys. Rev. Lett. 81 (1998) 4987.
- (9) S. M. Clarke, E. M. Terentjev, I. Kundler and H. Finkelmann, Macromolecules 31 (1998) 4862.
- (10) N. J. Morrison and M. Porter, in: Comprehensive Polymer Science vol.6, ed. G. Allen, Pergamon Press (1989).
- (11) J. D. Ferry, Viscoelastic Properties of Polymers, Wiley, NY (1980).
- (12) P. Thirion and R. Chasset, Rev. Gen. Caoutchouc 41 (1964) 271.
- (13) J. G. Curro and P. Pincus, Macromolecules 16 (1983) 559.
- (14) A. V. Chapman and M. Porter, in: Natural Rubber Science and Technology, ed. A. D. Roberts, OUP, Oxford (1988).
- (15) P. J. Flory, Trans. Faraday Soc. 56 (1960) 722.
- (16) J. Scanlan, Trans. Faraday Soc. 57 (1961) 839.
- (17) H. S. Fricker, Proc. R. Soc. Lond. A 335 (1973) 289.
- (18) F. Tanaka and S. F. Edwards, Macromolecules 25 (1992) 1516.
- (19) C. J. Derham and A. G. Thomas, Rubber Chemistry and Technology 50 (1977) 830.
- (20) T. J. Pond, J. of Natural Rubber Research 4 (1989) 93.