Microscopic Charge Inhomogeneities in Underdoped La2-xSrxCuO4: Local Structural Evidence
Abstract
We present local structural evidence for the existence of charge inhomogeneities at low temperature in underdoped and optimally doped La2-xSrxCuO4. The inhomogeneities disappear for . The evidence for the charge inhomogeneities comes from an anomalous increase in the in-plane Cu-O bond length distribution in the underdoped samples as well as evidence for CuO6 octahedral tilt inhomogeneities in the intermediate range structure. Preliminary analysis of the temperature dependence of this phenomenon indicates that the inhomogeneities set in at temperatures in the range which depends on doping.
I introduction
One of the most interesting and intensively debated subjects in the field of high-temperature superconductivity is the possibility that the charge distribution in the electronically active CuO2 planes of the cuprates is inhomogeneous. Charge inhomogeneities, in the form of “stripes” of charge in an insulating background, have been observed in closely related insulating materials such as layered nickelates (La2-xAxNiO4+δ, A=Sr,Ba) [1, 2], perovskite manganites[3, 4] and neodymium co-doped La2-xSrxCuO4 [5, 6]. In this latter system, the charge stripes are also seen in weakly superconducting samples[7]. However, the phenomenology suggests that the charge-stripes compete with superconductivity since the most stable stripes (highest charge-ordering temperature) coincide with the lowest superconducting transition temperatures [7, 8]. So what is the great interest in this phenomenon for understanding high-temperature superconductivity?
The interest comes from three directions. First, from a theoretical point of view it is apparent from a number of studies of strongly correlated electron models that an instability towards charge phase separation is an intrinsic property of these systems [9, 10, 11, 12, 13]. It is clearly important to explore the implications of this profound observation. Secondly, despite great effort over a large number of years there is no single theory that adequately explains all of the phenomenology of the high-temperature superconductors. Perhaps a theory which has as an underlying principle an inhomogeneous charge distribution will be more successful. A number of candidates have emerged in recent years [14, 15, 16, 17, 18, 19, 20, 21, 22]. Finally, as a further motivation, there are a number of experimental observations which are rather naturally interpreted in terms of short-range ordered fluctuating (or quasi-static) charge inhomogeneities in superconducting systems [8, 23, 24, 25, 26, 27]. It is clearly necessary to establish beyond doubt whether fluctuating charge stripes exist in the superconducting cuprates and also to characterize their presence as a function of temperature and doping.
What is the most convincing evidence for the presence of static charge-stripes in the cuprates? The seminal result that really changed the way that people think about these materials was the observation of neutron nuclear superlattice peaks in La1.475Nd0.4Sr0.125CuO4 by Tranquada et al. [5]. The data themselves are reproduced in Fig. 1 [6].
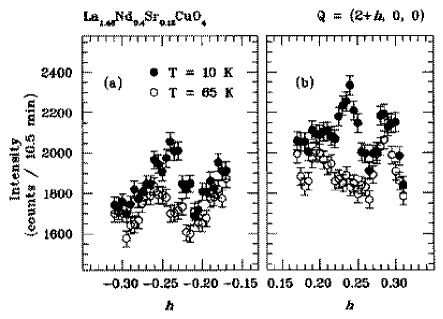
The peaks are small and it took many years (similar Nd doped samples were first studied by Crawford et al. [28] and Büchner et al. [29] as early as 1991), and some clear insight, to find them. However, the argument that they originate from charge ordering is compelling.
What do the superlattice peaks tell us? First, their -dependence ( is the momentum transfer of the scattered neutron) indicate they are nuclear, and not magnetic peaks. Their periodicity and temperature dependence, especially in relation to magnetic superlattice peaks seen in the same material, suggest that they are charge ordering peaks similar to (but different from) those known in the nickelates [1, 2]. The observation of sharp peaks tells us that the charges are fairly long-range ordered in these samples and that they are static or quasi-static. The position in reciprocal space of the peaks suggests the charge-order to be striped. Finally, and most importantly from the point of view of this paper, the peaks originate from a structural distortion. We know this because the neutrons being scattered are uncharged objects and don’t couple to the charges (there is an interaction with the electrons through the spin-spin interaction which gives rise to magnetic scattering; however, it has been established that these charge order peaks are nuclear peaks). The inference is that charges order into static stripes. These stripes locally distort the lattice giving rise to a structural modulation which results in neutron nuclear superlattice peaks. This tells us, beyond doubt, that the static stripes are coupled to the lattice.
What don’t the observed superlattice peaks tell us? The superlattice peaks don’t tell us much about the nature of the structural distortion which gives rise to them. Basic diffraction theory teaches us that the existence and position of Bragg peaks gives basic information about the size and shape of the periodic unit cell. Information about the positions of atoms within the unit cell (and changes in these positions when the charge-stripes form) is contained in the crystallographic structure factor, which gives the relative intensities of all the Bragg peaks. To understand the nature of the distortion, it would be necessary to measure accurately the intensities of a relatively large number of the superlattice (and principal) Bragg peaks. The nature of the structural distortion is of interest because it yields microscopic information about the nature of the electron-lattice interaction giving rise to the structural distortion.
We would like to address two outstanding questions: First, is there any structural evidence for locally fluctuating charge-stripes in superconducting samples in the absence of charge-order superlattice peaks? Second, can we determine the nature of the structural distortion induced by the static (or slowly moving) charge-stripes? Answering the first question requires us to determine some kind of structural order parameter for the existence of charge inhomogeneities: the local structural equivalent of the charge order superlattice peak. Once we have found this, it is clearly important to establish the universality of the behavior among all high-Tc materials if its importance to the phenomenon is to be established.
Since, in general, the charge (and therefore lattice) inhomogeneities are not long-range ordered it is necessary to use a local structural probe. We have used the atomic pair distribution function (PDF) analysis of powder neutron diffraction data. In this technique neutron powder diffraction data are measured with high accuracy over a wide range of using a pulsed-neutron source. The data are corrected for experimental effects such as detector efficiency, absorption, multiple scattering and so on. The data are then normalized with respect to the incident flux and number of scatterers, respectively, to obtain the single-scattering total scattering structure function, . An example of a structure function and the resulting PDF are shown in Fig. 2.

The data reduction process is quite standard and well controlled [30, 31, 32] resulting in highly accurate atomic pair distribution functions. The data were analyzed using the PDFgetN program [33]. The PDF provides a measure of the probability of finding a neighboring atom at a distance from another atom. As with conventional powder diffraction, three dimensional structures can be inferred from these one dimensional functions by regression modeling techniques. When applied to well ordered crystalline materials, results in quantitative agreement with Rietveld refinement are obtained [34, 35] verifying the accuracy of the technique. Because the total scattering, including Bragg and diffuse intensity, is Fourier transformed to obtain the PDF, local structural distortions away from the average structure are also obtained. This has been shown convincingly in recent PDF studies of In1-xGaxAs semiconductor alloys where the average structure (the “virtual crystal” structure) predicts a single In/Ga-As bond length but the PDF clearly resolves a shorter Ga-As and longer In-As bond present in the local structure [36] in agreement with earlier XAFS [37] results. The PDF accurately measures the local and intermediate range structure on the nanometer length-scale. Since it is a neutron powder diffraction measurement, it is also a bulk measurement.
II Search for charge inhomogeneities: Motivation and Approach
It is a universally observed phenomenon in all hole-doped cuprate systems that as the doping in the CuO2 planes is increased, the in-plane Cu-O bonds shorten [38]. This is seen in diffraction measurements as a reduction in the and lattice parameters with increasing doping. This has a simple explanation from the point of view that the energy band at the Fermi-level is a Cu - O anti-bonding band [39]. On doping holes into this band, electron density is being removed from the antibonding states which stabilizes the Cu-O bond resulting in a shorter bond. For example, in La2-xSrxCuO4 the in-plane Cu-O bond shortens from 1.904 Å to 1.882 Å as changes from 0 to 0.2 [38] and the average copper valence changes from to .
This observation has a profound implication if the charges are inhomogeneously distributed in the CuO2 planes; for example, in the presence of charge-stripes. In this scenario, regions of the plane are heavily doped (the stripes) and other regions are undoped (the regions between the charge-rich stripes). Thus, if the charges are inhomogeneously distributed and if the charges are fluctuating slower than the lattice so the lattice can respond to the charge fluctuations, this implies that there will be a distribution of longer and shorter Cu-O bonds coexisting in the structure. The same argument holds whether or not the charge inhomogeneities are striped. A high resolution measurement of the in-plane Cu-O bond length distribution as a function of doping and temperature will therefore reveal the existence, or otherwise, of charge inhomogeneities.
Here we report high real-space resolution measurements of the in-plane Cu-O bond-length distribution as a function of doping and temperature in a series of compounds in the “214” family of cuprates: La2-xAxCuO4 (A=Sr,Ba). We show that the distribution of Cu-O bond lengths changes in a non-monotonic way with doping consistent with the presence of charge inhomogeneities in the underdoped and optimally doped material turning over to a homogeneous charge distribution in the overdoped regime. We also present supporting evidence from the intermediate range structure which is completely consistent with there being a microscopic coexistence of heavily doped and undoped regions of the CuO2 plane in the underdoped, but superconducting, 214 materials. This provides compelling structural evidence for the existence of microscopic charge inhomogeneities in these materials in the underdoped state.
III Experimental
Samples of La2-xSrxCuO4 with , 0.05, 0.10, 0.125, 0.15, 0.20, 0.25, and 0.30 were made using standard solid state synthesis. A sample with Ba replacing Sr with composition was also studied. Sample preparation details are reported elsewhere [40]. Finally, a sample of La1.475Nd0.4Sr0.125CuO4, also made by standard solid-state reaction techniques, was studied. Neutron powder diffraction data as a function of doping were collected at 10 K on the Special Environment Powder Diffractometer (SEPD) at the Intense Pulsed Neutron Source (IPNS) at Argonne National Laboratory. Temperature dependent data were collected on the Nd doped sample from the Glasses, Liquids and Amorphous Diffractometer (GLAD) at IPNS and SEPD and on the Ba doped sample and the Sr doped sample using the High Intensity Powder Diffractometer (HIPD) at the Manuel Lujan Neutron Scattering Center (MLNSC) at Los Alamos National Laboratory. The resolutions and backgrounds of each of these instruments are quite different but they all give qualitatively the same results for the T-dependence of the width of the in-plane Cu-O bond distribution. In each case, approximately 10g of finely powdered sample was sealed in a cylindrical vanadium tube with He exchange gas. The samples were cooled using a closed-cycle He refrigerator. The data were corrected for experimental effects and normalized, using the PDFgetN program [33], to obtain the total structure function . The PDF, , is obtained by a Fourier transform of the data according to . Representative data and PDFs from these samples are shown in Fig. 2.
We are interested in extracting the width of the distribution of in-plane Cu-O bond-lengths. This information is contained in the width of the first PDF peak at Å. The peak width comes from the thermal and zero-point motion of the atoms plus any bond-length distribution originating from charge inhomogeneities. For data collected as a function of doping at constant temperature (10K) we expect the bond-length distribution (PDF peak-width) to be constant or to vary weakly but smoothly with doping if the lattice is softening or hardening. What we actually see are very large changes in the width of the bond-length distribution which are non-monotonically varying with doping. This behavior is straightforwardly explained in the context of charge inhomogeneities as we describe below. Furthermore, we argue that it cannot be explained as originating from other extrinsic effects such as the strain resulting from chemical doping or structural fluctuations coming from nearby structural phase transitions. The temperature dependent data further supports this point of view: the onset of the Cu-O bond-length distribution broadening does not correlate in any way with structural phase transitions in these systems.
IV Results
The squared width of the Cu-O bond-length distribution is plotted as a function of doping in Fig. 3(a)
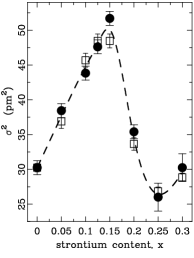
It is apparent in Fig. 3(a) that the increase in the mean-squared bond-length distribution is significant. The effect is large enough that it can be easily seen in the peaks themselves. In Fig. 3(b) the in-plane Cu-O PDF peaks are shown with their centroids lined up for convenient comparison of peak width. The broadening is readily apparent in this figure.
In Ref. [41] we argue in detail that the origin of this behavior cannot be due to extrinsic effects but is readily explained as originating from the presence of local charge inhomogeneities as would be expected in the presence of locally fluctuating charge stripes. We interpret the phenomenology in light of this model below.
The mean-square width of the Cu-O bond length distribution increases monotonically (and almost linearly) with until . Between 0.15 and 0.2 the peak abruptly sharpens and returns to the width of the undoped sample by (Fig. 3(a)). If we assume that in the structurally well-ordered, undoped, endmember La2CuO4 there is a single, well-defined, in-plane Cu-O bond length; then the width of the bond-length distribution due to quantum zero-point motion is given by the width of the measured PDF peak (after deconvoluting the experimental resolution function) for this sample: Å. As the doping level is increased the peak broadens smoothly as evident in Fig. 3. We interpret this as originating from the presence of two distinct Cu-O bonds: a shorter bond coming from more highly doped regions and a longer bond from less highly doped (or undoped) regions of the CuO2 plane. This scenario is consistent with the stripe picture for the cuprates but is also consistent with other forms of charge inhomogeneity. As doping is increased the broadening increases because more short bonds appear. The behavior changes between and where the PDF peak is seen to abruptly sharpen. At the peak width has almost completely returned to its undoped (single bond length) value and at and it remains sharp. This behavior is interpreted as a crossover to a regime where there is a homogeneous charge distribution in the CuO2 planes and the electronic state is becoming more Fermi-liquid like: the charge stripes (or inhomogeneities) have disappeared by . Note that the data were collected at 10 K on samples that are bulk superconductors; i.e., the charge inhomogeneities are observed in the superconducting state. It is also interesting to note that the inhomogeneities and Tc are not anti-correlated as they are for static stripes [8]: the maximum Tc occurs approximately where the inhomogeneities are also at a maximum.
If this picture is correct it has some implications for other features in the intermediate range structure. A coexistence of heavily doped and undoped regions in the CuO2 planes implies a coexistence of large and small CuO6 octahedral tilts: undoped La2-xSrxCuO4 is heavily tilted (5∘ tilts) and heavily doped La2-xSrxCuO4 is untilted. The measured PDF on the intermediate (nanometer) length-scale must be consistent with the presence of tilt inhomogeneities if they exist. We can make a very simple test of this. We have measurements of the PDFs of heavily doped () and undoped () material. Can we explain the PDFs of an intermediate doped compound in the underdoped region as a linear combination of these two PDFs? Figure 4(a)

shows a comparison of the PDF from the data-set with a linear combination of the and the data-sets in a 1:1 ratio. The and PDFs themselves are reproduced in Fig. 4(b) for comparison. They are clearly very different from each other (primarily because of the different CuO6 octahedral tilt amplitudes [40]) yet when mixed they reproduce the data-set very well. Plotted below the PDFs are difference curves. The dotted lines above and below the difference curves are the expected errors due to random counting statistics. The 0.00/0.25 mixture reproduces the data set almost completely within the expected uncertainties. Clearly, the PDF is consistent with the local environment in the CuO2 planes being a mixture of heavily tilted and untilted octahedra.
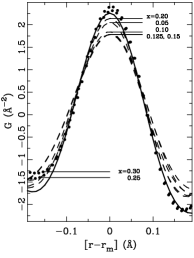
It is also revealing to focus in on the in-plane Cu-O peak in the PDF. This region of the PDF is shown on an expanded scale in Fig. 5.

Reference to Fig. 3(a) indicates that both the and samples have narrow Cu-O nearest neighbor peaks indicative of a single Cu-O bond-length broadened by zero point motion. The positions of these peaks are shifted with respect to each other in these two compositions because of the shortening of the Cu-O bond with doping. This is evident in Fig. 5(a) where the PDFs from the and samples are shown: the peaks are relatively sharp and their centroids are shifted. In Fig. 5(b) it is clear that the broad peak centered on an intermediate position in the sample is well reproduced as a 1:1 linear combination of the two sharp peaks shown in Fig. 5(a). We note that the and PDFs are not scaled or shifted at all when taking the linear combination. Thus, both the position and broadening of the Cu-O bond-length distribution of the sample, shown in Fig. 3(a), are self-consistently explained as a arising from a mixture of heavily and undoped regions in the CuO2 plane.
There is one final piece of evidence supporting the presence of octahedral tilt disorder in these samples. Topological models of the tilts of the corner-shared CuO6 octahedra indicate that in addition to tilt amplitude disorder there will be tilt-directional disorder induced by localized holes [40]. Regions of the plane will be variously untilted, have [110] symmetry tilts (so-called “LTO” tilts), and have [100] symmetry (“LTT”) tilts. This is shown schematically in Fig. 6.
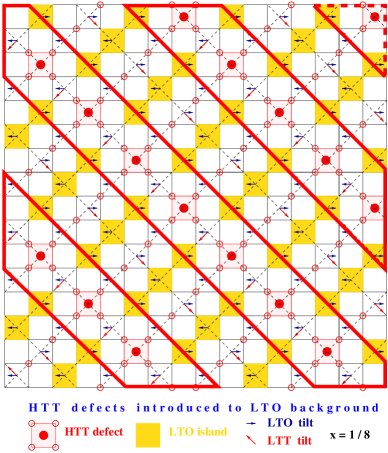
The topological modeling is intended to suggest how octahedral tilts might reorient themselves in the presence of tilt defects. Out-of-plane displacements of in-plane oxygen ions at the shared vertices of neighboring octahedra are considered and the octahedra are assumed to be rigid. A predetermined set of tilt defects is introduced (in this case due to the localized holes arranged in stripes, though this is clearly not the only possibility) and the tilts of neighboring octahedra are determined by the new boundary condition imposed through the shared oxygen due to the tilt of the neighboring octahedron. This approach clearly indicates how the presence of untilted octahedra can introduce LTT-like tilts into the previously LTO tilted background.
There is qualitative evidence in the PDF that this tilt-directional disorder exists in these samples. Figure 7(a) again shows a comparison of the PDF obtained as a linear combination of and data with the PDF of the sample, this time plotted over a wider range of .

The agreement is within the noise except in two regions around nm and nm. Fig 7(b) shows two model PDFs calculated from models with 5∘ tilts of LTT symmetry (open circles) and LTO symmetry (solid line), with the difference curve plotted below. The differences are fairly small, but significant differences are observed around nm and nm which coincides with the largest fluctuations seen in the difference curve of Fig 7(a). This is to be expected if some LTT symmetry tilts are present in the data-set since the tilts in the data-set are purely LTO symmetry [38, 40]. This is highly suggestive, supporting the idea that there is significant disorder with respect to tilt amplitude and direction in underdoped La2-xSrxCuO4, consistent with the presence of charge inhomogeneities.
This observation presents a rather natural explanation for a puzzling result which was reported from an earlier PDF study of La2-xBaxCuO4 [42]. In that letter [42] the local structure of the material was studied as the sample went through the LTO-LTT structural phase transition. No change was observed in the local structure at this transition, even though the average symmetry of the tilts was changing from being tilted along [110] (LTO) to [100] (LTT) directions. This should involve a reorientation of local tilts which was not observed in the data. The long-range order of the tilts was changing at the LTO-LTT structural transition but not the short-range order. It was pointed out that the LTO symmetry could be obtained on average from a linear combination of two different LTT-variants (e.g. [100]+[010]) and it was suggested that the LTO phase may be an inhomogeneous mixture of differently oriented LTT domains. However, it was not clear at that time how, or why, the structure would prefer a disordered tilt phase at low temperature. The existence of electronically driven charge inhomogeneities provides a rather natural explanation of this observation. In light of the current results, we believe that the picture of the LTO phase in the doped materials being a mixture of two LTT variants is too simple. However, a natural explanation comes from the idea of the CuO2 planes being made up of highly inhomogeneous octahedral tilts, including untilted regions and heavily tilted regions with both LTO and LTT type tilts present [40] and stabilized by the presence of charge inhomogeneities; shown schematically in Fig. 6.
Currently we are investigating the temperature dependence of the local structure to see whether the appearance of charge inhomogeneities can be seen as a function of temperature. Preliminary results suggest that there is an onset temperature where the inhomogeneities appear which depends on doping. In Nd-codoped La2-xSrxCuO4 this temperature is close to that where long-range charge order is observed [6]. It is also a comparable temperature (in the range 60-120 K) in La2-xSrxCuO4 and La2-xBaxCuO4 which do not exhibit long-range charge ordering. These results will be reported elsewhere. This temperature is comparable to the temperature scales where NQR wipeout effects [27] and anomalies in XANES [43] and transport measurements [8] are observed.
The result agrees qualitatively with XAFS data of Bianconi et al. [44] which indicates a broadening of the Cu-O bond distribution at low temperature in similar compounds, though our interpretation of the data is quite different from theirs. A similar XAFS study by Niemöller [45] did not find significant evidence for a broadening of the Cu-O correlation though the error bars are not small. These authors place an upper limit on bond length distributions due to doping of 0.06 Å. Their result is therefore not inconsistent with our observation of a bond-length difference of 0.02 Å between the heavily and light doped regions of the CuO2 plane.
There is also an interesting overlap with the observations of anomalous phonon softening in YBa2Cu3O7-δ [46, 47]. In these measurements the Cu-O half-breathing mode shows an unexpected temperature dependence, apparently breaking into two branches at low temperature. Cu-O breathing and half-breathing modes are exactly those that the nearest-neighbor peak in the PDF are the most sensitive to (these modes give relative displacements of Cu and nearest neighbor oxygen atoms in directions parallel to the bond). Splitting of this mode into two branches implies a doubling of the unit cell occurring at low temperature which has been explained within a picture where charge-stripes appear [46, 47] (the canonical static stripes observed by Tranquada et al. [5] led to a unit cell quadrupling). There is also a softening of this half-breathing mode, in the sense that phonon intensity moves to lower frequency at lower temperature [46, 47]. Both these results appear to be in qualitative agreement with the results obtained from this PDF study in the La2-xSrxCuO4 system suggesting that this behavior is somewhat universal.
V conclusions
To summarize, we have presented local structural evidence from neutron diffraction data which strongly supports the idea that doped charge in the CuO2 planes of superconducting La2-xSrxCuO4 for and at 10 K is inhomogeneous. For doping levels of and above the charge distribution in the Cu-O plane becomes homogeneous. This presumably reflects a crossover towards more Fermi-liquid like behavior in the overdoped regime. The inhomogeneities set in at low-temperatures comparable to the charge-ordering temperature in Nd-codoped samples [6] and to the temperature where NQR wipeout effects are observed related to spin freezing [27].
VI acknowledgments
This work was supported financially by NSF through grant DMR-9700966 and by the Sloan Foundation. The experimental data were collected at the IPNS at Argonne National Laboratory, which is funded by the US Department of Energy under Contract W-31-109-ENG-38, and at the MLNSC at Los Alamos National Laboratory which is funded by the department of energy under contract W-7405-ENG-36.
REFERENCES
- [1] J. M. Tranquada, D. J. Buttrey, V. Strachan, and J. E. Lorenzo, Phys. Rev. Lett. 73, 1003 (1994).
- [2] V. Sachan, D. J. Buttrey, J. M. Tranquada, J. E. Lorenzo, and G. Shirane, Phys. Rev. B 51, 12742 (1995).
- [3] C. H. Chen and S.-W. Cheong, Phys. Rev. Lett. 76, 4042 (1996).
- [4] S. Mori, C. H. Chen, and S.-W. Cheong, Nature 392, 473 (1998).
- [5] J. M. Tranquada, B. J. Sternlieb, J. D. Axe, Y. Nakamura, and S. Uchida, Nature 375, 561 (1995).
- [6] J. M. Tranquada, J. D. Axe, N. Ichikawa, Y. Nakamura, S. Uchida, and B. Nachumi, Phys. Rev. B 54, 7489 (1996).
- [7] J. M. Tranquada, J. D. Axe, N. Ichikawa, A. R. Moodenbaugh, Y. Nakamura, and S. Uchida, Phys. Rev. Lett. 78, 338 (1997).
- [8] N. Ichikawa, S. Uchida, J. M. Tranquada, T. Niemöller, P. M. Gehring, S.-H. Lee, and J. R. Schneider, cond-mat/9910037.
- [9] J. Zaanen and O. Gunnarson, Phys. Rev. B 40, 7391 (1989).
- [10] H. J. Schulz, Phys. Rev. Lett. 64, 1445 (1989).
- [11] V. J. Emery and S. A. Kivelson, Physica C 209, 597 (1993).
- [12] S. R. White and D. J. Scalapino, Phys. Rev. Lett. 80, 1272 (1998).
- [13] G. M. Martins, C. Gazza, J. C. Xavier, A. Feiguin, and E. Dagotto, cond-mat/0004316.
- [14] V. J. Emery, S. A. Kivelson, and J. M. Tranquada, Proc. Natl. Acad. Sci. USA 96, 8814 (1999).
- [15] A. Bianconi, A. Valletta, A. Perali, and N. L. Siani, Solid State Commun. 102, 369 (1997).
- [16] C. Castellani, C. Di Castro, M. Grilli, and A. Perali, cond-mat/0001231.
- [17] L. Gor’kov, J. Supercond. 12, 9 (1999).
- [18] Y. N. Ovchinnikov, S. A. Wolf, and V. Kresin, Phys. Rev. B 60, 4329 (1999).
- [19] N. Hasselmann, A. H. Castro Neto, C. M. Smith, and Y. Dimashko, Phys. Rev. Lett. 82, 2135 (1999).
- [20] J. B. Goodenough and J.-S. Zhou, Phys. Rev. B 49, 4251 (1994).
- [21] J. C. Phillips, Philos. Mag. B 79, 527 (1999).
- [22] R. S. Markiewicz, J. Phys. Chem. solids 58, 1179 (1997).
- [23] T. E. Mason, G. Aeppli, and H. Mook, Phys. Rev. Lett. 68, 1414 (1992).
- [24] T. R. Thurston, P. M. Gehring, G. Shirane, R. J. Birgeneau, M. A. Kastner, Y. Endoh, M. Matsuda, K. Yamada, H. Kojima, and I. Tanaka, Phys. Rev. B 46, 9128 (1992).
- [25] K. Yamada, C. H. Lee, K. Kurahashi, J. Wada, S. Wakimoto, S. Ueki, H. Kimura, Y. Endoh, S. Hosoya, G. Shirane, R. J. Birgeneau, M. Greven, M. A. Kastner, and Y. J. Kim, Phys. Rev. B 57, 6165 (1998).
- [26] H. A. Mook, P. Dai, F. Doǧan, and R. D. Hunt, Nature 404, 729 (2000).
- [27] A. W. Hunt, P. M. Singer, K. R. Thurber, and T. Imai, Phys. Rev. Lett. 82, 4300 (1999).
- [28] M. K. Crawford, R. L. Harlow, E. M. McCarron, W. E. Farneth, J. D. Axe, H. Chou, and Q. Huang, Phys. Rev. B 44, 7749 (1991).
- [29] B. Büchner, M. Braden, M. Cramm, W. Schlabitz, W. Schnelle, O. Hoffels, W. Braunisch, R. Müller, G. Heger, and D. Wohlleben, Physica C 185-189, 903 (1991).
- [30] T. Egami and S. J. L. Billinge, Underneath the Bragg Peaks, Plenum, 2000, to be published.
- [31] C. N. J. Wagner, J. Non-Crystalline Solids 31, 1 (1978).
- [32] S. J. L. Billinge and T. Egami, Phys. Rev. B 47, 14386 (1993).
- [33] P. F. Peterson, M. Gutmann, T. Proffen, and S. J. L. Billinge, to be published in J. Appl. Crystallogr. (2000). See also, http://www.pa.msu.edu/cmp/billinge-group/programs/PDFgetN.
- [34] Th. Proffen, R. G. DiFrancesco, S. J. L. Billinge, E. L. Brosha, and G. H. Kwei, Phys. Rev. B 60, 9973 (1999).
- [35] M. Gutmann, S. J. L. Billinge, E. L. Brosha, and G. H. Kwei, Phys. Rev. B 61, 11762 (2000).
- [36] V. Petkov, I-K. Jeong, J. S. Chung, M. F. Thorpe, S. Kycia, and S. J. L. Billinge, Phys. Rev. Lett. 83, 4089 (1999).
- [37] J. C. Mikkelson and J. B. Boyce, Phys. Rev. Lett. 49, 1412 (1982).
- [38] P. G. Radaelli, D. G. Hinks, A. W. Mitchell, B. A. Hunter, J. L. Wagner, B. Dabrowski, K. G. Vandervoort, H. K. Viswanathan, and J. D. Jorgensen, Phys. Rev. B 49, 4163 (1994).
- [39] J. B. Goodenough, Ferroelectrics 130, 77 (1992).
- [40] E. S. Božin, S. J. L. Billinge, G. H. Kwei, and H. Takagi, Phys. Rev. B 59, 4445 (1999).
- [41] E. S. Božin, S. J. L. Billinge, H. Takagi, and G. H. Kwei, Phys. Rev. Lett. (2000), To be published.
- [42] S. J. L. Billinge, G. H. Kwei, and H. Takagi, Phys. Rev. Lett. 72, 2282 (1994).
- [43] A. Lanzara, G. M. Zhao, N. L. Saini, A. Bianconi, K. Conder, H. Keller, and K. A. Müller, J. Phys: Condens. Matter 11, L541 (1999).
- [44] A. Bianconi, N. L. Saini, A. Lanzara, M. Missori, T. Rossetti, H. Oyanagi, H. Yamaguchi, K. Oka, and T. Ito, Phys. Rev. Lett. 76, 3412 (1996).
- [45] T. Niemöller, B. Büchner, M. Cramm, C. Huhnt, L. Tröger, and M. Tischer, Physica C 299, 191 (1998).
- [46] Y. Petrov, T. Egami, R. J. McQueeney, M. Yethiraj, H. A. Mook, and F. Dǒgan, cond-mat/0003414.
- [47] T. Egami, Y. Petrov, and D. Louca, this volume.