Normal Stress Distribution of Rough Surfaces in Contact
Abstract
We study numerically the stress distribution on the interface between two thick elastic media bounded by interfaces that include spatially correlated asperities. The interface roughness is described using the self-affine topography that is observed over a very wide range of scales from fractures to faults. We analyse the correlation properties of the normal stress distribution when the rough surfaces have been brought into full contact. The self affinity of the rough surfaces is described by a Hurst exponent . We find that the normal stress field is also self affine, but with a Hurst exponent . Fluctations of the normal stress are shown to be important, especially at local scales with anti-persistent correlations.
Hansen et al \rightheadStress of Rough Surfaces \journalidGRLMarch 2000 \articleid14 \paperidxxxxxxxx \ccc0000-0000/00/xxxxxxxx$05.00 \cprightAGU2000 \authoraddrG. George Batrouni, Institut Non-Linéaire de Nice, UMR CNRS 6618, Université de Nice–Sophia Antipolis, 1361 Route des Lucioles, F–06560 Valbonne, France \authoraddrAlex Hansen, Department of Physics, Norwegian University of Science and Technology, N–7491 Trondheim, Norway \authoraddrFernando A. de Oliveira, ICCMP, Universidade de Brasília, CP 04513, 70919–970 Brasília–DF, Brazil \authoraddrJean Schmittbuhl, Laboratoire de Géologie, UMR CNRS 8538, Ecole Normale Supérieure, 24, rue Lhomond, F–75231 Paris Cédex 05, France \slugcommentSubmitted to Geophysical Research Letters
Theories describing the elastic properties of two media in contact through rough surfaces have important applications in a wide range of geophysical problems, such as earthquakes, fracture, fluid permeability or rock friction (Scholz, 1990). Asperities exist at all scales: grain roughness is relevant for closure of rock joints (Brown and Scholz, 1986) and seamounts might induce large scale stress fluctuations along subduction slabs (Dmowska et al., 1996). Whatever the scale of the asperities in contact is, when they are attached to an elastic medium and are loaded, they interact and concentrate high stresses. Friction properties of an interface are very dependent on the heterogeneities of the normal stresses (Dieterich and Kilgore, 1996). At fault scale, residual stresses resulting from asperity squeeze might be responsible for heterogeneities of the dynamic stress field and influence the earthquake propagation (Bouchon et al., 1998).
35pc
\figbox*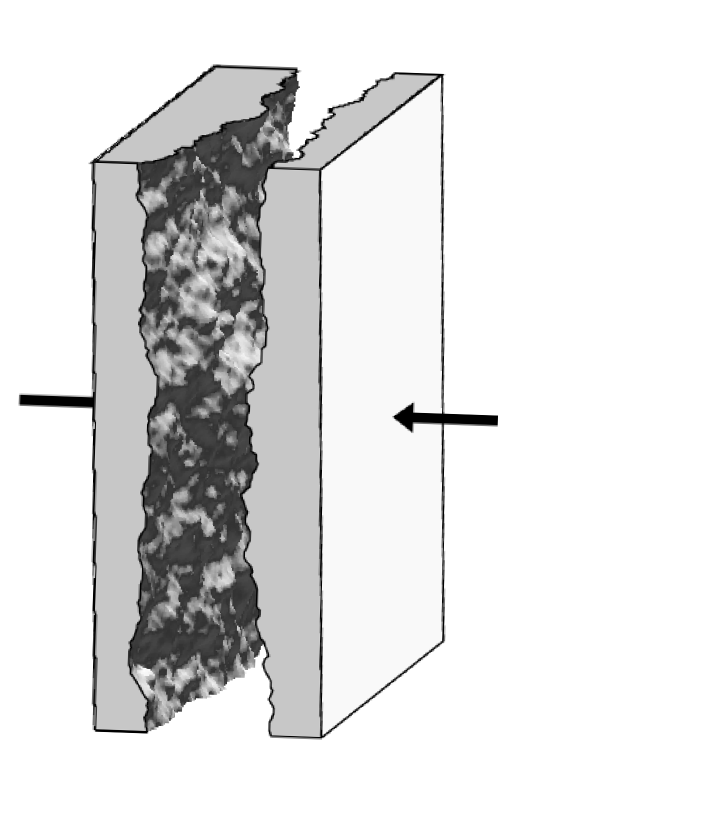
We consider in this letter the normal component of the stress field that appears on the interface between two elastic media with rough surfaces (see Figure 1) (Sayles, 1996). We assume that possible local plastic deformations where the elastic yield stress of asperities is overcome, have a negligible effect on the stress distribution along the interface. The roughness is assumed to be self affine. The surface is described as . Rescaling the two coordinates and , necessitates a rescaling of the height (Feder, 1988). The surface is then self affine with a Hurst exponent . In Figure 1 an example of surfaces with this property is shown.
This surface was obtained from an impact fracturing of a granite block (25cm25cm) (Lòpez and Schmittbuhl, 1998). A wide range of experimental data (Brown and Scholz, 1985a; Power et al., 1987; Bouchaud et al., 1990; Måløy et al., 1992; Schmittbuhl et al., 1995) support the hypothesis that not only are surfaces produced by brittle fracture self affine, but their Hurst exponent generally equals independently of the material (Bouchaud, 1997). We have measured the roughness of the granite block using a profilometer and analysed the spatial correlations of the surface with the average wavelet coefficient technique (Mehrabi et al., 1997; Simonsen et al., 1998). This consists in wavelet transforming each one-dimensional trace using the Daubechie-12 wavelet basis and averaging over the wavelet coefficients at each length scale , where is an integer. If the trace is self affine, the averaged wavelet coefficients scale as
| (1) |
where is an average over the position of the wavelet.
We show in Figure 2 the average wavelet coefficients vs. for the granite surface of Figure 1. The slope of the least-squares fit is , giving .
35pc
\figbox*
Integrating the Lamé equations for an infinite block limited by an infinite plane , gives the Green function for the deformational response in the (vertical) direction at a point in the plane from a distribution of applied forces in the vertical direction:
| (2) |
where (Landau and Lifshitz, 1958)
| (3) |
Here , is the elastic constant and is the Poisson ratio. Deformation also occurs within the -plane when vertical force is applied. However, these fall of as . Consequently, we ignore them compared to the deformation in the vertical direction.
We are interested in rough self-affine surfaces. However, with a Hurst exponent , the surfaces are asymptotically flat. This can be easily seen by calculating the rms fluctuations of the surface, , where is an average over an area of size of the plane . When the surface is self affine, we have leading to as . Thus, it is asymptotically flat. As we are primarily interested in the scaling properties of the normal component of the stress field on large scales, it is a good approximation to use the flat-surface Green function, (3). This approximation also leads to the force component in the vertical direction being directly proportional to the normal stress.
The problem we have set out to study is that of two self-affine rough surfaces in full contact. However, assuming that one of the surfaces is rough and infinitely hard, and the other elastic and initially flat, we find the same normal stress field at the interface as in the original problem within the approximation using the flat-surface Green function, (3) and using the composite topography introduced by Brown and Scholz (1985b) (i.e. the sum of both topographies). We will, therefore, study this second problem since it is easier to implement numerically.
When the two surfaces are in full contact, the deformation field will be equal to minus the local height, , when in-plane deformations are ignored. Thus, the deformation field is self-affine, with a Hurst exponent .
Since Eq. (2) is linear, simple scaling arguments tell us how the force field scales given that is self affine.111If the underlying equations were not linear, much more powerful methods to determine the scaling behavior would be necessary such as functional renormalization (Barabási and Stanley, 1997). If we scale and , Eqs. (2) and (3) immediately gives the scaling relations
| (4) |
with and . Thus, the force field is self affine with a Hurst exponent equal to .
In order to demonstrate the validity of Eq. (4), we solve Eq. (2) numerically for . This is done in Fourier space (using FFTs (Stanley and Kato, 1997)) since the Green function is diagonal there. We start out by defining the Green function on the square lattice as follows. For each node , we define , , , and . The Green function on this lattice is then given by
| (5) |
Thus, the singularity of the Green function is situated at . We have introduced a cutoff in equal to . We choose it to be a quarter of the lattice spacing, i.e., . The reason for introducing the three other radii , , and is that the Fourier transform makes the lattice periodic. The three additional radii signify the mirror image of the singularity resulting from one reflection — we do not introduce further reflections since, with our choice of parameters, their effect is negligible. The deformation field and the Green fuction, were then Fourier transformed, and Eq. (2) solved in Fourier space. The resulting force field was then Fourier transformed back to real space. To within the approximations we have made, the force field is proportional to the normal stress field . We show in Figure 3 the normal stress field corresponding to the full contact of the fracture in Figure 1. The strong small-scale variations in the normal stress distribution are consistent with the observations reported in Mendelsohn et al. (1998).
35pc
\figbox*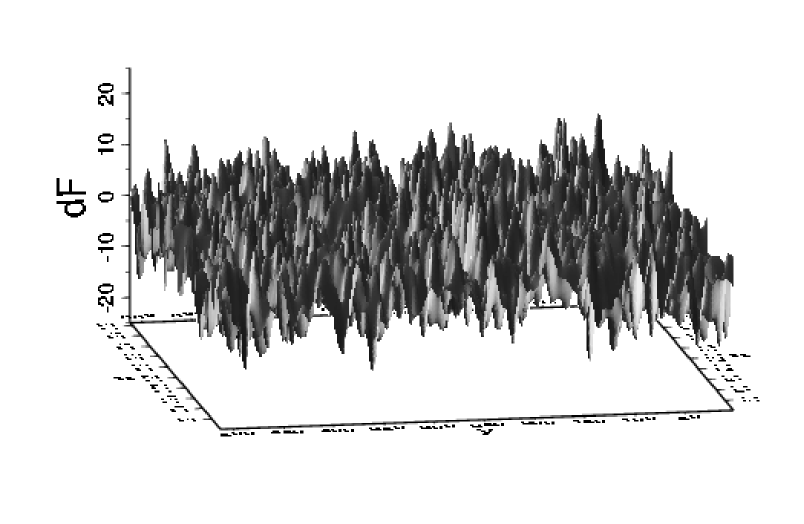
In Figure 2, we show the wavelet analysis of the normal stress field obtained for the granite surface. The least-squares fit gives a slope of corresponding to a Hurst exponent of . Thus, the relation is supported.
In order to study systematically the relation between the Hurst exponent of the deformation field and that of the normal stress field, we have generated artificial self-affine surfaces, using the Fourier method (Sahimi, 1998). This allows us to generate and subsequently average our results over many surfaces for each Hurst exponent, in practice 100 surfaces. After obtaining the stress fields for each surface, we analysed spatial correlations of both the surfaces and the stress fields with two techniques: the average wavelet spectrum of one-dimensional traces obtained by cutting the surface along lines and the two dimensional Fourier spectrum of the full surface. Figure 2 presents the average wavelet spectra of the surfaces and their corresponding stress field for the synthetic fracture surfaces with the same Hurst exponent as the one that is observed for fracture surfaces: . We treated each surface and its corresponding stress field as consisting of 2048 one-dimensional traces, and as there were 100 surfaces, our averages are over one-dimenensional traces. The scaling of the synthetic surfaces is in good agreement with that of the measured surface. Computed full contact stress fields of both types of surfaces are also in good agreement supporting the relation: . The two dimensional Fourier spectrum is computed from the two dimensional Fourier transform of the surface and is expected to scale for self-affine surfaces as (Sahimi, 1998):
| (6) |
We generalize the analysis for different Hurst exponents that describe different spatial correlations between asperities. In Figure 4, we show as a function of for the artificially generated surfaces and analyses with both techniques. The straight line corresponds to
| (7) |
We see that the numerical results and Eq. (7) are in excellent agreement for the two dimensional Fourier spectrum. The agreement is good with the one dimensional technique only for sufficiently large roughness exponents of the rough surface. We emphasize that measurements of low roughness exponent have to be done with two dimensional techniques (Hansen et al., 2000).
The Hurst exponent is directly related to the spatial correlations of the surface. Eq. 6 shows that for: surfaces have a flat spectrum that is are white noise with no spatial correlations of the asperities. When the Hurst exponent increases, relative magnitudes of low frequency modes also increase. Asperities are smoother and the surface roughness appears more and more correlated at large scales. Equation (7) shows that the stress field can be calculated approximately as a simple derivative of the deformation field. Also, fluctations of the stress field are significantly higher than the deformation field.
35pc
\figbox*
We thank H. Nazareno of the ICCMP for the opportunity to perform this work in an excellent and friendly environment. This work was partially funded by the CNRS PICS contract and the Norwegian research council, NFR. We also thank NORDITA for its hospitality.
References
- Barabási and Stanley (1997) Barabási, A., and H. Stanley, Introduction to Fractal Surface Growth. Cambridge University Press, Cambridge, 1997.
- Bouchaud (1997) Bouchaud, E., Scaling properties of cracks, J. Phys.: Condens. Matter, 9, 4319–4344, 1997.
- Bouchaud et al. (1990) Bouchaud, E., G. Lapasset and J. Planès, Fractal dimension of fractured surfaces: a universal value? Europhys. Lett. 13, 73–79, 1990.
- Bouchon et al. (1998) Bouchon, M., M. Campillo, and F. Cotton, Stress field associated with the rupture of the 1992 Landers, California, earthquake and its implications concerning the fault strength at the onset of the earthquake, J. Geophys. Res., 103, 21091–21097, 1998.
- Brown and Scholz (1985a) Brown, S. R., and C. H. Scholz, Broad bandwidth study of the topography of natural rock surfaces, J. Geophys. Res., 90, 12575–12582, 1985a.
- Brown and Scholz (1985b) Brown, S. R., and C. H. Scholz, Closure of random elastic surfaces in contact, J. Geophys. Res., 90, 5531–5545, 1985b.
- Brown and Scholz (1986) Brown, S. R., and C. H. Scholz, Closure of Rock Joints, J. Geophys. Res., 91, 4939–4948, 1986.
- Dieterich and Kilgore (1996) Dieterich, J., and B. Kilgore, Imaging surface contacts: Power law contact distributions and contact stresses in quartz, calcite, glass and acrylic plastic, Tectonophysics, 256, 216–239, 1996.
- Dmowska et al. (1996) Dmowska, R., R. Zheng, and J. Rice, Seismicity and deformation at convergent margins due to heterogeneous coupling, J. Geophys. Res., 101, 3015–3029, 1996.
- Feder (1988) Feder, J., Fractals. Plenum, New York, 1988.
- Hansen et al. (2000) Hansen, Alex, J. Schmittbuhl, and G.G. Batrouni, Distinguishing Fractional and White Noise in One and Two Dimensions, in preparation, 2000.
- Landau and Lifshitz (1958) Landau, L., and E. Lifchitz, Theory of elasticity. Pergamon Press, Oxford, 1958.
- Lòpez and Schmittbuhl (1998) Lòpez, J., and J. Schmittbuhl, Anomalous scaling of fracture surfaces, Phys. Rev. E, 57, 6405–6408, 1998.
- Måløy et al. (1992) Måløy, K. J., A. Hansen, E. L. Hinrichsen and S. Roux, Experimental measurements of the roughness of brittle cracks, Phys. Rev. Lett. 68, 213–215, 1992.
- Mehrabi et al. (1997) Mehrabi, A. R., H. Rassamdana and M. Sahimi, Characterization of long-range correlations in complex distributions and profiles, Phys. Rev. E, 56, 712–722, 1997.
- Mendelsohn et al. (1998) Mendelsohn, D. A., T. S. Gross, R. U. Goulet and M. Zhouc, Experimental–computational estimation of rough fracture surface contact stresses, Materials Sci. and Eng. A249, 1–6, 1998.
- Power et al. (1987) Power, W. L., T. E. Tullis, S. R. Brown, G. N. Boitnott, and C. H. Scholz, Roughness of natural fault surfaces, Geophys. Res. Lett., 14, 29–32, 1987.
- Sahimi (1998) Sahimi, M., Non-linear and non-local transport process in heterogeneous media: from long-range correlated percolation to fracture and material breakdown, Phys. Reports, 306, 213–395, 1998.
- Sayles (1996) Sayles, R. S., Basic principles of rough surface contact analysis using numerical methods, Tribol. Int. 29, 639–650, 1996.
- Schmittbuhl et al. (1995) Schmittbuhl, J., F. Schmitt, and C. H. Scholz, Scaling invariance of crack surfaces, J. Geophys. Res., 100, 5953–5973, 1995.
- Scholz (1990) Scholz, C. H., The mechanics of Earthquakes and faulting. Cambridge Univ. Press, New York, 1990.
- Simonsen et al. (1998) Simonsen, I., A. Hansen, and O. M. Nes, Using wavelet transforms for Hurst exponent determination, Phys. Rev. E, 58, 2779, 1998.
- Stanley and Kato (1997) Stanley, H. M., and T. Kato, An FFT-based method for rough surface contact, ASME Journal of Tribology, 119,481–485, 1997.