[
First-principles study of ferroelectric and antiferrodistortive instabilities in tetragonal SrTiO3
Abstract
We carry out first-principles density-functional calculations of the antiferrodistortive (AFD) and ferroelectric (FE) soft-mode instabilities in tetragonal SrTiO3, with the structural degrees of freedom treated in a classical, zero-temperature framework. In particular, we use frozen-phonon calculations to make a careful study of the anisotropy of the AFD and FE mode frequencies in the tetragonal ground state, in which an -point AFD soft phonon has condensed. Because of the anharmonic couplings, the presence of this AFD distortion substantially affects both the AFD and FE mode frequencies. The AFD mode is found to be softer for rotations around a perpendicular axis ( mode) than for rotations about the tetragonal axis ( mode), in agreement with experimental results. The FE mode, on the other hand, is found to be softer when polarized perpendicular to the tetragonal axis ( mode) than parallel to it ( mode). The sign of this frequency splitting is consistent with the experimentally reported anisotropy of the dielectric susceptibility and other evidence. Finally, we present a discussion of the influence of various types of structural distortions on the FE instability and its anisotropy.
pacs:
PACS numbers: 77.84.Dy, 77.80.Bh, 77.80.-e, 63.20.-e]
I Introduction
First-principles calculations are proving to be one of the most powerful tools for carrying out theoretical studies of the electronic and structural properties of materials. A particularly successful application of this technique has been its use in understanding the perovskite ferroelectric compounds. These materials have important technological applications because of their switchable macroscopic polarization and their piezoelectric properties. They are also attractive objects of fundamental study because of the rich variety of phase diagrams that they display as a function of temperature. At high temperature, the ABO3 perovskites retain full cubic symmetry. However various structural phase transitions take place as the temperature is reduced.[1] For example, BaTiO3 and KNbO3 undergo phase transitions from the cubic paraelectric (PE) phase to a succession of tetragonal, orthorhombic, and finally rhombohedral ferroelectric (FE) phases. In contrast, PbTiO3 displays only a single transition, from the cubic PE phase to a tetragonal FE phase. In NaNbO3 and PbZrO3, non-polar antiferrodistortive (AFD) or antiferroelectric (AFE) transitions take place, associated with different types of tilts of the oxygen octahedra, in addition to the FE transitions. It is understood that the two types of transitions result from the condensation of soft phonon modes at the Brillouin zone boundary with and at the zone center with (Ref. [2]).
The low-temperature behavior of SrTiO3 has been an attractive subject for experimental and theoretical study. SrTiO3 behaves as an incipient ferroelectric[3] (similar to KTaO3) in the sense that it has a very large static dielectric response and is only barely stabilized against the condensation of the FE soft mode at low temperature.[1, 4, 5] As the temperature is reduced, SrTiO3 first undergoes a transition from the cubic to a tetragonal AFD phase at 105K,[6] but this transition is of non-polar character and has little influence on the dielectric properties. The static dielectric response closely obeys a Curie-Weiss law of the form of at temperatures above about 50K, but the divergence at a critical temperature 36K that would be expected from this formula is not observed.[4, 5, 7] Instead, the susceptibility saturates at an enormous value of as approaches zero. Because the system is so close to a ferroelectric state, it is not surprising to find that it can be induced to become ferroelectric, either by the application of electric field[6], uniaxial stress[8] or by the substitution of Ca ions on the Sr sublattice.[9] Finally, the SrTiO3 system also displays puzzling phonon anomalies[10, 11, 12, 13] and electrostrictive response[14] in the low-temperature regime.
This peculiar behavior, especially the failure of the system to condense into a FE phase at low , has been the subject of considerable theoretical study and speculation. [15, 16, 17, 18, 19, 20, 21] Recently, efforts have focused on the so-called “quantum paraelectric state” postulated by Müller and Burkard,[17] who suggested that quantum fluctuations of the atomic positions could suppress the FE transition and lead to a stabilized paraelectric state.[17, 18, 19, 20] This hypothesis has received dramatic support from a recent experiment showing that isotopically exchanged SrTi18O3 appears to become ferroelectric at 23K,[22] suggesting that normal SrTi16O3 must be very close indeed to the ferroelectric threshold.
First-principles calculations have already contributed significantly to the understanding of the structural properties of SrTiO3. [20, 21, 23, 24, 25] Calculations of two groups[21, 23, 24] confirmed that SrTiO3, in its high-symmetry cubic structure at , is unstable to both FE and AFD distortions when the atomic coordinates are treated classically. Using classical Monte Carlo simulations on an effective-Hamiltonian[26] fitted to the first-principles calculations, Zhong and Vanderbilt[21] predicted that SrTiO3 would first undergo the AFD transition at about 130 K, and then a further transition into a state with simultaneous AFD and FE character at 70 K. Anharmonic interactions between the AFD and FE modes were found to be competitive, in the sense that the presence of the AFD distortion was found to reduce the FE transition temperature by about 20%. The same authors later showed that, when a quantum-mechanical treatment of the atomic positions was included via a quantum path-integral Monte Carlo simulation, the AFD transition temperature was shifted very close to the experimental one at 105 K, and the FE transition was suppressed down to the lowest temperatures that could be studied (5 K),[20] consistent with the experimental absence of a transition. On the other hand, LaSota and coworkers have recently performed a first-principles calculation of the ground state structural properties and interactions between the FE and AFD instabilities in SrTiO3 using an LAPW approach.[25, 27] These authors found that the AFD tetragonal structure is stable against the FE distortions, indicating no interaction between the AFD and FE modes. The conclusion is in contrast to the previous theory.[21] However, LaSota et al. made certain approximations to the FE eigenmodes, as will be discussed below.
An additional motivation for a detailed theoretical study of SrTiO3 is the opportunity to make contact with the remarkably systematic experimental study of Uwe and Sakudo.[8] These authors made careful measurements of the anisotropic dielectric susceptibilities and Raman mode frequencies as a function of uniaxial stress applied along different crystal orientations. They also fitted their results, plus those of previous experimental studies, to obtain a phenomenological description of the couplings between the AFD, FE, and strain degrees of freedom of the crystal. In particular, their fit contains an anisotropic coupling which, in the tetragonal AFD phase, tends to favor FE distortions that are perpendicular to the tetragonal axis over those that are parallel. However, previous theoretical work has given an unclear picture of this anisotropy. On the one hand, Vanderbilt and Zhong [28] found that the interaction between the FE and AFD modes, which was mainly through the on-site anharmonic coupling, would tend to favor FE modes polarized perpendicular to the AFD tetragonal axis, in accord with experiment. On the other hand, the Monte Carlo calculations previously referred to[21] indicated a sequence of transitions with decreasing temperature in which the FE order parameter of a -polarized mode was found to develop before the or -polarized ones, indicating that the -polarized mode goes soft first. Finally, the recent work of LaSota et al. [25, 27] suggests that there is very little anisotropic coupling at all. In view of these apparently conflicting theoretical results, we felt it worthwhile to clarify this situation by carefully studying the anisotropy of the FE distortion energy in the AFD ground state.
With these motivations, we have carried out a thorough analysis of the ground-state structural and dynamical properties of tetragonal SrTiO3 using first-principles density-functional calculations. This approach is based on a classical treatment of the nuclear motions, and so is obviously unable to take into account the quantum zero-point motion of the ionic positions which becomes critically important at low temperature. Nevertheless, from such a calculation one is still able to compute interaction parameters for comparison with experiment, to identify the effects which tend to suppress the FE instability in the presence of the AFD state, and to obtain qualitatively a picture of the dielectric anisotropy connected with the splitting of the differently polarized FE modes in the AFD state.
The calculations are carried out using a plane-wave basis and ultrasoft pseudopotentials.[29] The theoretical equilibrium AFD structure is obtained by minimizing the energy with respect to cell volume, ratio, and internal parameters. Frozen-phonon calculations are then used to obtain the frequencies of -point and -point phonon modes, including FE soft modes, in the AFD ground state. For this purpose, we make use of a point-group symmetry analysis to reduce the complexity of the distortions that need to be studied. In order to interpret the results in terms of a phenomenological description involving FE and AFD mode distortions and strains, we use an approach similar to that underlying the effective-Hamiltonian scheme first developed for the BaTiO3 system[26] and later applied to SrTiO3.[20] That is, we use the LDA calculations to compute the values of the Taylor expansion coefficients of the total energy with respect to these distortions, and compare with the experimental determinations of Uwe and Sakudo.[8]
The rest of the manuscript is organized as follows. In Sec. II we briefly describe the technique employed for the first-principles calculations. In Sec. III we present and discuss the results of the calculations. We begin with the determination of the theoretical tetragonal AFD structure, and then proceed to study the energies of AFD and FE distortions about this reference structure, with special attention to the anisotropies of the AFD and FE mode frequencies. Finally, we conclude in Sec. IV.
II Theoretical details
Our ab-initio plane-wave pseudopotential calculations are based on the Hohenberg-Kohn-Sham density-functional theory (DFT) within the local-density approximation (LDA). Ultrasoft Vanderbilt pseudopotentials [29] are used, with the O(), O(), Ti(), Ti(), Ti(), Ti(), Sr(), Sr(), and Sr() states included in the valence. The exchange-correlation energy is of the Ceperley-Alder form with Perdew-Zunger parameterization.[30, 31] A conjugate-gradient minimization scheme[23] is used to minimize the Kohn-Sham energy, using a plane-wave cutoff of 30 Ry for all calculations. Unless otherwise stated, our calculations are carried out at the theoretical equilibrium lattice constant of 7.303 a.u.[23] which is 1% less than the experimental value of 7.365 a.u., the discrepancy representing the inherent LDA error.
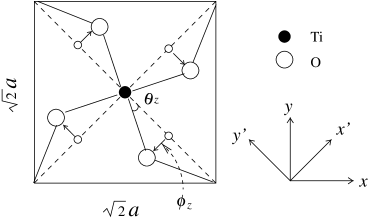
Cubic SrTiO3 has a simple cubic 5-atom unit cell with a common lattice parameter along the [100], [010], and [001] directions. We will briefly discuss some calculations carried out for a doubled unit cell corresponding to the condensation of a soft AFD mode at the (110) or point of the Brillouin zone (BZ) boundary. However, most of our attention will be focused on the ground-state tetragonal phase obtained by freezing in an AFD phonon mode at the (111) or point of the BZ boundary. This triply-degenerate phonon mode corresponds to the rotation of the TiO6 octahedra in opposite directions from one cubic unit cell to the next, followed by a small tetragonal strain. (Note that it is conventional to label the phonon modes with respect to the simple-cubic BZ, even when they condense to lower the symmetry.) Taking the rotation to be about the axis, we adopt a 10-atom tetragonal unit cell with lattice vectors of length , , and along the [110], [10], and [001] directions, respectively. (That is, in our convention, is close to 1, not .) The rotation of the oxygen atoms in the TiO plane is shown in Fig. 1. Throughout this paper, we will use and to denote the original cubic directions ([100] and [010], respectively), while and are taken as parallel to the tetragonal lattice vectors along [110] and [10], respectively. That is, the - frame is rotated by 45∘ relative to the - frame ( axes are congruent).
In all cases, we use a k-point set that is equivalent to the Monkhorst-pack mesh[32] in the BZ of the simple cubic cell, corresponding to 108 k-points in the full BZ of the tetragonal cell. The irreducible BZ then contains 6 k-points for the undistorted cubic structure; 10 k-points for the tetragonal ground-state structure, with or without additional or mode displacements; and 20 k-points for the tetragonal structure with additional mode displacement.
III Results and Discussions
A AFD instability in cubic unit cell

To establish notation, we let the energy of an AFD phonon mode per 10-atom cell of the cubic perovskite structure be expanded up to fourth order in ,
| (1) |
where is the magnitude of the oxygen-atom displacement associated with the rotation of the oxygen octahedra around the [001] axis, as shown in Fig. 1. In Fig. 2 we show the computed values of the total energy versus rotation angle for AFD modes at both the and -points of the BZ (corresponding to in-phase or out-of-phase rotations in neighboring planes of octahedra along respectively). These were computed at zero strain, i.e., with the lattice vectors fixed to be those of the theoretical equilibrium cubic structure (=7.303 a.u.). As can be seen, the computed total energy versus rotation angle can be fitted very well by the quartic Eq. (1). Defining the mode stiffness =, we find that for both - and -point modes as shown in Fig. 2. Nevertheless, the magnitude of for the -point mode is only 10% that of the -point mode, indicating that the instability at the point is much stronger than that at the point. Consequently, for the remainder of this paper we will limit our discussion to -point distortions only.
As can be seen from Figs. 2 and 3, the equilibrium octahedral rotation angle is found to be =5.5∘, significantly larger than the zero-temperature experimental value of 2.1∘.[33] Since the theoretical equilibrium lattice constant (7.303 a.u.) is somewhat smaller than the experimental one, we also carried out similar total-energy calculations at the extrapolated zero-temperature (7.365 a.u.) and room-temperature (7.38 a.u.) experimental lattice constants.[34] The results shown in Figure 3 confirm that increasing the lattice constant or crystal volume tends to suppress the AFD instability, as expected from previous work.[21, 20] However, the resulting variation of the equilibrium rotational angle is too small to explain the experimental observation, changing only marginally to 4.89∘ and 4.69∘ at the zero- and room-temperature experimental lattice constants, respectively.
These results demonstrate that the underestimate by of the lattice constant by the LDA is not the primary factor responsible for the theoretical overestimate of the rotation angle. Moreover, we shall see in the next subsection that the inclusion of strain relaxation effects only acts to increase (slightly) the theoretical equilibrium rotation angle. Thus, we think that the smaller observed value of the AFD rotation angle can most likely be attributed to the quantum fluctuations associated with the motion of the oxygen atoms. This effect is not included in the theory, and should act to reduce the amplitude of symmetry-breaking distortions. While previous work has indicated that the quantum fluctuations should have a weaker effect on the AFD modes than upon the FE ones,[20] the effect on the AFD modes could still be quite significant. An alternate possibility is simply that the underestimate is a result of LDA error not associated with the lattice constant. In any case, we have chosen to complete our theoretical investigations by considering distortions about our theoretical ground-state AFD structure, keeping in mind that the results should be interpreted with the overestimate of the rotation angle in mind.

B AFD modes in the tetragonal structure
To study the ground-state tetragonal structure, the lattice strains also need to be taken into account. We adopt the usual Voigt notation for the strain tensor, but set because such off-diagonal shear strains will not enter into our considerations. We take =1, 2, 3 corresponding to the , , and pseudocubic axes for both strains and rotations . Expanding the energy up to quartic order in AFD amplitudes, quadratic order in strain, and leading order in the strain-AFD coupling, the symmetry-allowed contributions are
| (2) | |||||
| (3) | |||||
| (4) |
We choose the tetragonal ground state to be oriented along the -axis, with , , and . In this ground state, phonon modes corresponding to additional oscillations of belong either to the (=1 or 2) or the (=3) representation of the tetragonal point group. For symmetry-preserving () distortions, it is convenient to re-express the three strain components in terms of a volume strain and a shear strain according to
| (8) |
In terms of these variables, the second and third lines of Eq. (4) can then be rewritten as
| (9) |
and
| (10) |
where
| (11) |
To find the equilibrium rotation angle in the ground state, we hold ==0 and minimize in Eq. (4) with respect to and at a fixed . The minimizing values are
| (12) |
Substituting into Eq. (4),
| (13) |
where
| (14) |
Thus, when the strain relaxation is taken into account, the equilibrium rotation angle is given by
| (15) |
| Uwe and Sakudoa | present | Units | |
|---|---|---|---|
| Ha/Bohr5 | |||
| Ha/Bohr7 | |||
| Ha/Bohr7 | |||
| Ha/Bohr7 | |||
| Ha/Bohr7 | |||
| Ha/Bohr5 | |||
| Ha/Bohr5 | |||
| Ha/Bohr3 | |||
| Ha/Bohr3 | |||
| degree |
We determine all the interaction parameters , , , , , , and via a series of finite-difference calculations of total energies and forces within the LDA. Table I lists our results and compares them with the corresponding values determined by Uwe and Sakudo by fitting to experiment [8] (all units have been converted to atomic units). We find very good agreement overall.[35] The fact that implies that the inclusion of strain relaxations strengthens the AFD instabilities at anharmonic order. The equilibrium rotation angle increases to 6.0∘ (compared with 5.5∘ for the cubic strain state), while the equilibrium values of and are found to be and , respectively.
In the tetragonal AFD ground state, the frequencies of the soft phonon modes associated with additional rotations of the oxygen octahedra are given by evaluating
| (16) |
where is the mass factor associated with the oxygen rotational mode and the derivative is to be evaluated under conditions of fixed strain at the equilibrium structure (i.e., at the equilibrium values of , , and ). Eq. 16 gives the frequencies of the and modes to be, respectively,
| (17) |
where . The values of the two frequencies are 45 cm-1 and 130.7 cm-1 respectively, so that the frequencies of the and modes are roughly in the ratio 3:1. This is consistent with observed ratios of 2.5:1 in pressure-dependent experiments [36] and 3:1 in temperature-dependent experiments [37].
Up to this point, the analysis has been done at the theoretical equilibrium lattice constant. However, it is well known that the LDA tends to underestimate the lattice constants of perovskites by 1%. [23] Moreover, past experience has shown that the displacement patterns associated with soft modes may depend critically on the lattice constant and strains.[38, 39] To take these effects into account, we adopted a strategy of applying a negative hydrostatic pressure to the lattice to restore the experimental lattice constant.[26] Using Eq. (4) and minimizing the Gibbs free energy
| (18) |
with respect to at fixed pressure , we find
| (19) |
while is independent of pressure. Then
| (20) |
where the effective harmonic coefficient is
Thus, at fixed pressure, the equilibrium rotation angle is
| (21) |
As one can see, the harmonic coefficient depends upon the external pressure variable. It would thus be possible, in principle, to adjust so as to fit the resulting rotation angle to the experimental angle of 2.1∘. However, the pressure needed to achieve this, 14.4GPa, would expand the lattice constant to 7.48 a.u., which is much larger than the experimental value. Instead, we adjust so as to fit the experimental lattice constant. That is, we adjust so that the volume strain is , where =7.365 a.u. and are the zero-temperature experimental and theoretical lattice constants, respectively. Substituting (21) into (19), we obtain
| (22) |
where
| (23) |
Inserting leads to 5.26GPa. The strains along the tetragonal and planar axes are found to be 1.135% and 0.705%, respectively. Relative to a cubic cell with the experimental lattice parameter 7.365 a.u., the tetragonal cell we obtained is thus expanded along [001] while compressed along the [100] and [010] directions. In this circumstance, the equilibrium rotation angle is found to be 4.93∘.
Under these conditions, the and soft-mode frequencies of Eq. (17) now become
| (24) |
From the coefficients in Table I, = and =, so that clearly . In fact, the two frequencies are calculated to be =37 cm-1 and =109 cm-1. (For comparison, =124 cm-1 in Ref. [27], while the measured and in Ref. [6] are 15 cm-1 and 48 cm-1 respectively).
To summarize the results so far, we have found that the AFD mode condenses at the point of the cubic BZ, associated with a triply-degenerate phonon of symmetry. As a consequence of the transition from the cubic to the tetragonal state, the degenerate -point modes split strongly into an singlet and an doublet, the latter having a softer frequency than the former. This is in good qualitative agreement with experiment.[6]
The expansion approach used above for the AFD modes makes an implicit assumption that the phonon eigenvectors from the cubic structure are a good approximation to those in the tetragonal AFD structure. For the AFD modes, where the anisotropy is large, we do not expect this approximation to be at all serious. However, our next task will be to analyze the FE mode anisotropy in the AFD state. As will be seen below, this turns out to be much more delicate than for the AFD modes. Thus, we have chosen to take a different approach for the FE modes, in which the normal modes in the AFD ground state are directly computed. The symmetry analysis needed to do this is given in the next subsection, and the FE mode analysis is then given in the concluding subsections.
C Symmetry analysis of normal modes in AFD tetragonal phase
In this section, we present some details of the point-group symmetry analysis of the normal modes in the AFD tetragonal structure, needed for the calculation of the frequencies of transverse optical (FE) modes at the Brillouin zone center.
To harmonic order, the displacement energy can be expressed as
| (25) |
where is the displacement of sublattice in Cartesian direction , and the force constant matrix obeys the symmetry conditions and . The dynamical matrix is just related to the force constant matrix by a diagonal mass tensor.
| irreps | 2 | 2 | 2 | 2 | ||||||
|---|---|---|---|---|---|---|---|---|---|---|
| 1 | 1 | 1 | 1 | 1 | 1 | 1 | 1 | 1 | 1 | |
| 1 | 1 | 1 | 1 | 1 | 1 | 1 | ||||
| 1 | 1 | 1 | 1 | 1 | 1 | |||||
| 1 | 1 | 1 | 1 | 1 | ||||||
| 2 | 0 | 0 | 2 | 0 | 0 | 0 | 0 | |||
| 1 | 1 | 1 | 1 | |||||||
| 1 | 1 | 1 | 1 | 1 | ||||||
| 1 | 1 | 1 | 1 | 1 | ||||||
| 1 | 1 | 1 | 1 | 1 | 1 | |||||
| 2 | 0 | 0 | 0 | 0 | 2 | 0 | 0 |
It is well known that the vibrational modes at a given -point in the BZ of a crystal transform according to the corresponding irreducible representations of the symmetry group for that -point. Such an analysis, which has previously been used to construct the force-constant matrices for the FE modes in the cubic perovskite structure [23] and for all modes in the tetragonal FE structure of PbTiO3,[40] is applied here to the zone-center modes in the AFD tetragonal structure of SrTiO3. When SrTiO3 condenses from the cubic into the tetragonal AFD phase, the point group lowers from to . Because we are interested in zone-center modes, the symmetry group of is just the point group itself, which contains 16 symmetry operations that can all be generated from a fourfold rotation and two mirror reflections and . The character table is shown in Table II. There are 10 irreducible representations (irreps), of which two are two-dimensional. The AFD soft modes originating from the cubic phonons now belong either to the or irreps, depending on whether the octahedron rotation axis is parallel or perpendicular to the tetragonal axis, respectively. Similarly, the modes originating from cubic FE modes are now either or , depending on whether the polarization is parallel or perpendicular to the AFD axis.
| irreps | dim. | Sr | Ti | O1-2 | O3 |
|---|---|---|---|---|---|
| 1 | a | ||||
| 1 | a | 3 | |||
| 1 | a | ||||
| 1 | a | ||||
| 2 | 3 | ||||
| 1 | |||||
| 1 | |||||
| 1 | |||||
| 1 | |||||
| 2 | 3 | ||||
To label all of the displacement patterns associated with the 10-atom cell (30 degrees of freedom), we use the notation to denote a displacement associated with atom type in pseudocubic Cartesian direction and having “phase relation” . The five atoms types are abbreviated as ‘’ for Sr, ‘’ for Ti, ‘3’ for oxygen atoms making Ti-O chains in the direction, and ‘1’ and ‘2’ for oxygen atoms in TiO2 - planes. The “phase relation” is either ‘’ or ‘’ depending on whether the two atoms of the same type in the 10-atom cell move in-phase or out-of-phase (that is, whether they originate from -point or -point modes of the parent cubic structure). Note, however, that some individual displacements contribute to more than one irrep (e.g., 1 and 2 contribute to both the and irreps). Thus, for the two in-plane oxygens we introduce alternative “type” designations (‘even’) and (‘odd’) in place of ‘1’ and ‘2’, where
| (26) |
(six degrees of freedom for each atom type), classifying them according to the irreducible representations to which they belong. Note that the four (,)(,) modes do not have a simple one-to-one correspondence with the , , , and modes to which they give rise; these are indicated in the table with just the notation .
Since we have access to the Hellmann-Feynman forces [41] in our first-principles ultrasoft-pseudopotential approach, it is convenient to compute the force-constant matrix elements from finite differences as
| (27) |
where is the force that results from a sufficiently small displacement . We can use the symmetry analysis to identify the set of sublattice displacements that may participate in a given normal mode, and to calculate the forces that arise at first order with each such displacement. For example, for the FE mode, we find the four displacements of types , , , and may participate. For each, a displacement amplitude of 0.2% of the lattice constant is chosen so that the harmonic approximation is still well satisfied. From each such calculation, the resulting force vector is projected onto the same set of four displacements, thus building up the force-constant matrix. This matrix is then symmetrized and diagonalized. In a similar way, the FE mode is represented in a 66 subspace with basis , , , 3, , and .
D FE instability in the AFD tetragonal phase
| point | TO1 | TO2 | TO3 |
|---|---|---|---|
| Current (7.303 a.u.) | 42 | 168 | 549 |
| Current (7.365 a.u.) | 94 | 151 | 521 |
| PWa (7.30 a.u.) | 41 | 165 | 546 |
| LRb (7.412 a.u.) | 100 | 151 | 522 |
| Expt.c 90K | 42 | 175 | 545 |
Previous work of Zhong and Vanderbilt[42] and LaSota et al. [24] has indicated that cubic SrTiO3, in the absence of any AFD distortion, shows a FE instability. We have confirmed this result here by performing frozen-phonon calculations and building up the force-constant matrix for modes polarized along (essentially the same procedure outlined for the modes at the end of the last subsection, except performed for the cubic 5-atom cell). The non-zero eigenvalues of the corresponding dynamical matrix are given in Table IV for both the theoretical equilibrium (7.303 a.u.) and expanded experimental (7.365 a.u.) lattice constants, together with other theoretical and experimental results for comparison. Our results at the theoretical volume indicate that the FE soft phonon mode frequency remains real, although it was imaginary according to the earlier linear-response and plane-wave calculations which used slightly different lattice constants.[24, 42] However, at the zero-temperature experimental volume, the frequency is found to be imaginary, indicating that the FE instability is indeed very sensitive to the crystal volume. Increasing the crystal volume enhances the FE instabilities, in agreement with experiment.[44, 21] This is in contrast to the AFD instability, which weakens with increasing volume as shown in Sec. III.A. These results suggests that there is an inherent competition between AFD and FE modes.
To understand the behavior of the FE modes in the zero-temperature AFD tetragonal structure, we next perform frozen-phonon calculations for this structure. We use the AFD state described at the end of Sec. III.B, i.e., 5.26GPa, =798.989 a.u.3, 1.004, and =4.93∘. Both and modes are calculated using the method presented in Sec. III.C. Tables V and VI present the resulting eigenfrequencies and eigenvectors for the three lowest modes of each symmetry. It can be seen that both the and soft-mode frequencies are imaginary (96 and 90 cm-1, respectively). Total-energy calculations are then performed with the corresponding eigenmodes at different mode amplitudes. The double-well energy curves are as shown in Fig. 4. One can see that the well depth of the mode is substantially greater than that of the mode, indicative of a much stronger instability for a distortion of symmetry.
| 3 |
|---|
| 3 |
|---|
With respect to the FE mode frequencies, the comparison with experiment is problematic because the theoretical values are imaginary (indicating an instability) while the experimental values are not (consistent with a non-FE =0 ground state). As indicated in the Introduction, the experimental stabilization of the non-FE AFD structure is understood to result from quantum fluctuations of the atomic coordinates. It should be emphasized that the purpose of the present calculations is to study the low-temperature structural instabilities in a classical framework, i.e., in the absence of quantum fluctuations. Thus, the existence of the FE instabilities in our DFT-LDA ground state calculations, taken together with earlier quantum Monte Carlo simulations,[20] tend to corroborate the hypothesis that the quantum fluctuations are responsible for the experimental absence of a real FE phase.

Nevertheless, we can make the following comparisons. In the stress-induced Raman scattering measurement of Uwe and Sakudo, the and soft mode frequencies were found to be 9.10.6 cm-1 and 191 cm-1 respectively (this appreciable splitting between the two modes has frequently been overlooked).[8] The two squared frequencies produce a difference of 3102 cm-2. Our calculation shows the difference between the two frequencies to be 6 cm-1, roughly the same order of magnitude as the difference found experimentally. However, the theoretical difference of squared frequencies is 10102 cm-2, or roughly three times larger than the experimental value. This is simply because of the large magnitude of the imaginary frequencies.
In summary, we found imaginary frequencies for both the FE and soft modes in the AFD tetragonal phase. There is an apparent splitting between the two modes, , suggesting that the FE structure of symmetry is more energetically favorable than the one. This result is consistent with the fact that the FE mode is less easily observed in neutron scattering experiments [45] because its energy is higher than that of the phonon.[8]
E Influences of structural distortions on the stabilities
In the previous subsection, we have calculated the FE phonon frequencies for either a cubic structure in the absence of the AFD distortion, or for a tetragonal AFD phase as observed experimentally. To understand the interaction of different distortions and their roles in affecting the FE instabilities, we performed frozen-phonon calculations for the cubic reference structure at the experimental lattice constant both with and without the tetragonal strain, and with and without the AFD rotation. In Table VII we present the results for the FE phonon frequencies for each of these scenarios.
Observe that the two FE modes instabilities with different symmetries depend on the strain distortion and AFD distortion in an opposite sense. For the mode, a non-zero shear strain increases the FE instability while an AFD rotation distortion reduces it. The mode, however, depends on the two distortions in the opposite way. Thus, the final sign of the frequency splitting (i.e., the sign of the anisotropy) ultimately depends sensitively on a delicate partial cancellation of the two contributions. The final result is that the mode is energetically slightly more unstable than the mode.
| Distortions | FE symmetry | |||
|---|---|---|---|---|
| 0 | 0 | 0 | 42 | 42 |
| 0.00849 | 0 | 0 | 94 | 93 |
| 0.00849 | 0.00143 | 0 | 112 | 83 |
| 0.00849 | 0.00143 | 4.9∘ | 90 | 96 |
| 0.00849 | 0 | 4.9∘ | 63 | 107 |
Finally, we have tested whether the use of the cubic eigen-mode distortion in place of the true tetragonal one is a good approximation for understanding the coupling of the FE and AFD instabilities. We calculated the expectation value , where is the dynamical matrix in the tetragonal ground state structure (fourth row of Table VII) and is the cubic eigen-mode distortion vector. The resulting imaginary frequencies are 85.4 and 86.9 cm-1 for the A2u and Eu modes respectively, compared with values of 90 and 96 cm-1 in Table VII. Thus, the splitting is much smaller when the expectation value is used. This makes it clear that the nature of the FE anisotropy is quite sensitive to the tetragonal lattice strain associated with the AFD rotation distortion. This suggests a probable explanation for the fact that the classical MC simulations of Ref. [20], which are based on use of a cubic mode eigenvector, predicted the anisotropy incorrectly – i.e., the mode was found to go soft before the one.
IV Conclusion
In this work, we have investigated both the AFD and FE structural instabilities in the tetragonal phase of SrTiO3. A unique aspect of this work is that we have studied the FE frequencies carefully using the exact eigenmode distortion obtained from the ground-state tetragonal structure, whereas previous studies have made the approximation of using the cubic eigenmode distortion instead. We show that the instabilities have a sensitive dependence on the crystal volume. We also found that the existence of the FE instabilities are affected by the coupling to the shear strain and the rotational distortion. Both types of distortion contribute, but with opposite sign, so that it is a subtle cancellation between them that determines the splitting of frequencies between the and modes. The mode is found to be the more unstable of the two in the ground-state AFD phase.
The degree of tilt of the oxygen octahedra is still overestimated in our calculations, compared to the experimental results. We attribute this to the quantum fluctuations of the oxygen coordinates, which tend to suppress the average AFD distortion amplitude in the experiments. The AFD and FE instabilities show opposite trends with an increase of crystal volume (weakening and strengthening, respectively). However, despite this competitive behavior, the FE instability is found to coexist in the zero-temperature AFD phase. Once again, quantum zero-point fluctuations must be invoked to explain the experimental observation that the AFD phase is stable against FE distortions.
Acknowledgements.
Support for this work was provided by ONR Grant N00014-97-1-0048.REFERENCES
- [1] M.E. Lines and A.M. Glass, Principles and Applications of Ferroelectrics and Related Materials, (Oxford University Press, Oxford, 1977).
- [2] R. Blinc and B. Zeks, Soft mode in Ferroelectrics and Antiferroelectrics (North Holland Publishing Co - Amsterdam, Oxford, 1974).
- [3] J.H. Barrett, Phys. Rev. 86, 118 (1952).
- [4] T. Mitsui and W.B. Westphal, Phys. Rev. 124, 1354 (1961).
- [5] E. Sawaguchi, A. Kikuchi, and Y. Kodera, J. Phys. Soc. Japan 17, 1666 (1962).
- [6] P.A. Fleury, J.F. Scott, and J.M. Worlock, Phys. Rev. Lett. 21, 16 (1968).
- [7] R. Viana, P. Lunkenheimer, J. Hemberger, R. Böhmer, and A. Loidl, Phys. Rev. B 50, 601 (1994).
- [8] H. Uwe and T. Sakudo, Phys. Rev. B 13, 271 (1976).
- [9] J.G. Bednorz and K.A. Müller, Phys. Ref. Lett. 52, 2289 (1984).
- [10] E. Courtens et al., Phys. Scripta T49, 430 (1993).
- [11] E. Courtens, B. Hehlen, G. Coddens, and B. Hennion, Physica B 219, 577 (1997).
- [12] J.F. Scott and H. Ledbetter, Z. Phys. B 104, 635 (1997).
- [13] A.A. Sirenko et al., Phys. Rev. Lett. 82, 4500 (1999).
- [14] D.E. Grupp and A.M. Goldman, Phys. Rev. Lett. 78, 3511 (1997); Science 276, 392 (1997).
- [15] A.S. Chaves, F.C.S. Barreto, and L.A.A. Ribeiro, Phys. Rev. Lett. 37, 618 (1976).
- [16] R. Migoni, H. Bilz, D. Bäuerle, Phys. Rev. Lett. 37, 1155 (1976).
- [17] K.A. Müller, H. Burkard, Phys. Rev. B 19, 3593(1979).
- [18] K.A. Müller, W. Berlinger, and E. Tosatti, Z. Phys. B 84, 277 (1991).
- [19] R. Martoňák and E. Tosatti, Phys. Rev. B 49, 12596 (1994).
- [20] W. Zhong, D. Vanderbilt, Phys. Rev. B 52, 5047 (1996).
- [21] W. Zhong, D. Vanderbilt, Phys. Rev. Lett. 74, 2587 (1995).
- [22] M. Itoh et al., Phys. Rev. Lett. 82, 3540 (1999).
- [23] R.D. King-Smith and D. Vanderbilt, Phys. Rev. B 49, 5828 (1994).
- [24] C. LaSota, C.Z. Wang, R. Yu, and H. Krakauer, Ferroelectrics 194, 109 (1997).
- [25] C. LaSota, C.Z. Wang, R. Yu, and H. Krakauer, in First-Principles Calculations for Ferroelectrics: Fifth Williamsburg Workshop, R.E. Cohen, ed. (AIP, Woodbury, New York, 1998), p. 139.
- [26] W. Zhong, D. Vanderbilt, and K.M. Rabe, Phys. Rev. Lett. 73, 1861 (1994)
- [27] C. LaSota, C.Z. Wang, R. Yu, H. Krakauer, unpublished.
- [28] D. Vanderbilt, W. Zhong, Ferroelectrics, 206-207, 181, (1997).
- [29] D. Vanderbilt, Phys. Rev. B 41, 7892 (1990).
- [30] D.M. Ceperley, Phys. Rev. B 18,3126, (1978); D.M. Ceperley and B.J. Alder, Phys. Rev. Lett 45, 566 (1980).
- [31] J. Perdew and A. Zunger, Phys., Rev. B 23, 5048 (1981).
- [32] H.J. Monkhorst and J.D. Pack, Phys. Rev. B. 13, 5188 (1976).
- [33] E. Courtens, Phys. Rev. Lett. 29, 1380 (1972).
- [34] T. Mitsui et al., Oxides, Landolt-Bornstein Numerical Data and Functional relationships in Science and Technology, NS, Group III ( Springer-Verlag, Berlin, 1979).
- [35] In the present work, off-diagonal shear strains are set to zero (), and consequently the shear elastic and coupling coefficients and are neglected, leading to a discrepancy between our value and the value cited in Ref. [8] in which the term is added. However, our calculated values and are consistent with and ( respectively in Ref. [8].
- [36] T. Ishidate and T. Isonuma, Ferroelectrics 137, 45 (1992).
- [37] J.C. Slonczewski and H. Thomas, Phys. Rev. B 1, 3699 (1970).
- [38] R.E. Cohen, H. Krakauer, Ferroelectrics, 136, 65-83 (1992).
- [39] R.E. Cohen, H. Krakauer, Phys. Rev. B 42, 6416 (1990).
- [40] A. García, D. Vanderbilt, Phys. Rev. B 54, 3817 (1996).
- [41] H. Hellman, Einführung in die Quantenchemie (Deuticke Leipzig, 1937); R.P. Feyman, Phys. Rev. 56, 40 (1939).
- [42] W. Zhong, R.D. King-Smith, D. Vanderbilt, Phys. Rev. Lett. 72, 3618 (1994).
- [43] J.L. Servoin, Y. Lusoin, F. Gervais, Phys. Rev. B 22, 5501 (1980).
- [44] T. Ishidate, S. Abe, H. Takahashi, N. Môri, Phys. Rev. Lett. 24, 2397, (1997).
- [45] Y. Yamada and G. Shirane, J. Phys. Soc. Jpn 26, v396 (1969).