[]
X-ray scattering study of two length scales in the critical fluctuations of CuGeO3
Abstract
The critical fluctuations of CuGeO3 have been measured by synchrotron x-ray scattering, and two length scales are clearly observed. The ratio between the two length scales is found to be significantly different along the axis, with the axis along the surface normal direction. We believe that such a directional preference is a clear sign that surface random strains, especially those caused by dislocations, are the origin of the long length scale fluctuations.
pacs:
PACS numbers: 64.70.-p, 61.10.Eq, 75.40.CxI Introduction
High resolution x-ray and neutron scattering studies of the critical fluctuations associated with structural and magnetic phase transitions typically reveal “two length scales”, that is, two distinctive scattering lineshapes superimposed upon each other in the critical scattering profile[1]. Since the existence of the second length scale seems to contradict the fundamental assumption of modern critical phenomena theory that there exists only one characteristic length in the critical fluctuations, extensive experimental and theoretical efforts have been devoted to elucidating the exact origin of this phenomenon. However, in spite of a significant amount of work dedicated to this problem, a consensus still has not been reached. Presently, there exist two main approaches[1]:(1) models based on intrinsic near-surface effects and (2) explanations involving near-surface random defects. The accumulating experimental evidence seems to favor the randomness interpretation although there is still no definitive experiment to pinpoint the exact origin of the second length scale fluctuations.
In the present paper, we present a high-resolution synchrotron x-ray scattering study of the critical fluctuations associated with the spin-Peierls structual phase transition in CuGeO3. Not only do we clearly observe two lineshapes in the critical scattering profile, but we also observe a dramatic change of the anisotropy ratio of the correlation length divergence along the three primary crystal axes. The existence of the modified anisotropy ratio provides substantial evidence that near-surface dislocations are the origin of the second length scale fluctuations.
Our paper is organized as follows: In Section II we provide details of the sample preparation and experimental measurements. In Section III we present our experimental results. A discussion of the results and conclusions is given in Section IV.
II Experimental Procedures
The experiment was carried out at MIT-IBM beamline X20A at the National Synchrotron Light Source. The x-ray beam was focused by a mirror, monochromatized by a pair of Ge (111) crystals, scattered from the sample, and analyzed by a Si (111) analyzer. The x-ray energy was 8.5 keV. High quality pure CuGeO3 and Cu0.99Zn0.01GeO3 single crystals grown by the travelling solvent floating zone method were used. Carefully cleaved samples were placed inside a Be can filled with helium heat-exchange gas and mounted on the cold finger of a 4K closed cycle cryostat. The experiment was carried out around the (1.5, 1, 1.5) SP dimerization peak position with the (H K H) zone in the scattering plane.
III Experimental Results
Pretransitional lattice fluctuations along the H, K and L directions have been measured in pure CuGeO3 by x-ray[2, 3] and neutron scattering[4]. All of the experiments have shown rapid and anisotropic broadening of the scattering peaks when the sample was heated across TSP, which was clear evidence of anisotropy in the magnetic interaction[2]. Close to TSP, however, Schoeffel et al.[2] observed a crossover temperature TCO where the ratio of the correlation lengths along the three crystal axis directions appeared to change abruptly: and below and above. This was used as evidence of a crossover to a 2D lattice fluctuation regime above . Later, both experimental and theoretical efforts were devoted to elucidating the exact nature of the 2D crossover[5, 6]. Harris et al.[3], on the other hand, studied the critical behavior in the immediate vicinity above TSP and reported a different anisotropy ratio. However, the critical fluctuations reported by Harris et al.[3] have length scales which are about an order of magnitude larger than those reported by Schoeffel et al.[2]. The discrepancies in these two experiments demonstrate that one must treat the data near the transition more cautiously. In extracting the correlation length just above TSP, it is necessary to take into account explicitly that there exist two distinct scattering length scales. Distinguishing and separating their individual contributions to the total cross-section will be of primary importance. This comprises a principal motivation of this experiment.
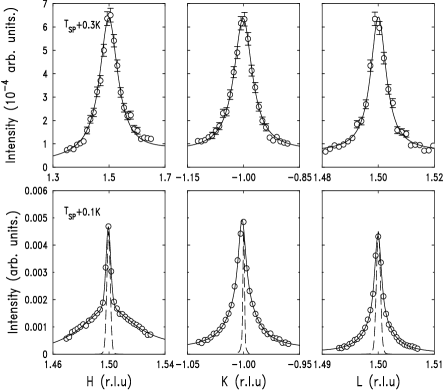
To reconcile the results of previous critical scattering studies of CuGeO3[2, 3] and to obtain some insight into the physical origin of the second length scale, we carefully studied the pretransitional critical behavior just above TSP. Though the exact origin of the long length scale fluctuations has not been determined, it has long been speculated that they originate from random surface stresses caused by defects[1, 3]. Hence, we prepared our samples by cleaving them several times until no observable cracks could be seen by visual inspection. In doing so, we took advantage of the fact that CuGeO3 crystals are inclined to self-cleave along the crystal plane. Thus, no additional grinding or polishing process is necessary to achieve a visually smooth mirror surface. To put the two previous seemingly conflicting experiments together, we need to have information on both length scales in the same sample. Fortunately, this is exactly what we have observed in our experiment. In Fig. 1 we show the critical scattering profiles along the H, K, and L directions at TK and TK for undoped CuGeO3. At TK, there clearly exist two distinct scattering profiles along all three directions, with a sharp central peak superimposed upon a broader peak. This corresponds to archetypal two-length scale behavior. However, a closer examination of the data reveals that even though there are clearly two features along all three directions, the central peak along the H direction is much sharper in comparison to the broad one than is observed along the other two directions. In other words, the ratio of the correlation lengths for these two length scales are significantly different along one of the three crystal axis directions.
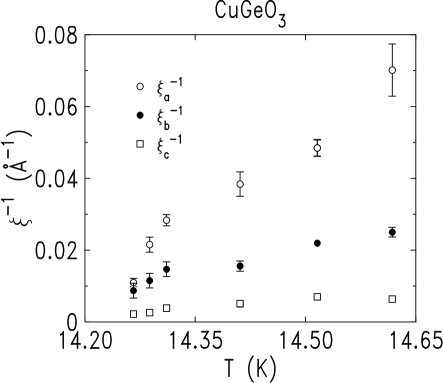
In Fig. 2 , we show the inverse correlation lengths of the broad component as functions of temperature along the H, K, and L directions. Several features can be recognized immediately. First, the correlation length diverges rapidly as the temperature approaches TSP from above, which demonstrates that the SP transition in our CuGeO3 crystal is a well defined second-order phase transition. Second, the correlation length also diverges anisotropically along the three crystal axes. In the temperature range , the anisotropy ratio remains and , which is consistent with the high temperature data taken both by x-ray and neutron scattering[2, 4]. Thus we do not observe any evidence for the presumed 2D crossover [2], in which there should exist a dramatic change in the anisotropy ratio about 1K above TSP. Specifically, in Ref[2] it is argued that below this crossover temperature, the correlation length along the -axis direction equals the correlation length along -axis direction. Our results clearly demonstrate that the correlation length anisotropy ratio remains unchanged from high temperatures to very near TSP, that is, there is no evidence for any crossover.
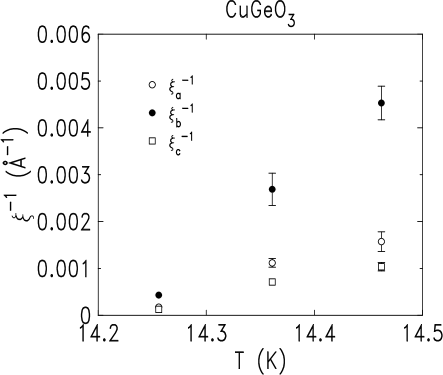
Fig. 3 shows the inverse correlation length of the sharp component as a function of temperature. One of the salient features is that, although the correlation length of the sharp component diverges in a manner similar to that of the broader component, the anisotropy ratio of the correlation lengths along the three axes directions is modified to and . This is reminiscent of the high resolution results reported by Harris et al.[3]. Instead of the relationship , the large length scale fluctuations exhibit the hierarchy . The change of the order of the correlation lengths is informative, since there are not many physical mechanisms which could induce such a directional preference. The confirmation of the change of the order of the correlation lengths in our experiment proves that this is a general phenomenon instead of an irreproducible singular case. Furthermore, if we directly compare the magnitude of the two length scales along , and crystal axes, ratios of would result, with the maximum along the axis and similar values along the - and -axes. The other feature worth mentioning is the relative importance of the second length scale in both studies. In Harris et. al. [3]’s case, only the long length scale fluctuations were clearly observable over the temperature range studied. On the other hand, in our experiments, the fluctuations associated with both length scales are clearly observable, which proves that the relative amplitude of the second length scale fluctuations is sample dependent.
Over the last several years, we and others have carried out detailed studies of the effects of dopants on the CuGeO3 magnetic and structural phase transitions with a focus on the overall phase diagram[7, 8, 9]. Such studies can be regarded as a systematic exploration of the effects of point defects on the CuGeO3 structural phase transition. Thus, as a byproduct of our Cu1-x(Zn,Mg)xGeO3 phase diagram studies, we also are able to test the hypothesis that the long length scale fluctuations are caused by point defects[10].
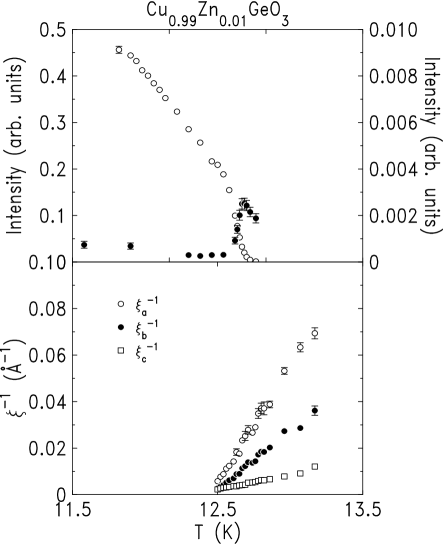
Fig. 4 shows the inverse correlation lengths along the three crystal axes as functions of temperature for 1% Zn-doped CuGeO3. The dramatic effects of the Cu ion dilution on the phase transition are apparent: the transition temperature has been suppressed by more than 1K upon only 1% Zn doping, and the critical exponent associated with the correlation length appears to be different from that of the undoped sample. We are uncertain currently whether this apparently different critical behavior is intrinsic or merely due to a trivial concentration gradient effect. Further experiments are needed to clarify this issue. However, the ratios of the inverse correlation lengths are , which are essentially identical to those of the undoped samples. This consistency of the anisotropy ratios between the doped and undoped sample naturally excludes models for the second length scale based on point defects.
IV Discussion
Before we present our interpretion of our experimental observations, we first briefly summarize the results of previous experimental and theoretical studies on the two length scale phenomenon. Most high resolution critical scattering studies of both structural and magnetic phase transitions reveal two length scales[1]. Further, an elegant neutron scattering study by Shirane and coworkers reveals that the long length scale fluctuations are located in the “skin” of the sample[11]. A subsequent study on the same single crystals by transmission electron microsopy[TEM][13] finds that the density of dislocations has a steep increase within a few microns of the sample surface, which coincides with the onset of the long length scale. Based on the spatial coexistence of the second length scale and dislocations, the authors of Ref[13] conclude that the second length scale originates from dislocations, albeit in an indirect way. As more and more experimental evidence turns up, a gradual consensus is emerging that the origin of the second length scale fluctuations is the random strain fields caused by defects in the sample skins[1]. However, an intrinsic effect explanation can not be excluded[1]. Moreover, even if the idea that the second length scale originates from defects is taken for granted, there exists additional complexity because the defects can either be point defects or line defects such as dislocations. A recent study suggests that point defects are responsible for the occurrence of the second length scale[10]. The dislocation theory, on the other hand, has been less favored. One of the key objections used against it is the lack of directional preference[1] in all the previous studies, that is, dislocations are line defects and they should inevitably favor particular directions. From the results of our study, we believe that CuGeO3 serves as a model system to study the origin of the second length scale and provides strong evidence that dislocation defects are responsible for the occurence of the second length scale fluctuations.
Using dislocation theory, in the following, we explain our experimental observations by a phenomenological model. One of the marked differences between our results and those reported by Harris[3] is the relative importance of the long length scale fluctuations. This can easily be explained, since the density and spatial distribution of dislocations naturally depend on sample preparation and surface processing such as chemical etching, so they would unavoidably vary from sample to sample. The most determinant piece of information to support a dislocation model is the occurrence of a directional preference. The experimental results on the Zn-doped sample provide additional support by demonstrating the irrelevancy of point defects. To understand qualitatively the experimentally observed direction preference, we refer to the theoretical work by Altarelli et al.[14], in which the effect of dislocations has been treated on a qualitative level. As discussed by Altarelli et al.[14], in real crystals, surface treatment always induces slipping parallel to the surface. These defects are edge dislocations parallel to the sample surface but randomly oriented in the plane. They induce anisotropic stress fields in the surrounding crystal since they are line defects by nature. The stress field produced by dislocations can be well modeled by dipole fields with the maximum in the plane perpendicular to the dipole, which is the Burgers vector direction in our case. The whole problem can then be mapped into that of a group of randomly oriented dipoles lying in a plane. The stress field can lower the free energy of the structually ordered phase, thus increasing the phase transition temperature in the stressed region. This is used to account for the emergence of the second length scale[14, 13].
Using this theory, the different ratio between the two length scales can be qualitatively explained. We recall that CuGeO3 crystals naturally cleave in the plane.The difference in magnitude of the two length scales is most prominent along the -axis because the fluctuation amplitude is presumed to be proportional to the average stress field. The random orientation of the dipoles in the surface would results in an isotropic stress field distribution in the plane. However, the maximum average stress field would be produced along the surface normal direction due to the dipole nature. We believe that the stress field is responsible for the creation of pretransitional ordered domain structures[13]. These domains order at a higher temperature than the bulk and have an anisotropic structure owing to the anisotropy of the stress field. This can naturally explain the unusual sharp feature of the critical scattering along -axis and also why the ratio of the two length scales remains relatively unmodified in the other two directions.
We find a tiny difference in the ratio along the and directions, in agreement with Harris et al.[3]. We speculate that this subtle anisotropy originates in a slight anisotropic distribution of the dislocations in the plane. Indeed, a closer inspection of a naturally cleaved CuGeO3 sample surface reveals that the apparently smooth surface is actually composed of some stripes running along the -axis direction. These are most likely formed during crystal growth. When the single crystals are grown using the floating zone method, the seed rod is oriented with the easy growth direction coinciding with the travelling zone direction. Stripes are then naturally formed along the direction of the crystal growth, which is -axis. From the theory of dislocations, structural line defects are preferentially created along the same direction. These defects are normally edge dislocations with the Burgers’ vector perpendicular to the dislocation line and lying in the slip plane, the -axis direction in our case. Hence , this could create a tiny preference for the dipoles to lie in the direction: a resulting minimum ratio along the -axis is expected.
We would further comment that even though dislocation theory offers a satisfactory heuristic explanation of our critical scattering results, many open questions still exist, for example, why is there a similar ratio between these two length scales in many different physical systems and why there does there exist a clear phase transition for the long length scale fluctuations despite the fact we are assuming a spread of transition temperatures. More theoretical and experimental work is needed to address these issues.
In conclusion, we have studied the critical fluctuations in pure and Zn doped CuGeO3. Two length scales have been observed with different anisotropy ratios for the correlation lengths along the three crystal axes. The maximum of the magnitude of the two length scales is found to be along the -axis direction, which is the surface normal of the crystal. We argue that dislocation theory would serve as the best explanation of the origin of the second length scale fluctuations.
V Acknowledgment
We thank G. Shirane for insightful comments. This work was supported by the NSF-LTP Program under Grant No. DMR97-04532.
REFERENCES
- [1] R. A. Cowley, Phys. Scr. T66, 24 (1996), and references therein.
- [2] J. P. Schoeffel, J. P. Pouget, G. Dhalenne, and Revolevschi, Phys. Rev. B 53, 14971 (1996).
- [3] Q. J. Harris, Q. Feng, R. J. Birgeneau, K. Hirota, G. Shirane, M. Hase, and K. Uchinokura, Phys. Rev. B 52, 15420 (1995).
- [4] K. Hirota, G. Shirane, Q. J. Harris, Q. Feng, R. J. Birgeneau, M. Hase, and K. Uchinokura, Phys. Rev. B 52, 15412 (1995).
- [5] J. E. Lorenzo, L. P. Regnault, S. Langridge, C. Vettier, C. Sutter, G. Grubel, J. Souletie, J. G. Lussier, J. P. Schoeffel, J. P. Pouget, A. Stunault, D. Wermeille, G. Dhalenne, and A. Revcolevschi, Europhys. Lett. 45, 45 (1999).
- [6] R. J. Birgeneau, V. Kiryukhin, and Y. J.Wang, Phys. Rev. B 60, 14816 (1999).
- [7] Y. J. Wang, V. Kiryukhin, R. J. Birgeneau, T.Masuda, I. Tsukada, and K. Uchinokura, Phys. Rev. Lett. 83, 1676 (1999).
- [8] T. Masuda, I. Tsukada, K. Uchinokura, Y.J. Wang, V. Kiryukhin, and R.J. Birgeneau, Phys. Rev. B 61, 4103 (2000).
- [9] Y. J. Wang, in prepration.
- [10] J. Trenkler, P. C. Chow, P. Wochner, H. Abe, K. E. Bassler, R. Paniago, H. Reichert, D. Scarfe, T. H. Metzger, J. Peisl, J. Bai, and S. C. Moss, Phys. Rev. Lett. 81, 2276 (1998).
- [11] P. M. Gehring, K. Hirota, C. F. Majkrzak, and G. Shirane, Phys. Rev. Lett. 71, 1087 (1993). K. Hirota, G. Shirane, P. M. Gehring, and C. F. Majkrzak, Phys. Rev. B 49, 11967 (1994). P. M. Gehring, K. Hirota, C. F. Majkrzak, and G. Shirane, Phys. Rev. B 51, 3234(1995).
- [12] U. Rutt et al., A. Diederichs, J. R. Schneider, and G. Shirane, Europhys. Lett. 39, 395 (1997).
- [13] R. H. Wang, Y. M. Zhu, and S. M. Shapiro, Phys. Rev. Lett. 80, 2370 (1998).
- [14] M. Altarelli, M. D. Nunez-Regueiro, and M. Papoular, Phys. Rev. Lett. 74, 3840 (1995).