Evidence for an energy scale for quasiparticle dispersion in
Abstract
Quasiparticle dispersion in is investigated with improved angular resolution as a function of temperature and doping. Unlike the linear dispersion predicted by the band calculation, the data show a sharp break in dispersion at binding energy where the velocity changes by a factor of two or more. This change provides an energy scale in the quasiparticle self-energy. This break in dispersion is evident at and away from the d-wave node line, but the magnitude of the dispersion change decreases with temperature and with increasing doping.
In a conventional metal the observation of an energy scale often provides significant insight into the physical process in the material. The most noted example is the observation of the phonon anomalies in strong coupling superconductors such as lead, which had a far-reaching impact on the understanding of the superconductivity mechanism [1, 2, 3]. For the high-temperature superconductors, a peculiar normal state property is the fact that there appears to be no energy scale, which is often referred to as the marginal Fermi liquid behavior [4]. This behavior is highly anomalous as one would expect certain energy scales in the problem, say phonons which are obviously present in the crystal. In the theoretical context this lack of an energy scale is believed to be a key feature of a near-by quantum critical point [5]. In the superconducting state, on the other hand, there are energy scales observed in the cuprate superconductors. One of them is the superconducting gap and the other is the so-called 41 meV magnetic resonance [6, 7, 8, 9]. The latter has been attributed to the superconducting gap, or the -resonance of the SO(5) theory [7, 10].
With its ability to measure both the real and imaginary parts of the self-energy, , angle-resolved photoemission (ARPES) experiments provide a unique opportunity to further explore this issue as any relevant energy scale present will manifest itself in the quasiparticle dynamics. In the known case of electron-phonon interaction the coupling causes a kink in the dispersion and also a change in quasiparticle lifetime near the phonon energy [3]. These canonical changes reveal effects in the real and imaginary parts of the self-energy due to the electron-phonon interaction, an effect which is experimentally observed recently [11]. In this letter, we present high-resolution ARPES data from superconductors as a function of doping and temperature. We have observed a clear break in the quasiparticle dispersion near binding energy (BE), that results in a change in the quasiparticle velocity up to a factor of two or more. This effect is enhanced in the underdoped sample, and appears to persists above where the break becomes rather broad. Because the electronic structure calculation [12] predicts a linear dispersion in this range, this result represents an important effect in the real part of the self-energy with a scale near . Further, we found that this effect is present at various points of the momentum space. We believe the doping, temperature and -dependent information presented here will put a constrain on microscopic theory.
Angle-resolved photoemission data have been recorded at beamline of the Advanced Light Source utilizing , and photon energies, in a similar set-up as we have reported recently [13]. The momentum resolution was degrees, which is about an order of magnitude better than our previous study of this material, making the results reported in this letter possible. The energy resolution was . The vacuum during the measurement was better than . The underdoped (UD) () and the slightly overdoped (OD) sample () were grown using floating-zone method. The single crystalline samples were oriented and cleaved in situ at low temperature.
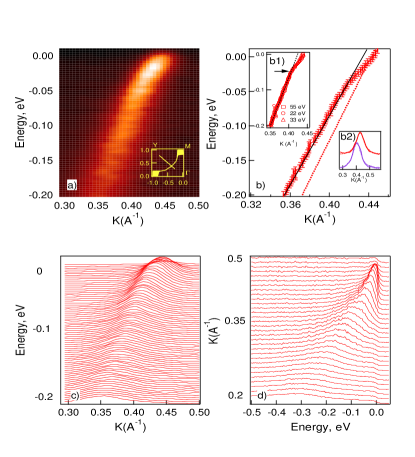
Fig.1a) shows raw ARPES data collected along the to (nodal) direction of the Brillouin zone from the OD sample at 30K. In panel 1b) we plot the dispersion determined from the fits to the momentum distribution curves (MDCs) - angle scans at a constant binding energy [14]. MDC plots show a peak on a constant background that can be fitted very well with a simple Lorentzian, as illustrated in the inset b2). Error bars in and energy are determined from the fit uncertainty and energy resolution respectively. The data clearly show a feature dispersing towards the Fermi energy with an obvious break in the slope near BE. A similar break in the dispersion was also observed at photon energies and . Data for all three photon energies is plotted in the inset b1) in panel b). To describe the dispersion in the range of ( to ) one needs only two straight lines intersecting near BE. This behavior is clearly different from what one expects from the LDA or any other electronic structure calculation where a linear dispersion in this energy range is predicted. Raw MDCs are plotted in panel 1c), while raw energy distribution curves (EDCs) are plotted in panel 1 d) for reference.
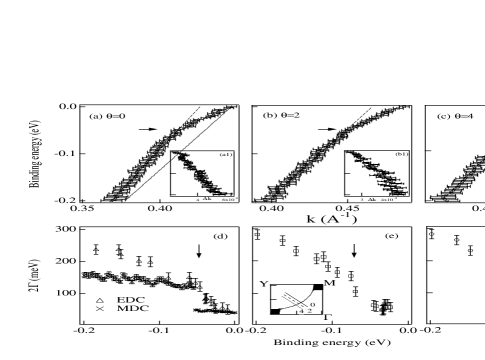
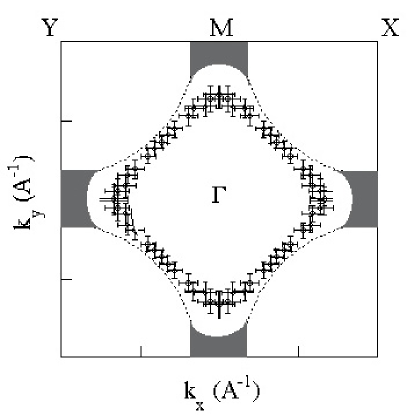
We present in Fig. 2 (a-c) the dispersions obtained from different cuts parallel to the to direction across the Fermi surface for the UD sample at 20K. Within the error bars, the data are again well described by two straight lines with a break near BE. The energy position of the break is constant throughout the BZ within the experimental uncertainty, despite the opening of the gap. Fig. 3 shows the locations in the two-dimensional zone where the break is experimentally observed. It demonstrates that the effect is present in all directions.
We have investigated this effect as a function of doping and temperature. The effect appears to be stronger in the underdoped sample. The change of the quasiparticle velocity at the break is different, which can be illustrated by data along the to direction. For the underdoped sample, the quasiparticle velocity determined from the MDC fits shows a break from at higher binding energies to near the Fermi level. The respective velocities for the optimally doped samples are and . The error in velocities from the fits is . Main source of error is the possible misalignment [15], thus causing some uncertainty in quantitative results. However, the general trend discussed above is robust.
In general one expects to see complementary effects in dispersion and EDC and MDC peak widths as they reflect the quasiparticle self-energy. The self-energy can be easily extracted from an ARPES experiment if is much smaller than the energy. In this case MDC and EDC methods give the same result for the peak position and for the peak width interpretable as and parts of the self energy respectively. In high Tc’s extracting the self energy from ARPES is harder because the EDC peak energy is comparable to the peak width for . However, assuming weak k-dependence of the [4], the deviation of the MDC dispersion from the LDA calculation gives real part of the self energy and the MDC peak widths represent imaginary part [17]. Fig.2 (a1-c1) shows MDC widths in momentum space along various cuts. The corresponding energy width is given by the momentum width of the MDC peak multiplied by the velocity if the scan direction is along the energy gradient direction. In our geometry this condition is satisfied only along the nodal direction. In Figure 2 d) we plot the energy width from MDC together with EDC width. The step effect in MDC energy width is due to linear approximation to the dispersion in determining the velocity, smoother transition is expected for a less dramatic behavior. EDC peak widths do not simply give in the case of broad peaks. Furthermore, EDC data is complicated by energy-dependent background and Fermi cut-off. Nevertheless, the EDC data still indicate a more abrupt change in the width at the energies corresponding to the kink in the dispersion, as shown in Fig. 2 (d-f). We feel that the qualitative consistency between MDC and EDC results is sufficient to make the case for the strong self energy effect in the data. The lack of quantitative agreement between EDC and MDC is a manifestation of the subtle lineshape issues discussed above.
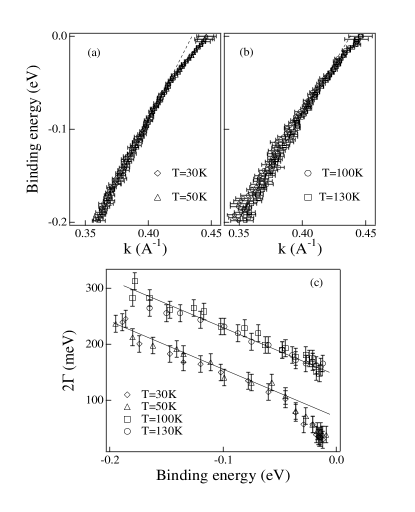
The dispersions determined from the OD sample above along the to () direction are shown in Fig. 4a), while the low temperature dispersions () are reported in 4b) . The dispersions exhibit the same break structure as contrasted to the straight line. The change of dispersion is more difficult to see in the high temperature data compared to low temperature data, but a weak residual effect still appears to be present. In Fig. 4c)we show the temperature dependence of the EDC width. We see a clear change in around in the low temperature data, but the effect is harder to see above Tc.
We now discuss the origin of the strong self-energy effect near . The first possibility that comes to mind is the electron-phonon interaction as there are phonons of this energy scale in the compound [18]. This would explain the persistence of the feature throughout the Brillouin zone and the persistence of the feature above the superconducting transition temperature, since phonons are and T independent. However, as shown recently [11], the dispersion tends to recover to the one-electron result when the energy is well above the typical phonon energies, with the total range of the perturbed dispersion below equal to half the Debye temperature. In our case, there is no indication that the dispersion will recover to LDA behavior and the high energy part of the data cannot be fit with a line passing through the Fermi surface crossing. Another problem with the phonon scenario is that it is not a natural explanation on why the effect is stronger in underdoped sample.
The second and in our view most likely possibility is the electron coupling to collective magnetic excitations [6, 7, 8, 9, 10]. The neutron mode is found below near at with a width of in system [19]. The energy scale of the neutron mode is consistent with the feature seen in our experiments. This picture is also consistent with the fact that the underdoped sample shows stronger effect than the overdoped one [19, 20]. The broadness of the neutron peak in this compound makes it possible to explain the persistence of the effect throughout the Brillouin zone. Mode’s energy decrease in overdoped sample and the fact that the mode is mainly seen below also supports this interpretation of our data. However, we caution that the exact temperature where this mode turns on is a sensitive function of doping and impurities [21]. Of course, we cannot rule out the possibility of a combination of effects due to phonons and magnetic excitations because both have similar energy scales. We should note that the coupling of a quasiparticle to collective excitations was previously discussed, but in a very different context [22, 23]. The break in quasiparticle dispersion of optimally doped sample along the nodal direction is also present in the data of Valla [14]. However, these authors did not elaborate on this issue and they suggested the absence of energy scale in the problem.
The third possibility is that we see the effect related to the opening of the superconducting gap which is of the order of in this compound. Because the anti-nodal direction near has a very high density of states, we expect an effect when this energy scale is reached [24]. The down side of this scenario is that we do not have theoretical calculations on specifics of the effect. At this point, we do not feel that we can rule out possible interpretation of the data based on the stripe scenario [25, 26, 27, 28, 13] where the 50meV kink in the dispersion reflects the characteristic frequency of the fluctuating stripes.
In summary, we have studied doping, momentum and temperature dependence of the quasiparticle dispersion using ARPES with very high momentum resolution. We have uncovered an energy scale of where the quasiparticle dispersion shows a strong change. This effect is seen in all directions, and is stronger in the underdoped sample. The effect is strongest in data below . We expect that the data presented here is an important part of the puzzle related to high superconductivity.
We would like to thank J. D. Denlinger for the help with data analisys software. We would like to thank P. D. Johnson,B. O. Wells, A. Fedorov, T. Valla, S.C. Zhang, D.J. Scalapino, Steve Kivelson, D.H. Lee, Bob Laughlin, and P.A. Lee for discussion. The experiment was performed at the Advanced Light Source of Lawrence Berkekely National Laboratory. The Stanford work was supported by NSF grant through the Stanford MRSEC grant and NSF grant DMR-9705210. The work at ALS was supported by DOE’ Office of Basic Energy Science, Division of Materials Science with contract DE-AC03-76SF00098. The SSRL’s work was also supported by the Office’s Division of Materials Science.
REFERENCES
- [1] W. L. MacMillan and J.M.Rowell, Superconductivity, R.D.Parks Ed., Vol.1 (M.Dekker Inc., New York, 1969, Chap.11, p. 561)
- [2] D. J. Scalapino, J.R.Schrieffer, J.W.Wilkins, Phys. Rev. 148, 263(1966)
- [3] D. J. Scalapino, Superconductivity, R.D.Parks Ed., Vol.1 (M.Dekker Inc., New York, 1969, Chap.11, p. 561)
- [4] C. M. Varma, et al., Phys. Rev. Lett. 63, 1996 (1989)
- [5] S. Chakravarty et. al, Phys. Rev. B 39, 2344 (1989); S. Sachdev and J. Ye, Phys. Rev. Lett. 69, 2411 (1992); A. Sokol and D. Pines, Phys. Rev. Lett. 71, 2813 (1993); V. J. Emery ans S. A. Kivelson, Phys. Rev. Lett. 71, 3701 (1993); C. Castellani et. al, Phys. Rev. Lett. 75, 4650 (1995); C. M. Varma, Phys. Rev. B 55, 14554 (1997); R. B. Laughlin, cond. mat. 9709195
- [6] J. Rossat-Mignod et. al, Physica C 235, 59(1994)
- [7] H. F. Fong et. al, Phys. Rev. Lett. 78, 713 (1997)
- [8] M. Arai et. al,Phys. Rev. Lett. 83, 608 (1999)
- [9] P. Dai et. al,Phys. Rev. Lett. 77, 5425 (1996)
- [10] E. Demler and S.-C. Zhang, Phys. Rev. Lett. 75, 4126 (1995)
- [11] T.Valla et al., Phys. Rev. Lett. 83, 2085 (1999); M. Hengsberger et al., Phys. Rev. Lett. 83, 592(1999); E. Rottenberg et al., preprint;
- [12] S.Massidda et al., Physica C 152, 251(1988); H. Krakauer and W.E.Pickett, Phys. Rev. Lett. 60, 1665 (1988)
- [13] X. J. Zhou et al., Science 286, 268 (1996)
- [14] T. Valla et al., Science 285, 2110 (1999)
- [15] In figure 2 we plot dispersions as a function of angle. The change of velocities with angle is up to per degree. Although our angular resolution is degrees, the error in absolute alignment is degree, which is the main source of uncertainty. However, for both dopings we sampled over the whole Brillouin zone. This gives us internal reference point for alignment, since velocities decrease as we go away from nodal direction. We have measured two overdoped samples at three photon energies. The velocities we determined for both samples for low binding energy part are within . There’s no detectable change in velocity with doping or photon energy in this region. Other groups reported [14] and [16] for the low binding energy velocities. For the high energy part the difference with samples is also negligible. For the sample we measured at three photon energies we find . For a sample of the same doping other experiment gave .
- [16] A. Kaminski et al., cond-mat 9904390v2
- [17] P. V. Bogdanov et al., unpublished
- [18] M. G. Zemlyanov et al. JETP 77, 148 (1993), M. G. Zemlyanov et al., Superconductivity: Physics, Chemistry, Technology 6, 435 (1993)
- [19] H. F. Fong et. al, Nature 398, 588 (1999)
- [20] H. He et. al, cond-mat 0002013
- [21] P.Dai et. al, Science 284, 1344 (1999)
- [22] Z. -X.Shen and J. R. Schrieffer, Phys. Rev. Lett. 78, 1771 (1997)
- [23] M. R. Norman et al., Phys. Rev. Lett. 79, 3506 (1997); M. R. Norman and H. Ding, Phys. Rev. B 57, 11089 (1998)
- [24] A. R. Bishop et al., Phys. Rev. Lett. 61, 2709 (1998)
- [25] V. J. Emery , S. A. Kivelson, and O. Zachar, Phys. Rev. B 56, 6120 (1997).
- [26] J.Zaanen, Journ of Phys.Chem of Solids. 59,1769 (1998) and references therein.
- [27] J. M. Tranquada et al. Nature 375, 561 (1995).
- [28] A.Bianconi et al., Phys. Rev. Lett. 76, 3412 (1996).