[
Pearling Instabilities of Membrane Tubes with Anchored Polymers
Abstract
We have studied the pearling instability induced on hollow tubular lipid vesicles by hydrophilic polymers with hydrophobic side groups along the backbone. The results show that the polymer concentration is coupled to local membrane curvature. The relaxation of a pearled tube is characterized by two different well-separated time scales, indicating two physical mechanisms. We present a model, which explains the observed phenomena and predicts polymer segregation according to local membrane curvature at late stages.
PACS numbers: 87.16.Dg, 68.10.-m ]
Single-component phospholipid membranes have been the focus of intense interest in recent years, as the simplest model system of biological membranes [3]. The latter are highly complex systems, comprised of a bilayer consisting of many types of lipids as well as a mesh of macromolecules such as proteins and polysaccharides, which participate in a large variety of cellular processes. A natural step to mimic this complexity in a simple model system is to study the association of polymeric molecules with self-assembled single-component phospholipid membranes[4].
Experiments with polymers, which associate with membranes by anchoring, have revealed changes in the bending moduli of bilayers of single-tailed surfactants [5], and striking morphological changes in vesicles[4, 6, 7]. Anchoring occurs by the penetration of a number of hydrophobic side-groups grafted along a hydrophilic backbone into a bilayer. Hollow tubular vesicles incubated in a solution of anchoring polymers having a polysaccharide backbone develop a pearling instability, above a threshold polymer concentration[8]. This instability was not observed with purely hydrophilic polymers, and was effected by hydrophobic groups alone (without the backbone), but only at concentrations five orders of magnitude higher than with anchoring polymers.
In this experimental and theoretical study we investigate the mechanisms responsible for pearling in our system. It has been suggested that the induction of curvature by the anchors, which sink into the membrane to a depth of half a bilayer, may constitute a mechanism which drives the pearling instability [4]. We present a novel nonequilibrium experiment, which shows that two independent mechanisms – spontaneous curvature and area difference – contribute to the pearling phenomenon. We also present new experimental and theoretical findings showing inhomogeneous shapes at late stages.
In our experiments, vesicles were made of stearoyl-oleoyl-phosphatidyl-choline (SOPC) with alkyl chains. The polymer used was hydrophilic dextran with a molecular weight of , functionalized both with palmitoyl alkyl chains and dodecanoic NBD chains as fluorescent markers. The anchors are distributed statistically along the backbone, spaced four persistence lengths apart on average (1 alkyl chain per 25 glucose units). droplets of SOPC in a 7:1 chloroform-methanol solution () were placed on a glass coverslip forming small lipid patches. The sample was prehydrated for 20 minutes under water-saturated nitrogen, then hydrated with potassium buffer at pH 6.5. A large number of hollow tubes with one or more lamellae formed after hydration, connected to the lipid patch. The latter constitutes a reservoir with which the tubes can exchange lipid molecules. Experiments were conducted at room temperature, insuring that the membranes were in a fluid-like state. This allowed free diffusion of both lipids and anchored polymers along the bilayers. A drop of polymer solution of a given concentration was introduced through one of the cell sides. The polymer was added after the tubes were formed, and we therefore assume that it anchored mostly on the outermost leaflet of the membrane. Its concentration on the membrane grew from zero as more and more chains anchored from solution. Events were observed by phase contrast and fluorescence microscopy and recorded on video. The NBD markers were excited with an argon laser (), and observed with a CCD camera.
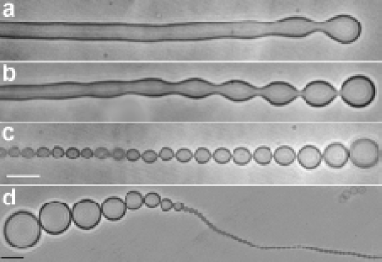
Fig. 1 shows a tube undergoing pearling after addition of polymer. The instability typically starts near the end cap of the tube (Fig. 1a), and gradually propagates along the axis (Fig. 1b). This is presumably since the polymer, diffusing from the side of the chamber, first reaches the tip of the tube. Existing pearls become gradually more spherical (Fig. 1c). The rate at which pearls form depends on the number of lamellae in the walls of the tube, as well as on the concentration of polymer in the water (), varying from several seconds to many minutes. A salient feature of Fig. 1c is the increase in pearl size towards the end of the tube. This size gradient becomes much more pronounced at very long times, as Fig. 1d illustrates for another vesicle. The string of pearls separates into a set of small, nearly-uniform spheres connected to a group of much larger spheres.
We have studied the onset of pearling by measuring the wavelength of the fastest growing mode, , just above threshold, as a function of the radius of the unpearled tube, . Within experimental accuracy is linear in , with a slope . This result agrees well both with the value predicted by theoretical models based on induced curvature as the driving mechanism [9], and with experimental results on pearling instabilities in single-tailed surfactant systems[10]. In tension-induced pearling [11], and thus our measurement excludes pearling due to polymer or flow-induced tension in our system.
Polymers anchoring to one side of a membrane can induce curvature by two mechanisms. The first is an increase in the area of the outermost monolayer into which anchors sink [12]. The second mechanism is a local deformation of the membrane which can be induced either by the anchors regarded as inclusions [13], or by an entropic pressure exerted by the polymer backbone [14]. These mechanisms form the basis of two models that describe the tendency of a membrane to display curvature [15]: the area difference elasticity model (ADE) and the spontaneous curvature model (SC), respectively. Calculations of equilibrium shapes of vesicles with cylindrical symmetry based on both the SC and ADE models indeed yield pearled shapes of constant mean curvature called Delaunay surfaces [16]. The equilibrium shape is not sensitive to the pearling mechanism.
Nevertheless, the dynamics of pearling may allow us to distinguish between the two mechanisms and reveal their presence, since they are characterized by well-separated relaxation time scales. Inhomogeneities in both area difference and spontaneous curvature decay diffusively [17]. The relaxation of spontaneous curvature is associated with polymer diffusion in the membrane. The relevant diffusion constant was measured for various macromolecules and falls in the range of [18]. Area difference relaxes via the sliding of one monolayer with respect to the other, and does not involve diffusion of molecules over large distances. The diffusion constant associated with ADE can be estimated from dimensional analysis to be , where is the compression modulus of the membrane, and is the friction coefficient between the two leaflets of a bilayer. Experimental estimates of these parameters lead to [17]. Changes in the shape of a vesicle are coupled to motion of the surrounding water, where the energy dissipated in the water is of the order of the curvature energy of the bilayer. From dimensional analysis we find that for both mechanisms, ADE and SC, the diffusion constant associated with the displacement of water is , where is the bending modulus of the membrane and is the viscosity of water. Thus, it is difficult to differentiate between hydrodynamical and ADE effects by measuring the diffusion constant, but it should be easy to distinguish between the SC and ADE mechanisms.
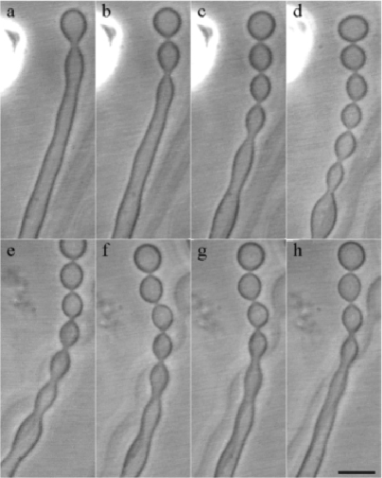
To study the relaxational dynamics, a micropipette was used to deliver locally a small volume () of polymer solution of concentration close to a tube (Fig. 2). Fluorescence images show that the polymer was indeed concentrated in a local region shortly after the injection. Pearling occurred, after an induction time in which enhanced undulations were observed (Figs. 2a-2d). The injection of the polymer was stopped after the pearled region increased to a length of order . The pearled region then shrank gradually (Figs. 2e-2h) as pearls opened up one at a time starting with those farthest from the region of polymer injection. This decay process took several minutes. Fluorescence images show that the amount of polymer in the surrounding water is negligible during the decay.
We measured the length of the pearled region, , as a function of time during the decay process. For diffusive decay, we expect , where is the relevant diffusion constant and is a constant. Figure 3 is a typical example of the dependence of on time (measurements on several tubes yielded similar results). The system exhibits diffusive behavior at early times with a diffusion constant of . We attribute this decay to a combination of ADE and hydrodynamical effects. At later times there is a sharp crossover to a much slower diffusive behavior with . According to our estimates, this corresponds to polymer diffusion, and is associated with the SC mechanism. Our results thus provide clear evidence that both ADE and SC mechanisms influence the pearling instability.
We now carry out a theoretical analysis of the pearling phenomena in the case of global application of the polymer (Fig. 1). We consider closed vesicles with polymer molecules only on the outer side of the vesicle, and assume that pearling is a result of the SC mechanism (All our predictions, except for the inhomogeneities in polymer concentration, apply equally well to the ADE model). In contrast with standard curvature models [15], the spontaneous curvature in our system is a local quantity. We assume that the spontaneous curvature is proportional to the polymer concentration on the membrane, . is the fraction of the membrane area covered by polymer molecules at the position , and takes values in the interval . is the spontaneous curvature induced by full coverage of the polymer. We further assume that the observed vesicle shapes are close to the equilibrium shapes under the constraints of constant vesicle volume and membrane area. These shapes can be obtained by minimizing the free energy of the membrane in the presence of the polymer. The simplest free energy for our system is a sum of the curvature energy and the entropy of mixing of the polymer:
| (1) | |||||
| (2) |
where is the local mean curvature, is the characteristic linear size of an anchored polymer molecule and the integration is over the area of the membrane. In principle, the effects of gradients of polymer concentration should also be included in the free energy. However, the inhomogeneities at equilibrium do not induce an extensive free energy increase (see below), and we therefore ignore such terms.

We have measured using the pipette aspiration technique [19]. Structures with radii smaller than optical resolution () were observed in our experiments, giving a lower bound of on the spontaneous curvature induced by the polymer. Finally, can be estimated as the radius of gyration of a polymer performing a two dimensional random walk on the membrane. Since the hydrophilic backbone is in water, we assume a good solvent in semi-dilute conditions, giving a radius between 40 and .
We consider very long, cylindrically symmetric vesicles and ignore the existence of the end caps, since the length of most of the experimental tubes is larger than their radii by two orders of magnitude. To find the equilibrium configuration of the system, the free energy (2) was minimized with respect to the vesicle shape as well as the local polymer density. This was done under the constraints of constant vesicle volume, membrane area and total number of polymer molecules.
Ideally, the equilibrium configuration of the system would have a homogeneous polymer distribution and a curvature everywhere. Such a configuration minimizes the energy and maximizes the entropy simultaneously. This is indeed possible for a range of values of . For example, a vesicle with volume-to-area ratio can have the shape of a cylinder of radius and curvature . Another shape, having the same value of , is a chain of identical spheres of radius connected by infinitesimally narrow necks. In this case everywhere. In fact, the vesicle’s curvature may take any intermediate value, , because for each of these curvatures there corresponds a Delaunay shape [20], with the same value of . On the other hand, it is not possible to construct a shape of constant curvature for or for .
In our experiment the polymer adsorbs onto the membrane gradually. Therefore, at the very early stages of the experiment , and the shape of constant curvature which minimizes the energy is a cylinder of radius and curvature . This is consistent with our experimental observations. In principle, we also have to consider possible inhomogeneities in membrane curvature. However, our calculations show that for small such inhomogeneities only increase the free energy.
At intermediate stages of the experiment the polymer concentration is in the range , and long vesicles are expected to have a Delaunay shape. Indeed, the shapes of vesicles we observe at intermediate stages of the experiment are similar to Delaunay shapes. Such pearled shapes have already been observed [8], and the importance of Delaunay shapes for this system has been discussed in the literature [16, 21].
The situation becomes more interesting at late stages of the experiment when exceeds the value . In this case, the best Delaunay shape is a chain of identical spheres of radius and curvature . However, a detailed calculation (to be presented elsewhere) shows that a configuration consisting of a chain of small spheres connected by infinitesimal necks to each other and to one large sphere has the lowest free energy.
The small spheres have polymer density and radius . The energy of this subsystem vanishes, since its curvature is . The large sphere has radius and polymer density , and plays the role of a reservoir for the excess volume and polymer molecules. The ratios and can be calculated numerically as functions of the average polymer density, the area of the system and its volume. For the values of the model parameters discussed above we obtained and . This ratio of the radii is consistent with the experimental configurations seen at long times, where chains of very small spheres coexist with few very large spheres, all connected by narrow necks (see Fig. 1d).
The strong inhomogeneity in polymer concentration predicted by the theory, is particularly interesting because it may show a qualitative difference between predictions of the local SC model and those of ADE models. The latter does not differentiate between polymer molecules and lipids; i.e., exchanging polymers with a larger number of lipids of the same total area does not change the energy. One can always use such exchanges to turn an inhomogeneous polymer distribution into a homogeneous one of higher entropy without changing the energy of the vesicle. Hence, ADE models predict a homogeneous polymer distribution. In the local SC model, inhomogeneities in polymer distribution induce the same undesirable decrease in the entropy of mixing. However, inhomogeneities lower the energy, and our calculations show that for reasonable parameter values, the reduction in energy does lead to sizable inhomogeneities. We intend to measure the polymer concentration on the membrane to test this interesting theoretical prediction.
We thank L. Jullien, for his help and encouragement, and R. Lipowsky, E. Moses and S. Safran for useful exchanges. This research was supported by The Israel Science Foundation - Recanati and IDB Group Foundation and The Minerva Foundation. V.F. acknowledges support from The Research Council of Norway (NFR).
REFERENCES
- [1]
- [2] Present address: Dept. of Engineering, Stord/Haugesund College, Bjørnsonsgt 45, N-5528 Haugesund, Norway.
- [3] U. Seifert and R. Lipowsky, in Structure and Dynamics of Membranes, edited by R. Lipowsky and E.Sackman (Elsevier Science B.V., Amsterdam, 1995).
- [4] H. Ringsdorf, B. Schlarb, and J. Venzmer, Angew. Chem. Int. Ed. Engl. 27, 113 (1988).
- [5] Y. Yang, R. Prudhomme, K. M. McGrath, P. Richetti, and C. M. Marques, Phys. Rev. Lett. 80, 2729 (1998).
- [6] J. Simon, M. Kühner, H. Ringsdorf, and E. Sackmann, Chem. Phys. Lip. 76, 241 (1995).
- [7] V. Frette, I.Tsafrir, M. Guedeau-Boudeville, L. Jullien, D. Kandel, and J. Stavans, Phys, Rev. Lett. 83, 2465 (1999).
- [8] H. Ringsdorf, J. Venzmer, and F. M. Winnik, Angew. Chem. Int. Ed. Engl. 30, 315 (1991).
- [9] P. Nelson, T. Powers, and U. Seifert, Phys. Rev. Lett. 74, 3384 (1995).
- [10] S. Chaieb and S. Rica, Phys. Rev. E 58, 7733 (1998).
- [11] R. Bar-Ziv and E. Moses, Phys. Rev. Lett. 73, 1392 (1994).
- [12] B. L. S. Mui, H. G. Dobereiner, T. D. Madden, and P. R. Cullis, Biophys. J. 69, 930 (1995).
- [13] S. Leibler, J. Physique 47, 507 (1986).
- [14] R. Lipowsky, Europhys. Lett. 30, 197 (1995).
- [15] U. Seifert, K. Berndl, and R. Lipowsky, Phys. Rev. A 44, 1182 (1991).
- [16] H. J. Deuling and W. Helfrich, Blood Cells 3, 713 (1977).
- [17] U. Seifert and S. A. Langer, Europhys. Lett. 23, 71 (1993).
- [18] P. F. F. Almeida and W. L. C. Vaz, in Structure and Dynamics of Membranes, edited by R. Lipowsky and E.Sackman (Elsevier Science B.V., Amsterdam, 1995).
- [19] E. Evans and W. Rawicz, Phys. Rev. Lett. 79, 2379 (1997).
- [20] J. Eells, Math. Intelligencer 9, 53 (1987).
- [21] O. Y. Zhong-can and W. Helfrich, Phys. Rev. A. 39, 5280 (1989).