Self-organization, Localization of Shear Bands and Aging in Loose Granular Materials
Abstract
We introduce a mesoscopic model for the formation and evolution of shear bands in loose granular media. Numerical simulations reveal that the system undergoes a non-trivial self-organization process which is governed by the motion of the shear band and the consequent restructuring of the material along it. High density regions are built up, progressively confining the shear bands in localized regions. This results in an inhomogeneous aging of the material with a very slow increase in the mean density, displaying an unusual glassy like system-size dependence.
PACS numbers: 45.70.-n, 45.70.Mg, 05.65.+b
A large class of materials are handled in the form of dispersed solid grains at some stage of their processing. Thus the description of the rheological properties of suspensions, pastes and dry granular media is a key question which controls the ability of mixing, storing, transporting etc, these disperse media [1, 2, 3]. Granular systems constitute an intermediate state of matter between fluids and solids [4, 5]: they flow like fluids but they also build piles indicating that a non-vanishing static shear stress is present which is characteristic of solids. From this point of view it is also of major interest to understand the shearing process in these systems. A number of experiments have been carried out on the shear process in granular materials [6, 7]. Most of these are triaxial tests [7, 8] to determine macroscopic properties such as the shear stress or the volumetric strain, as a function of the shear strain.
The intimate interplay between the geometrical arrangements and the frictional properties of the grains determines the precise form of the rheological behavior to be used at a continuum level. The underlying question is the identification of relevant internal variables. The most obvious one is the density of the sample, which can be made to vary over a wide range by the method of preparation. Compared to other parameters describing the texture (e.g. fabric tensors accounting for the distribution of contact orientations) the density has the most drastic impact on the stress needed to shear the material as well as on the mode of shearing; from an apparent homogeneous strain for loose packings to a localized steady shear band for dense assemblies [9]. The coupling of the density to the shear properties can be understood through the concept of dilatancy [6].
A related question is whether statistical fluctuations have an impact on macroscopic properties. Lately, there has been an upsurge of interest in trying to characterize the large stress fluctuations [10, 11, 12, 13] in silos, Couette flow or slider block geometries, or to understand the statistics of interparticle contact forces [14]. Recently, spectacular experiments in two-dimensional Couette shear cells were carried out [13] where the movement and stress of individual particles were monitored in order to describe the inner structure and the force network in the sheared granular material. It was demonstrated that stationary motion is accompanied by large stress fluctuations due to the formation and breakdown of arches. Large fluctuations were also found in three dimensional steady state shear cells [15].
This issue has also been raised by the results of recent numerical simulations of rigid grain assemblies [16], where even at low densities, the shearing which appears as homogeneous over long times, in fact consists of a succession of sudden changes of quasi-instantaneous and localized strain fields. This observation suggests that the transition from the particle based description to the continuum one requires the detailed understanding of the statistical features associated with these sudden changes.
In this Letter we present a simple model for the shearing of a granular medium in loose samples. We describe the strain field at every instant as a shear band, chosen through a global optimization procedure, which is equivalent, as we shall see later, to searching for the ground state of a directed polymer in a random potential [17, 18]. However, this potential is not a priori frozen in but has a self-organized development due to our procedure of choosing and changing the shear band. Though very simple and with only the minimum of ingredients, the model shows that the density of the medium increases anomalously slowly. Further we are also able to predict on the basis of this model, that large scale inhomogeneities build up in a system subject to a steady shear. This could be an interesting feature to compare with experiments.
Let us consider a shear process, assumed to be invariant along the shear direction ( in Fig. 1). This geometry is appropriate for instance, in an annular shear cell of large radius [15]. We consider moreover a continuum
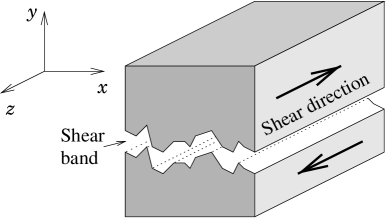
description, valid on scales much larger than that of individual grains. We now introduce a fundamental assumption of our model: We assume that the instantaneous strain field is always localized on a single shear band [4, 19]. Experimentally, it is known that shear bands have a typical width of about ten grain diameters. Thus at a continuum level, the velocity field is indeed discontinuous across the shear band. From the geometry of our set-up, the shear band must be a continuous surface due to topological constraints (Fig. 1). Further, we assume that because of the translational invariance along the axis, the system can be reduced to a two dimensional one in the - (cross-section) plane, through an averaging over the direction.
The basic hypothesis of the localization of the shear on the shear band at all times, is not as restrictive as it may appear. We only refer here to instantaneous shear rates, and provided the shear band changes rapidly enough, coarse-graining the strain field in time may produce a uniform shear rate. Experimentally, though it is very difficult to have direct access to the instantaneous shear rate, large fluctuations found in the shear stress may indicate that the shear is never quite uniform, even at early times. As mentioned earlier, this seems indicated also by numerics [16].
Initially we consider a loose-packed sample. At a suitably coarse-grained scale the medium can be described as a continuum, where the density is a random function displaying fluctuations around a mean value. Under a constant normal load, a threshold shear force (or torque for an annular shear cell) has to be applied to impose a non-zero strain. Locally, after integration along the axis, the density controls the threshold shear force. Although this is inessential, for simplicity we assume that the ratio of shear to normal stress, i.e. the friction coefficient, increases linearly with density. As mentioned earlier, the texture of the medium also contributes to the friction coefficient. However, since we consider only shear in a fixed orientation, a single scalar parameter combining density and texture should suffice. This parameter is called “density” for short and is denoted by . Thus at any time the state of the medium is characterized by this field.
We determine the shear band (path in the () plane) by the following three conditions: a) it is continuous, b) it spans the sample in the direction without overhangs and c) the sum of the density along it is minimal among all possible paths satisfying a) and b). One can recognize that this is the well known problem of finding the ground state of a directed polymer in a random potential [17].
Relative motion of the particles takes place within the shear band while the rest of the sample remains still. Small movements can totally rearrange the local structure [15, 20] and thus may induce large changes in the local density. We simplify this complex behavior by renewing the density only along the shear band, by independent random values taken from a fixed distribution. After this, a new shear band is again located as described above. Thus the shear process consists of a succession of localized slips occurring at very small time scales. We note that in characterizing this process, in the spirit of a continuum modeling, we ignore potential stress inhomogeneities in the medium. It is a simplifying assumption of the model to relate the shear band localization only to the density, and not to the full solution of the local stress distribution.
In order to be able to simulate the above model we discretized it on a square lattice either with principle axis parallel to and and considering first and second nearest neighbours, or tilted by considering only nearest neighbours. Periodic boundary conditions are imposed in the direction. Simulations with site and bond versions were also carried out leading essentially to the same results. We consider here square samples with system size with varying from to . Initially a density (a random number uniformly distributed between 0 and 1) is assigned to every bond . We define the instantaneous shear band as the spanning directed path along which is minimal ( applying the usual transfer matrix method [17]). Once the shear band is found the bonds belonging to it are assigned new values taken from the same uniform distribution as used initially. We repeat this process and monitor different properties of the system [21].
We define the average density as the mean value of the density of the sites not belonging to the shear band. This definition, as well as our procedure of choosing the least and changing it, guarantees that the average density is a monotonically increasing function of time.
The monotonic behavior and the bounded nature of the average density () ensure that it has an asymptotic value. In finite samples this is equal to 1. In Fig. 2 we have plotted the deviation of the average density from this asymptotic value. At early times () the rescaled curves go together independently of the system size; later non-trivial system size effects can be observed. The relaxation to the asymptotic value gets slower as the system size increases.

Since the system evolves entirely through the process of choosing and changing the shear band, we have monitored the following two important quantities related to the shear band: The Hamming distance (which is the number of different sites between successive shear bands) (Fig. 3a) and the average density of the sites along the shear band before change (Fig. 3b). It is apparent from the figure that there is a characteristic time of , below which the distance is essentially constant and equal to the system size and the density of the shear band is roughly constant. This can be understood qualitatively from the following considerations. Since the very first shear band is equivalent to the ground state conformation of a directed polymer in a random potential, we know from this analogy that the mean density along this shear band is much less than [17]. Once the path is refreshed, its mean density increases to . The next shear band tends to be repelled by the previous one since there still exist many spanning paths with a lower density. Thus at early times, two successive shear bands differ completely (Fig. 3a) and the density of the shear band remains more or less the same (Fig. 3b). This initial phase should last until on average all sites have been refreshed a few times, a number of time steps of the order of .
The absence of overlap between successive shear bands in this early time regime reflects the fact that no well defined shear band can be observed in loose granular media. Experimentally this is connected to the difficulty in quantifying fluctuations, when the mean shear strain is of small magnitude. So what is observed is seemingly a homogeneous shear.
There is a transition regime up to where we still have a good quality data collapse. In this regime both curves and start to fall off. The decreasing distance indicates an increasing persistence of


the shear band. As the average density of the system increases (Fig. 2) the density of the minimal path also grows and thus the repulsive interaction between two consecutive shear bands progressively fades away. Finally, by the end of the transition regime, the interaction becomes attractive and a much slower relaxation process takes place.
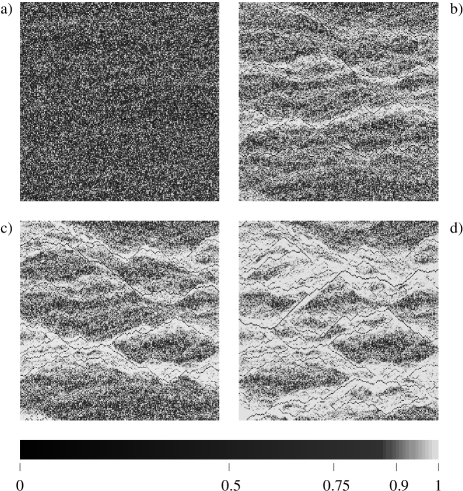
The above measurements point to a localization of the shear band, induced by the imposed dynamics. In order to understand better how this comes about we present density snap shots of the system at four different instances (Fig. 4) varying from to . We observe that initially (Fig. 4a) the density appears homogeneously distributed. Then progressively high density regions become apparent. The mechanism for the formation of these regions is the following: As the average density increases, the interaction between successive shear bands becomes attractive and the path gets restricted in space. Small fluctuations of the shear band then lead to a density increase in this region. The presence of these surrounding areas of high densities increases the attraction of successive shear bands, thus leading to a positive feedback process resulting in regions of finite width and very high density where the shear band is trapped in the middle, in a “canyon-like” structure (black lines surrounded by white in Figs. 4c and d).
The escape from the above described trap is only possible via a jump to another local minimum. The probability of such a jump decreases faster than exponentially with increasing density. Thus as time grows, the average jump size decreases even though large regions with relatively small densities remain. The progressive self-quenching of the shear band in the system is responsible for the anomalous slow increase in the average density. This inhomogeneous aging and extremely slow dynamics is reminiscent of a glassy behavior.
In order to get some more insight into the slow dynamics of the system we have studied the same model on a hierarchical lattice. The simple geometry allows for a detailed analytic treatment of the model. This study will
be reported elsewhere [22]. Here we only summarize the main features of this analysis. The slow density increase and strong system size dependence seen on the square lattice are also seen in the hierarchical one. Here we can show that decreases as a sum of power-laws with a vanishing exponent depending on the lattice size, i.e. the number of generations of the hierarchical lattice. Further, the early time regime is a single function of as for the square lattice, while the late time regime scales instead as , where .
In spite of its simplicity, the model we have introduced displays some interesting consequences of collective organization of density fluctuations in a granular assembly. Although only time-independent rules are introduced, the simulations reveal a slow densification which occurs together with a non-trivial patterning of the density in the sample. Simultaneously, the shear strain is localized on shear bands which acquire progressively a longer and longer persistence. The occurrence of high density regions confining the shear band is a feature which should be observable using X-ray tomography as recently performed in triaxial tests by Desrues et al[9].
Acknowledgment: This work was partially supported by OTKA T024004 and T029985.
REFERENCES
- [1] D. Bideau and A. Hansen, Disorder and granular media, North Holland, Amsterdam, (1993).
- [2] R. P. Behringer and J. T. Jenkins eds., Powders and Grains’97, Balkema, Rotterdam, (1997).
- [3] H. J. Herrmann, J. P. Hovi and S. Luding eds., Physics of Dry Granular Media , NATO ASI E 350, Kluwer Acad. Pub., (Dordrecht, 1998).
- [4] D. M. Wood, Soil Behaviour and Critical State Soil Mechanics , Cambridge University Press, New York (1990).
- [5] H. M. Jaeger, S. R. Nagel and R. P. Behringer, Rev. Mod. Phys. 68, 1259 (1996).
- [6] O. Reynolds, Philos. Mag. 20, 469 (1885).
- [7] D. M. Wood and M. Budhu, Proc. Int. Symp. on Soils under Cyclic and Transient Loading Swansea, (1980).
- [8] A. Ahadi and S. Krenk Non-Associated Plasticity for Soils Nordic Association for Computational Mechanics (Stockholm, Sweeden, 1998).
- [9] J. Desrues, R. Chambon, M. Mokni, F. Mazerolle, Geotechnique 46, 529 (1996).
- [10] M-L. Tan and I. Goldhirsch, Phys. Fluids 9, 856 (1997); M. Sasvári, J. Kertész and D.E. Wolf in Traffic and Granular Flow’97, p. 141, Eds. M. Schreckenberg and D. E. Wolf (Springer, 1998).
- [11] P. Claudin and J. -P. Bouchaud, Phys. Rev. Lett. 78, 231 (1997); M. E. Cates, J. P. Wittmer, J.-P. Bouchaud and P. Claudin, Phys. Rev. Lett 81, 1841 (1998).
- [12] S. Nasuno, A. Kudrolli, A. Bak and J. P. Gollub, Phys. Rev. E 58, 2161 (1998); F. Lacombe, S. Zapperi and H. J. Herrmann cond-mat 9908359.
- [13] C. T. Veje, D. W. Howell and R. P. Behringer, Phys. Rev. E 59, 739 (1999).
- [14] C. -H. Liu et al Science 269, 513 (1995); F. Radjai, M. Jean, J.-J. Moreau and S. Roux, Phys. Rev. Lett. 77, 274 (1996); F. Radjai, D. E. Wolf, M. Jean and J. J. Moreau, Phys. Rev. Lett. 80, 61 (1998).
- [15] B. Miller, C. O’Hern and R. P. Behringer, Phys. Rev. Lett. 77, 3110 (1996); R. Khosropour, J. Zirinsky, H. K. Pak and R. P. Behringer, Phys. Rev. E 56, 4467 (1997).
- [16] J.-J. Moreau, unpublished (1999).
- [17] M. Kardar, Phys. Rev. Lett. 55, 2923 (1985); M. Kardar, G. Parisi and Y. C. Zhang, Phys. Rev. Lett. 56, 889 (1986); Y. C. Zhang and T. Halpin-Healy, Phys. Rep. 254, 215 (1995).
- [18] The relevance of the directed polymer model to fracture phenomena was suggested some time ago (K. J. Måløy et al., Phys. Rev. Lett. 68, 213 (1992); J. Kertész, V. K. Horváth and F. Weber, Fractals 1, 67 (1993)). Here we demonstrate that this model also gives insight into the mechanism of failure formation in a very different context.
- [19] J. Török and S. Roux, Heterogeneous Mohr-Coulomb plastic material, To appear in Granular Matter.
- [20] S. Ouaguenouni and J.-N. Roux, Europhys. Lett. 32, 449 (1995).
- [21] This is in the spirit of the Bak-Sneppen model (P. Bak and K. Sneppen, Phys. Rev. Lett. 71, 4083 (1993)). However, as we show, our model is asymptotically not critical.
- [22] J. Török, S. Krishnamurthy, J. Kertész and S. Roux, in preparation.