Metal-insulator transition in 2D: resistance in the critical region
Abstract
The goal of this paper is to highlight several issues which are most crucial for the understanding of the “metal-insulator transition” in two dimensions. We discuss some common problems in interpreting experimental results on high mobility Si MOSFETs. We analyze concepts and methods used to determine the critical density of electrons at the metal-insulator transition. In particular, we discuss the origin of the temperature dependence of the resistivity and reasons for this dependence to flatten out at some electron density in the vicinity of the metal-insulator transition. This flattening has recently been proposed to indicate a true quantum phase transition. We suggest an alternative interpretation of this result and demonstrate the consistency of our proposition with the experimental data. One of the main questions, which arise in connection with the transition, is whether or not the metallic state is qualitatively distinct from a conventional disordered Fermi liquid. We analyze the arguments in favor of both affirmative and negative answers to this question and conclude that the experimental results accumulated up-to-date do not provide convincing evidence for the new state of matter characterized by a metallic-like residual conductivity. We also discuss in details the measurement and control of the electron temperature; these issues are crucial for interpreting the low-temperature experimental data.
pacs:
PACS numbers: 71.30.+h, 72.15 Rn, 73.40.Qv()
I Introduction
After several years of intensive experimental and theoretical efforts (see, e.g., Ref. [[1]] for an extensive bibliography), even the basic features of the phenomenon known as the “metal-insulator transition in two dimensions”(2D MIT) remain to be the subjects of ongoing discussions. Is this phenomenon a true “quantum phase transition”(QPT) [[2]] or can it be understood in terms of conventional physics of disordered conductors [[3, 4]] ? This question is at the heart of the whole discussion. Recently, we wrote a paper [[5]] in favor of the second possibility. In particular, we argued that
-
i)
in the “metallic phase”, 2D systems seem to behave as a quite conventional disordered metal rather than a distinctly new state of matter and
-
ii)
it is possible to explain the anomalous behavior of the resistivity, , by an interplay of two temperature dependences: the one given by a metallic-like, quasiclassical (Drude) resistivity [[6]], , and the other one arising from quantum localization.
We do realize that ii) represents a rather naive approach, at least because it does not fully take into account the Coulomb interaction between electrons, whereas the most pronounced effects have been observed in systems with a priori strong electron-electron correlations. Nevertheless, this approach allows one to describe qualitatively, and even semi-quantitatively, most of the results on electron transport both in metallic phase and near the transition point. This suggests that it is a good starting point for developing an adequate theoretical understanding of the MIT in two dimensions.
Conclusion i) is based on the analysis of existing experimental data, as summarized in Refs. [[5, 7]]. It has been further supported by recent experimental papers [[1, 8, 9, 10]], which showed that the transport properties of Si/Ge, Si MOSFET and p-GaAs structures in the metallic regime can be successfully interpreted in conventional terms. Authors of Refs. [[9, 10]] have also identified the contribution of electron-electron interactions to the resistance (via measuring the temperature-dependent part of the Hall resistance) and found that it remains quite small even when parameter is rather large. There is also a number of recent theoretical papers [[11, 12, 13, 14, 7]] which, although differing in a particular mechanism for the -dependence of the Drude resistivity, share the general spirit of propositions i) and ii).
An alternative point of view, expressed, for example, in Refs. [[15, 16, 17]], is that the observed MIT-like behavior indicates a true quantum phase transition between an insulator and a novel metallic phase. Motivated by the importance of this controversy, i.e., QPT versus propositions i) and ii), for the field of quantum transport in 2D and its possible relevance for other realizations of quantum phase transitions, we decided to analyze in detail the arguments on both sides of the QPT question. In this paper, we discuss recent and some of the previously published experimental results on the resistivity of Si MOSFETs in the vicinity of the MIT, along with some of the theoretical interpretations of these results. We conclude that that there is no convincing experimental evidence for the QPT in the existing data.
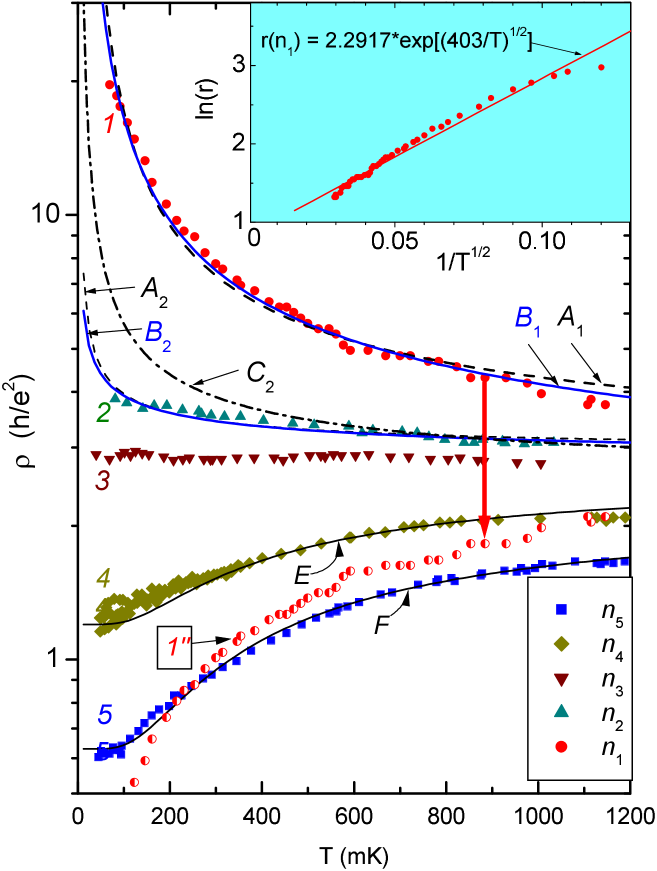
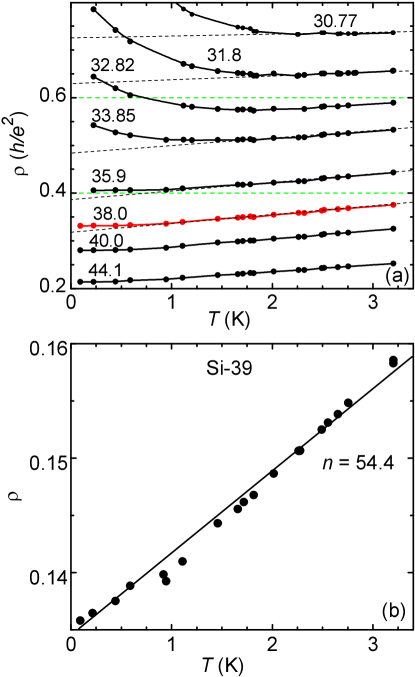
As one of the main questions in the field is the behavior of a 2D system in the limit , we begin our analysis with a short summary of recent results by Kravchenko and Klapwijk (KK) [[15]], who measured the temperature dependence of the resistivity down to a bath temperature as low as mK. This paper reports measurements on a single Si MOSFET sample with peak mobility cm2/Vs in the range from 35 mK to 1.2 K at five different electron concentrations. Digitized data from Ref. [[15]] is shown in Fig. 1 (curves 1-5).
In Ref. [[15]], the following two points are emphasized:
-
1)
For cm-2 and cm-2 (curves 1 and 2), the resistivity decreases as temperature increases ; for cm-2 and cm-2 (curves 4 and 5), the resistivity increases with temperature . Based on these observations, the authors argue that curves 1 and 2 correspond to an insulating phase, whereas curves 4 and 5 demonstrate a metallic behavior. At cm-2 (curve 3), only a weak () temperature dependence was observed within the interval of bath temperature from 35 mK to 1 K. The authors conclude that cm-2 is the critical electron density for their sample, i.e., it corresponds to the metal-insulator transition point. Note that this conclusion is based entirely on the temperature independence of curve 3 over a relatively narrow temperature range.
-
2)
Another observation, emphasized in Ref. [[15]], is that in the range 0.1 K 0.4 K the metallic - dependences (curves 4, 5) appear to be nearly linear and thus different from the exponential temperature dependence observed in other experiments. KK stress that in this region the resistivity shows no insulating up-turn at the lowest temperature achieved.
KK consider the fact that they observed no temperature dependence of the resistivity of their sample at a certain concentration as a strong argument against our model [[5]]. They point out that such a precise cancellation would require a special relation between and the scaling -function. KK argue that this relation between two objects of entirely different origin “would be a remarkable coincidence”, and is therefore unlikely.
Based on the arguments listed above, authors of Ref. [ [15]] conclude that their experiments are consistent with the existence of the zero-temperature quantum phase transition .
Note that a rather narrow range of densities was explored in Ref. [[15]]. To show the development of the MIT-phenomenon over a wider range of densities and temperatures, we present in Fig. 2 the results of Ref. [[18]] for a sample with a close value of . The encircled region of the plane (region KK in this figure) indicates roughly the domain of parameters explored in Ref. [[15]]. The temperature in Fig. 2 is normalized to the Fermi energy , in order to demonstrate that resistivities corresponding to quite different Fermi energies, and therefore -values, exhibit similar -dependences. A strong (50-100%) drop in is still present for cm-2, which corresponds to and . Thus, contrary to the popular opinion, the resistance drop is not intrinsic only to the low density range (high -values).
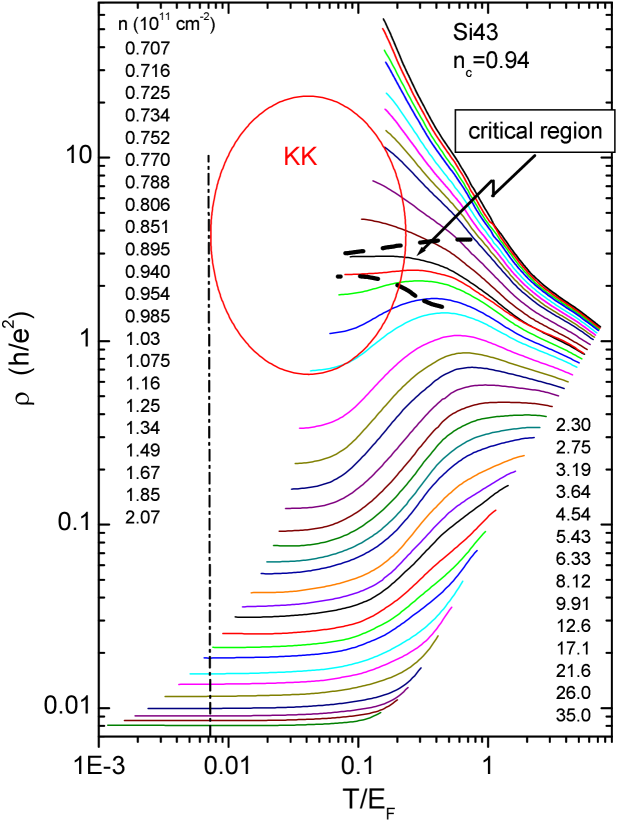
We would like to stress once again that in the region of high densities and small resistivities quantum interference corrections of any kind (weak localization, exchange and Hartree interactions, spin-orbit, etc.) would amount only to a few percent variation (of both signs) in with . The phonon contribution to the resistivity of Si-MOSFETs can be shown to be negligible at least for cm-2 in the relevant -range. Therefore, there must be some other mechanism of the -dependence at work, neither of quantum interference nor of phonon nature. The resistance drop of non-phonon nature persists up to the highest temperature of these measurements, which is K for each curve in Fig. 2 (for conversion of densities into the Fermi-energies, use the formula: [K] cm).
II Metal, Insulator, and Critical Point. General Discussion
Contrary to a common belief, a metallic phase and thus a metal-insulator transition can in principle occur in two dimensions. For example, in a hypothetical situation of non-interacting electrons spin-orbit coupling results in resistivity vanishing with temperature, provided that disorder is sufficiently weak (“weak antilocalization” [[3, 4, 19]]). However, if disorder is strong enough, it leads to localization. The metallic state is stable with respect to weak and short-ranged electron-electron interactions. The Coulomb interaction between electrons for small overwhelms weak antilocalization and thus destroys the metallic state with zero residual resistivity. Nevertheless, the Coulomb interaction itself brings in an antilocalizing contribution to the resistivity (triplet channel). For small , this contribution is smaller than the one from the singlet channel, and thus the net effect of interactions is the enhancement of localization. It may be the case that the triplet channel wins for larger and a metallic state becomes possible. (In fact, this scenario follows from the RG treatment [[20, 21, 22]].) However, if such a state exists, it must be distinct from the conventional “disordered Fermi liquid”.
So far, the experimental evidence is in contrast with the existence of a distinctly new state (see Refs.[[5, 7]]). In fact, at higher densities the resistivity exhibits an insulating up-turn in agreement with the weak localization theory. We believe that in the existing experiments the true low-temperature asymptotic behavior has not yet been achieved for lower densities (in the vicinity of the transition). Therefore, one cannot interpret the crossover between and at finite temperatures as a proof for the existence of two distinct phases. Nevertheless, it is instructive to adopt such an interpretation for a moment and to compare the experimentally observed with the commonly accepted picture of a quantum phase transition. Let us first recall what is known about the transition in 3D.
We start our analysis by formulating the definitions of metal and insulator. Arguing about definitions is not a too rational thing to do – a definition cannot be right or wrong. We simply point out that for the well-studied case of MIT in 3D, the commonly held definitions of both phases differ from those adopted by KK. In 3D systems, , whereas is finite (see [[3, 4, 22]] and references therein). In fact, is negative in both the metallic and insulating phases, provided that the system is close to the transition point and the temperature is low enough.
For non-interacting particles, the conventional scenario of the 3D MIT is well supported by the perturbation theory and renormalization group arguments [[3, 4, 23, 22]]. According to this scenario, in the metallic phase close to the transition increases as as temperature decreases. The increase of saturates at . Upon approaching the critical point, tends to zero. Therefore, exactly at the critical density the -dependence is a power law: . In the insulating phase, the resistivity behaves as (nearest neighbor hopping) or as (variable range hopping). The exponent is determined by mechanisms of dephasing. As a result, it is, strictly speaking, non-universal. Let the dephasing rate scale with temperature as . Then assuming that (a) one-parameter scaling holds, (b) this parameter is the conductance, and (c) , one arrives at . Note that the electron-electron interactions can change the value of .
Numerous experiments on 3D doped semiconductors confirmed the power-law behavior of in the critical region. However, there is still no consensus regarding the value of : both [[24, 25, 26]] and [[27, 28]] have been reported. It is also possible that depends on whether a semiconductor is compensated or not. (For the review of an MIT in 3D see Ref. [[29]].)
Returning to the MIT in 2D, we note that the assumption of a temperature-independent resistivity at the critical density is as doubtful as the statement that in 3D. Indeed, both of these points can be justified only within the one- parameter scaling. This scaling does not seem to apply universally even in the 3D case. For a 2D system of noninteracting electrons, this scaling predicts no metallic state at all. To get a chance to describe a metallic state, one needs to add more ingredients, e.g., electron-electron interactions, to the theory. Once we deal with a problem which is richer than localization in quenched disorder, there are no reasons to assume that the one-parameter scaling still holds (see, e.g., Ref. [[20]]). Therefore, a temperature-independent critical resistivity is an assumption rather than a law of nature.
As an example, consider the following density- and temperature-dependences of the resistivity (which do not follow from any of the existing theories, but do not contradict to any of the commonly respected general principles either):
| (1) |
It is natural to define the critical concentration, , as the concentration at which changes sign: ; for (metal), is negative, whereas for (insulator), is positive. It is also assumed that , and are smooth functions of the density in the vicinity of the transition point . According to Eq.(1), exactly at the critical point ()
| (2) |
As we see, the critical resistivity is temperature-dependent and can even diverge as . At the same time, the resistivity saturates at for in the metallic regime. (In our example, has a maximum at . We do not think that such a maximum is a mandatory feature of the MIT in two dimensions.) We conclude that, at least in this example, a temperature-independent resistivity is a signature of a metal rather than of a critical point.
Regardless of this particular and rather artificial example, we notice that it is neither easy nor a straightforward task to determine the critical point of an MIT. Quantum phase transitions are zero temperature phenomena, whereas experiments are performed at finite . Therefore, to determine the critical concentration, one does not have another choice but to analyze the data taken at the lowest accessible temperatures. This analysis should prove that indeed acquires insulating exponential behavior as soon as the concentration gets lower than the apparent value of .
We find it more appropriate to use the onset of the insulating
exponential behavior in rather than the vanishing of the
derivative for an experimental
identification of the critical point.
We are not aware of any reasons to assign the meaning of the critical
point to a density at which the temperature dependence of the
resistivity is least pronounced, as it was done by KK.
Indeed, direct measurements of the two quantities, (from the
temperature independent “separatrix”) and (from the
disappearance of the non-Ohmic hopping behavior) confirm their systematic
difference for high- samples:
is larger than by 1-5% (see, e.g., Fig. 3 in
Ref. [[30]]).
A similar difference
arises also from the comparison of
critical behaviors in the thermoelectric power and conductance
[[31]]. Note that four out of five electron densities
in Ref. [[15]], , fall into this ambiguous
interval.
III Experimental determination of the critical point.
We now turn to the experimental data of Ref. [[15]]. The authors assume that equals to cm-2 (curve 3 in Fig. 1). According to the definition of the critical point, proposed in Sec. II, this assumption implies that at lower densities (cm-2 and cm-2), the resistivity increases exponentially as temperature decreases. It turns out that one can fit neither nor with a simple exponential dependence. However, can be satisfactorily approximated by
| (3) |
with either or (dashed line and solid line in Fig. 1, respectively). The quality of the fit can be seen from the deviations of the experimental data from the straight line in the inset to Fig. 1. Although curve 2 in Fiq. 1 does not seem to behave exponentially, one can still try to fit it by function (3) in two different ways:
-
i)
one can assume that is proportional to . (This dependence was observed in previous studies of the MIT in Si MOSFETs [[32, 33, 34]]). Then, using the value of for , one determines for by linear extrapolation, whereas is found by fitting the experimental data. The results of this procedure for are shown in Fig. 1 (dashed-and-dotted line C2). It is quite clear that such a fit does not work (the same is true for , not shown).
-
ii)
Alternatively, one can simply make the best fit of curve 2 by function (3) for , treating and as independent parameters. Results of this fit are depicted in Fig. 1 by curves and , respectively. It is customary to assume that in the vicinity of the critical point, scales as . Given the values of for , one can follow the assumption of KK that and find
(4) (7) It is quite alarming that these values of the critical exponent are substantially different from found in previous studies [[33, 34]].
It is also often assumed that in the vicinity of the critical point should be symmetric with respect to reflection about the separatrix [[34, 35, 36]]. To check if this relation works, we reflect curve 1 ( cm-2) about the would-be separatrix (curve 3). The reflected curve is shown by semi-open circles. Had reflection symmetry worked, the reflected curve must have been located in between curves 4 ( cm-2) and 5 ( cm-2), closer to curve 4. In fact, the reflected curve crosses both curves 4 and 5. Thus by this criterion is not a critical density.
Unfortunately, for KK present the data only down to mK, whereas for the rest of the densities, both smaller and larger than , is shown down to 35 mK. If observed, a substantial increase in with cooling from mK to 35 mK would provide KK with a strong argument in favor of being close to the critical density.
Within the assumption that the data presented in Fig. 1 can at all be interpreted within a paradigm of a quantum phase transition, the contradictions demonstrated above suggest at least one of the following three conclusions:
-
i)
the separatrix corresponds not to density but to some smaller density;
-
ii)
the critical exponent is not universal for a given material but depends on the sample preparation, geometry, etc.;
-
iii)
the exponential increase of the resistivity at density is suppressed due to overheating (we will discuss this option in Sec. V in more details).
Alternatively, one may conclude that the data of Ref. [ [15]] do not provide evidence for a quantum phase transition between two distinct states of matter, but rather indicate a crossover between two different types of (relatively) high temperature behavior.
IV Resistivity of Si MOSFETs in the critical region
As it has already been mentioned, any scenario of a quantum phase transition implies that for the densities close to the critical point the resistivity at sufficiently high temperatures demonstrates a critical behavior. This means that the deviation of from the separatrix is small for small values of the critical parameter . Keeping this in mind, we now recall the main results of earlier experiments on the resistivity of high mobility Si MOSFETs in the critical region and compare them with KK’s results.
Consider, for example, the resistivity of a sample with cm2/V s, reproduced from Ref. [[30, 37]] in Fig. 3. Assume for a moment that metallic and insulating behaviors can indeed be distinguished by the sign of the derivative , as suggested by KK. At first glance, the application of this criterion to the region K in Fig. 3 is rather unambiguous. Indeed, determined from the condition of -independent corresponds to the dashed separatrix.
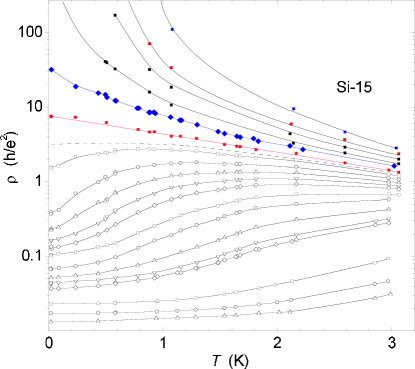
On the other hand, using the onset of activated and non-Ohmic conduction as a criterion for the transition, we find that the critical density is lower, cm-2 and corresponds to the “tilted” (6th) curve from the top. At higher temperatures, some of the “metallic” curves change their slopes and follow quite closely those “insulating” curves, which correspond to lower densities (see solid curves in Fig. 3.) The region of the plane, where such a behavior occurs, is defined as the critical region. Certainly, the density range of the critical region is narrower for lower temperatures.
As a rule, the resistivity depends on the temperature in this region. This feature, which can be found in almost any published data, is demonstrated in Figs. 2 and 3. For example, in Fig. 3 increases by approximately a factor of 2, as changes from 3 K to 1 K, both for cm-2 (the 6th curve from the top) and cm-2 (the 7th curve).
In fact, the -dependence at higher temperatures is usually more pronounced in higher-mobility samples. This is illustrated by Fig. 4, which is reproduced from Ref. [[32]].
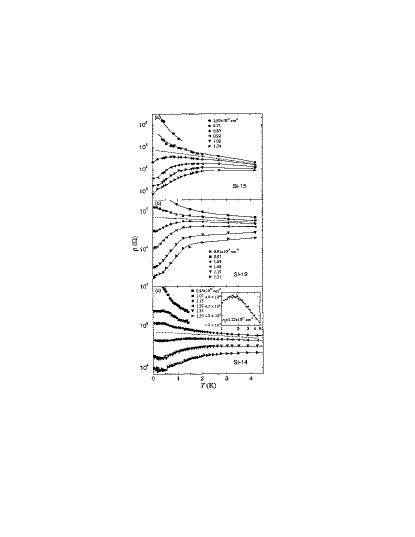
The slope of the dashed line for the sample with cm2/Vs (Fig. 4a) is negative and its absolute value is about 10 times bigger than in Fig. 4b ( cm2/Vs). The reduction of the slope with persists down to relatively low mobilities until eventually the slope changes sign. This is seen from Fig. 5a, reproduced from Ref. [[37]], where the authors presented for a sample with as small as cm2/Vs.
Even for this low-mobility sample, the -dependence at the highest density measured (cm-2) shows no signs of saturation in the accessible temperature region (above 100 mK), see Fig. 5b. There is no consistent theoretical understanding of this -dependence of the slope yet. Such an understanding will probably come together with the description of the “critical resistance”, which apparently changes from about at low mobilities to several units of at high [[30, 37]], (see also discussion in Refs. [[38, 39]]). On the other hand, it is natural that for the intermediate mobilities, the slope is small, because it should vanish somewhere in the range from 5,000 to 30,000 cm2/Vs. The mobility of KK’s sample is 27,000 cm2/Vs, i.e., right in this range. Therefore one should not be too surprised by the fact that in some range of the concentrations the temperature dependence of the resistivity is rather flat, as it was observed by KK.
Last but not least: a variety of the - dependences in the critical region indicates by itself the absence of universality in observed MITs [[30]] and raises doubts that Si MOSFETs undergo a genuine quantum phase transition.
V “How Cold are the Electrons?”
Heating of electrons by the applied source-drain field as well as by external noise is a common problem in low-temperature transport measurements. This problem turns out to be especially serious in Si MOSFETS in the vicinity of the “metal-insulator transition” and at temperatures mK due to *) weak temperature dependence of the resistivity in this range of densities and **) weak electron-phonon coupling. As a result, the interpretation of resistivity measurements becomes rather ambiguous. For example, the temperature interval, in which the resistivity appears to be temperature-independent, may look to be much broader than it actually is. The goal of this section is to demonstrate the seriousness of this problem.
In macroscopic Si MOSFETs, as well as in bulk Si, electrons couple to
phonons only via the deformation potential.
As this coupling is rather weak, the electron temperature, , may
exceed substantially the bath temperature, ;
it is also not easy to
control .
To provide convincing data, one has to
use a “thermometer”capable of measuring directly.
Any observable which depends on , other than the
(zero-magnetic-field) resistivity itself,
can be used for this purpose.
In earlier studies on high mobility Si-MOSFETs,
Refs. [[30, 37, 40, 41, 42]],
which reported results of the resistivity measurements down to
mK,
the electron temperature
was attempted to be measured via
i) the amplitude of Shubnikov - de Haas (ShdH)
oscillations,
ii) temperature dependence of the hopping resistivity,
iii) linearity of -characteristics,
and
iv) -dependence of the phase relaxation
time.
Unfortunately,
results on in the up-to-date
measurements of 2D MIT
are
neither fully consistent
with each other
nor convincing
enough
below mK.
No independent measurement of is reported in Ref. [[15]]. It is only mentioned that the source-to-drain bias, , was less than 200 V “to ensure that the total power dissipated in the sample was less than W”. As it is not clear whether this is enough to prevent electrons from being overheated, it is worth discussing electron heating in Si MOSFETs.
Electrons are driven out of the equilibrium by the applied voltage and/or by external noise. Let be the power deposited in the electron system. In the stationary state, all this power leaves the system either with electrons (through contacts) or with phonons. The phonon mechanism dominates at higher temperatures. If is low enough, this mechanism can be neglected compared to electron out-diffusion, in which thermal conductivity of the electrons determines the heat balance. As our task is to estimate heating at 100 mK, we first discuss what happens without phonons.
Given the temperature increment , the power, which is carried out by electrons through the leads, can be estimated as (see Refs. [[43]] and also [[44]] for recent discussion):
| (8) |
where is the resistance which differs from the resistivity by the aspect ratio. To obtain a lower bound estimate of the bath temperature at which heating becomes strong, i.e., , we neglect heating due to external noise and assume that the main reason for heating is the source-to-drain bias, . Accordingly, . Expressing the ratio through via Eq. (8), we obtain
| (9) |
Strictly speaking, Eqs.(8,9) are valid only when . Nevertheless, one can use them to estimate as
| (10) |
For V, Eq. (10) gives mK. For lower bias, e.g., for V this estimate gives mK, whereas the experimental dependence [[45]] taken at mK shows that at this bias electrons are already overheated: . Despite its simple form, Eq. (10) is quite general and universal. For example, it is also valid in the presence of Fermi-liquid interactions, which do not affect the Wiedemann-Franz law [ [46]].
Taking into account the phonon mechanism of energy relaxation does not change our estimate of characteristic temperature substantially. This is so because is low enough for out-diffusion to dominate over phonon emission. Indeed, the electron-phonon energy loss rate for weak overheating can be written as
| (11) |
where is the density of states at the Fermi level, and are the sample length and width, respectively, and is the electron-phonon relaxation time. We assume that electrons are coupled to phonons via the screened deformation potential. The corresponding relaxation time for [K] (where is the speed of sound, and in cm-2) can be written as [[47, 48]]
| (12) |
where is the deformation potential constant, is the atomic mass, is the effective lattice constant defined in such a way that is equal to the mass density, and is the inverse screening length. Comparing (8) to (11), one finds that out-diffusion dominates, provided that is smaller than
| (13) |
where and . Substituting material constants for a Si MOSFET into (13), one obtains
| (14) |
where , , and are measured in , cm-2, and mm, respectively. Using experimental results on electron heating in Si MOSFETs [[45]], one estimates the observed crossover temperature as 0.7 K, whereas Eq. (14) gives K for the experimental conditions of Ref. [[45]]. For the conditions of another experiment on heating [[49]], Eq. (14) gives K, which is just the lowest temperature of this measurement. No clear crossover from the phonon to out-diffusion mechanisms was observed in Ref. [[49]] for K (although the -dependence of the energy-loss rate does start to slow down at K). This is again consistent with our estimate. We thus conclude that Eq. (14) is consistent with the experimental data and can serve as at least a lower bound for .
For typical values of , cm-2, and mm, Eq. (14) gives K, which is of the same order as estimated above as K. Note that in deriving (14) we assumed that was -independent. Taking the metallic-like -dependence into account enhances out-diffusion at low temperatures and thus shifts towards even higher values. Also, taking into account possible external noise would further increase the value of . The lowest bath temperature in Ref. [[15]] is mK. Using Eq. (10), we see that in order to prevent electron heating, the bias voltage has to be much smaller than 20 V, which is ten times smaller than the upper boundary for indicated in Ref. [[15]].
We thus see that there are serious reasons to doubt that the electron temperature in KK’s measurements was below mK.
VI Temperature-Independent Resistivity
Now it is time to analyze the first of the two main arguments that KK brought in favor of the “true quantum phase transition”, namely, the temperature-independent resistivity at what they believe to be the critical point. More specifically, KK claim that they observed no -dependence (within a 10% margin) in the interval K. They analyzed the data in terms of our recent theory of Anderson localization by temperature-dependent disorder [[5]] and came to the conclusion that within this theory a nearly constant would imply a “remarkable coincidence”.
We begin our discussion of this issue with summarizing briefly the argument of KK. Afterwards, we present our theoretical counterarguments.
The theory of Ref. [[5]] describes the -dependence of the observable resistivity, , in the presence of two factors: i) the -dependence of the Drude resistivity, , and ii) Anderson localization. Each of these two factors brings a -dependence of its own and the resultant -dependence is described by the following scaling equation
| (15) |
where is measured in units of , is the Gell-Mann–Low function, whereas and parameterize the phase-breaking time as
| (16) |
The -dependence of , entering the RHS of Eq. (15), leads to a variety of behaviors in . In Ref. [[5]] we discussed in particular the situation when exhibits a maximum at a rather high temperature (close to the starting temperature of the RG flow).
Is a very slow variation of over a wide -interval permitted in this model? KK answer this question negatively. Their argument goes as follows: to have within some interval of temperature, one has to require that the RHS of Eq. (15) is equal to zero within this interval. This is possible only if the Drude conductivity is related in a specific way both to the -function and to . Such an exact relation is unlikely, given the different origin of these quantities.
This argument sounds to be formally correct. Nevertheless, as we will demonstrate shortly, it is possible to achieve a very small variation of within a wide temperature interval without imposing any constraints of this kind on . It turns out that the variation of is small enough and the -interval is wide enough to agree with the experiment. This possibility results from the fact that there is a whole family of the -functions, which are parameterized by the electron density and some other parameters, such as the peak mobility. It is the freedom in fine-tuning these parameters that allows one to suppress the variation of the observable resistivity dramatically.
For the purposes of this section, we adopt the following working definitions, consistent with those used in Ref. [[15]]: by “metal” (“insulator”) we understand the region in which or ; by “critical region” we understand the region in which .
As was discussed in Ref. [[5]], a maximum in results from a competition between metallic-like and localization effects, the latter being controlled both by and . At higher , when is sufficiently large, localization can already be strong enough to ensure the negative sign of despite decreasing with temperature. However, as goes down, decreases, localization weakens and changes its sign from negative to positive, thus a maximum in occurs. This can happen provided that certain conditions are satisfied. In particular, one has to require that
| (17) |
where is the temperature at which is comparable to the transport mean free time (the flow of Eq. (15) starts at ) and is some critical resistivity determined by a particular form of . For example, if , critical resistivity is a certain function of (see Eq. (9) of Ref. [[5]]). In this case, there is another condition for the maximum in to occur, namely, .
As the resistivity depends on the electron density , it can be tuned by the gate voltage. This tuning can drive the system between the domains of parameters corresponding either to a maximum or no maximum in . Let us start at , so that the maximum in is at . As approaches from above, remains finite, while the maximum flattens out and disappears as soon as approaches . At this moment, both and vanish, and the variation of around takes place solely due to higher () terms in the Taylor expansion of .
How large is the temperature interval, in which this variation does not exceed some given value? Denoting,
| (18) | |||||
| (19) | |||||
| (20) | |||||
| (21) | |||||
| (22) | |||||
| (23) |
we obtain from Eq. (15)
| (25) | |||||
| (26) |
The third (logarithmic) derivative of is then found from Eq. (15) to be
| (27) |
where
| (28) |
and
| (30) | |||||
| (31) |
For a sufficiently narrow interval of around , it suffices to keep only the lowest (cubic) term in the Taylor expansion of as a function of :
| (32) | |||||
| (33) |
As is supposed to be a smooth function of , one can estimate as , where is the typical value of in the interval . In the “critical region”, , which means that as well, and hence . Thus the two terms in the square brackets in (33) are of the same order and (33) reduces to
| (34) |
Let us now estimate the number of decades in temperature
| (35) |
for which
| (36) |
(KK found that their is -independent with this accuracy.) Using an interpolation formula [[50]] and choosing , we have
| (37) |
For and , we get , i.e., the resistivity stays within a 10%-margin for more than two decades in . (Note that a numerical coefficient of the order of unity, which we neglected in deriving (34), would enter (37) only under the cubic root, and is thus unimportant.) Fig. 6 demonstrates calculated from Eq. (15) for taken from the model of Ref. [[51]]:
| (41) | |||||
where characterizes the distance from the critical point and . The dimensionless coefficient depends on details of the model (cf. Eq.(11) of Ref. [[5]]). For the purposes of the present paper, we view Eq. (41) as simply a phenomenological form for , regardless of the model [[51]] it was originally derived from. This form is consistent with the experiment, if .
The value of corresponds to the central line in Fig. 6, which on this scale is essentially constant for more than two decades. Zooming in (cf. the inset in Fig. 6), one sees that in fact stays within a 10%-margin over exactly three decades in .
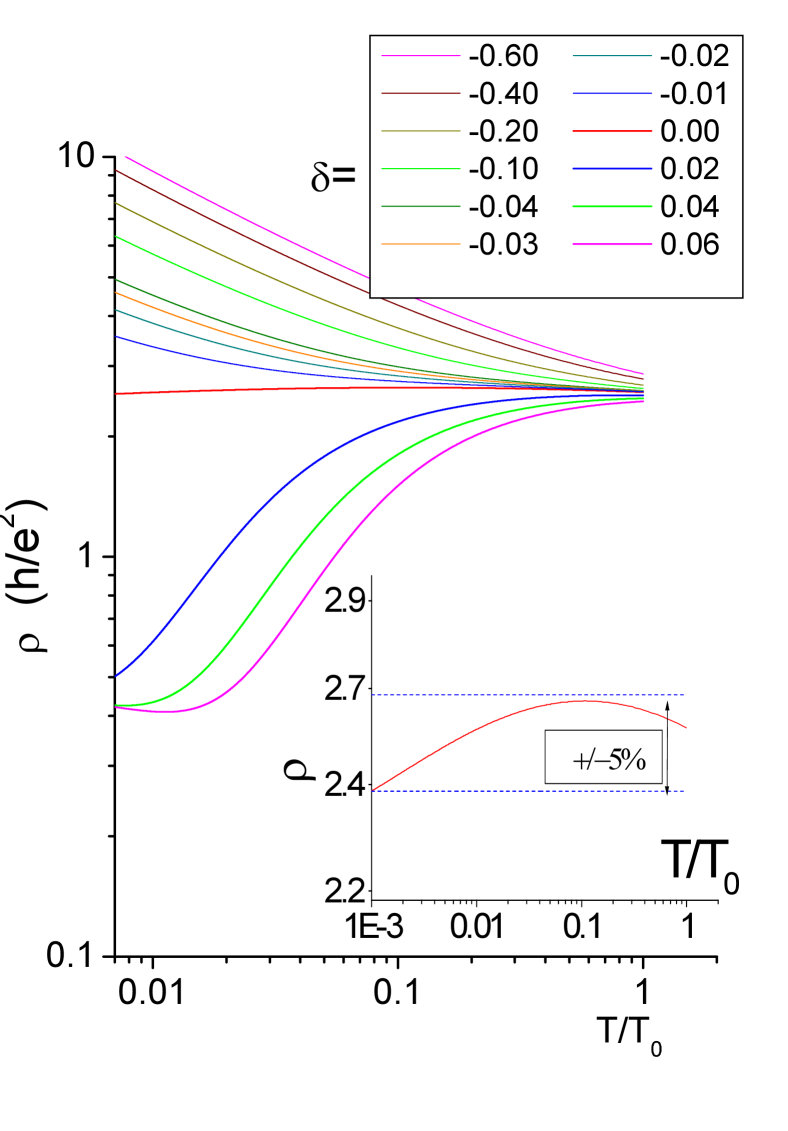
KK claim that the observed stays within this margin over only 1.5 decades, which is smaller than even the conservative estimate (37). (As it was discussed in Sec. V, a more realistic estimate of KK’s -interval is one decade). A decrease in by 1% () leads to a weakly insulating behavior: increases by 30% as decreases by 1.5 decades. An increase in by 4% () leads to a well-pronounced metallic behavior: drops by about a factor of two over 1.5 decades in . These features are in quantitative agreement with the experiment [[15]]. (For the sake of simplicity, we assumed that parameters and do not depend on the density, i.e., on . Taking these dependences into account should lead to even better agreement with the experiment.)
We emphasize that no fine tuning between the -function and was used. If it is the competition between the decrease in Drude resistivity with temperature and the localization effects that leads to the maximum in the observable resistivity, then the -dependence flattens out, as the density approaches the threshold for a maximum. It turns out that if the exponent is not too big (which is usually the case), this flattening suppresses the variation of below the experimentally observable level over several decades in temperature. Even an oversimplified model [[5]] which does not take into account, e.g., electron-electron interactions (except for as a possible phase-breaking mechanism), can easily produce almost constant resistivity in a temperature interval, which is two orders of magnitude wider than the experimental one. Therefore, we do not find it too much of a “remarkable coincidence ” that at some density the system demonstrates a fairly constant .
We now turn to the data presented in Ref. [[15]].
The authors emphasize strongly that at cm-2 the resistivity
is almost temperature independent
in the temperature range 35 mK - 1 K.
They also
add that decreases with for K.
It would be interesting to know what happens at
intermediate temperatures: K.
This point being unclear,
KK
fill in the missing temperature interval
by combining their result with the one obtained on another
system.
Indeed, they write:
“In combination with the results of Ref. [10]
(Ref. [[52]]
of this paper–AMP) where the temperature-independent curve (with
essentially
the same value of resistivity) was observed
in the temperature range
250 mk-1.8 K in another 2D system in silicon, we further allege that
there
is no observable -dependence at in the temperature range
35 mk-1.8 K…”.
(Ref. [[15]], p. 3, second paragraph.)
Parenthetically, we note that the resistivities of combined curves
differ by 35%.
As far as we understand,
temperature intervals of experiments on different systems
are not additive parameters,
and thus the procedure described above is not justified.
Summarizing this part of our discussion, we take the liberty to describe the experimental situation in the following way:
In a sample from the intermediate peak mobility range (where temperature dependence of is known to be quite weak at high ), one can find a density such that does not change for more than 10% within about one order of magnitude in . This statement is a result of measurements on a single sample in the interval 100 mK K (when a realistic estimation of the electron heating is taken into account). (It will be two samples if results of Ref. [[52]] for 250mK1.8K are taken into consideration.)
In our opinion, there are neither theoretical nor experimental reasons to believe that the density corresponding to the weakest -dependence is indeed the critical one. i.e., that and is finite for lower and higher densities, respectively. The lack of a pronounced temperature dependence of in a limited range of does not signal any remarkable phenomenon and is well-described by a simple theory of Anderson localization in a temperature-dependent disorder (Ref. [[5]]).
VII On the apparent linear temperature dependence of
We now turn to point (2) of Ref. [[15])] regarding the functional form of the observed -dependence. According to KK, this form is a) linear and b) qualitatively distinct from those observed by other authors. Fig. 7 reproduces Fig. 3b of Ref. [[15]], where the “almost linear dependence” is demonstrated. The data in Fig. 7 is data 5 of Fig. 1, displayed in truncated ( K) and full ( mK) intervals. The truncated interval, in which is supposed to be “almost linear”, corresponds to Fig. 3b of Ref. [[15]].
We begin with an attempt to fit untruncated data 5 of Figs. 1, 7 in the whole interval K by an empirical expression [[53]]
| (42) |
which is a simplified version of Eq. (1) with . This expression is known to work reasonably well for the metallic phase not only in Si MOSFETs [[30, 53]] but also in other 2D systems exhibiting the MIT-like behavior [ [35]].
As is seen from Fig. 7, this attempt is quite successful. We achieved more than just acceptable fit in a much broader temperature interval than the one in which looks “almost linear”. Of course, it is not a much of an achievement to fit a smooth curve by a function with three free parameters (to demonstrate a flexibility in choosing the fitting parameters, Fig. 7 presents two sets of parameters that can be used). On the other hand, we see no reason to argue that the -dependence of Ref. [ [15]] at and (see Fig. 1) is qualitatively different from those observed in other experiments.
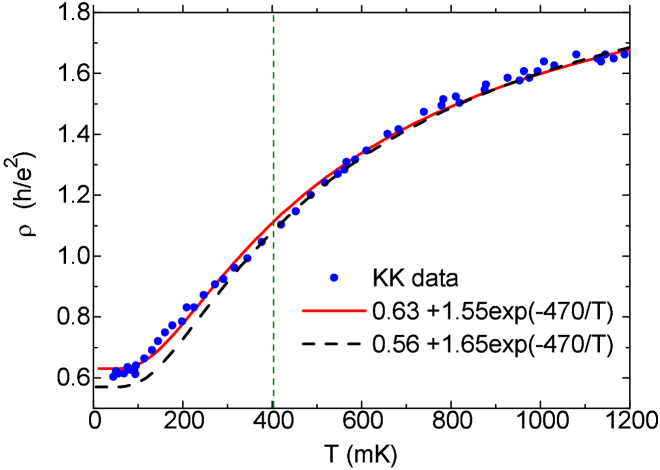
Moreover, such “almost linear” -dependences are typical for low-mobility samples in the “metallic” regime. For instance, compare Fig. 7 with Fig. 5b, in which for a low-mobility sample is plotted over a much wider temperature range (90 mK - 4 K), and for about 50% higher than what can be called a critical concentration. The similarity of these two plots is quite clear.
We find it quite unlikely that the quasi-linear -dependences of Figs. 1 and 7 (as well as Fig. 5) manifest an exotic non-fermi-liquid state. Taking into account the whole set of features of the metallic state in Si-MOSFETs (which we listed in Ref. [[5]]), we conclude that these dependences must have a classical explanation (see the next paragraph for our definition of this term). For example, one cannot exclude that such behavior is caused by the temperature dependence of the screening length [[55, 56, 57, 58]] or by the temperature dependence of the charge traps’ population in the oxide [[51]].
We conclude this discussion by remarking that there seems to be some confusion in recent literature on MIT in 2D (see, e.g., Ref. [[16]]) regarding the distinction between “quantum” and “classical” behaviors. We believe that this confusion is mainly semantic. We call a regime “classical” as long as electron transport can be described in the framework of the Boltzmann theory. This does not necessarily mean that electrons obey Boltzmann (non-degenerate) statistics -in fact, the Fermi-liquid theory was originally formulated in terms of the Boltzmann equation [[59]]. It also does not exclude that a scattering cross-section is described in terms of quantum mechanics. (A more common name for this regime is “semi-classical” [[60]], although the semi-classical approximation may not necessarily be employed for the calculation of a scattering cross-section.) However, quantum-mechanical effects arising due to interference of electron waves, e.g., weak localization, cannot be described by the Boltzmann equation. We call the regime “quantum”, if these effects are important. Although we agree with the authors of Ref. [ [16]] in that “the formation of a Fermi surface” is an “intrinsic quantum-mechanical effect”, this does not imply that the metallic-like temperature dependence of the resistivity, whose onset is correlated with the Fermi-surface formation, is of the quantum nature, in a sense of the definition given above.
VIII At what temperatures weak localization may be observed
There is one more point to discuss regarding the metallic behavior of Si MOSFETs. In addition to the almost linear dependence with , KK emphasize that no signs of weak localization (WL) was observed, although they went to temperatures as low as , where is the Fermi temperature. Giving the authors the benefit of the doubt, we assume the most favorable scenario in which electrons are not overheated. Nevertheless, under this assumption the apparent absence of WL is not as surprising as KK present it. In fact, we believe that even the bath temperature was too high to observe the localization upturn in the -dependence of the resistivity. Indeed, experimental studies of high-mobility Si MOSFETs in the wide range of electron densities [ [62, 61]] show that WL effects are well-pronounced in the (perpendicular) magnetic field dependence of the resistivity. The observed magnetoresistance is in a quantitative agreement with the conventional theory [[3, 4]], even for densities rather close to the critical one. On the other hand, even for observation of the WL effect in the zero-field -dependence [[42, 8]] (as well as the effects of electron-electron interactions) requires a precision of the order of .
It turns out that the observed dependence in the range of “high temperatures”, , is too strong to be explained by WL and quantum interaction effects, and can be attributed to the -dependence of the Drude resistivity. However, the slope decreases with . For relatively large densities, one can reach the temperature region, , in which the slope becomes comparable to that of the WL correction, . In this region, quantum interference should contribute significantly to the -dependence. Authors of Ref. [[8, 42]] found an empirical relation: (see Fig.(2)). As is proportional to , it becomes progressively more challenging to cool electrons below as is approached. K for the highest electron density reported by KK and thus mK. Therefore, in order just to reach the high temperature edge of the quantum transport region, where WL effects are seen, electrons should be cooled below 40 mK. The localization upturn may be expected to occur only at temperatures substantially smaller than even this one. In other words, the lowest temperature reported by KK (35 mK) is still too high for localization effects to be observed.
Why WL manifests itself so differently in the magnetoresistance and in the ? This can be explained naturally by assuming that the Drude resistivity has a pronounced -dependence, which masks quantum corrections. On the other hand, is not expected to vary substantially in weak magnetic fields, thus WL can be seen in magnetoresistance.
IX Conclusions
Some concluding remarks:
-
i)
the apparent metal-insulator transition in 2D is a very interesting and unexpected phenomenon. Although we have limited our discussion to Si MOSFETs, which exhibit the strongest, among other 2D systems, “anomalous” metallic behavior, there is a whole variety of interesting effects not only in transport but also thermodynamic properties, e.g., compressibility [[63, 64]]), observed in various 2D heterostructures. Whether all these observations have a universal explanation or there is a number of different, system-specific mechanisms at work, remains to be seen.
-
ii)
we do not believe that the experimental results accumulated up-to-date provide a convincing evidence for this phenomenon being a true quantum phase transition between two distinct states of matter. More precisely, there is no evidence that the “metallic phase” (as defined by the sign of ) is a new state of matter. On the contrary, a whole set of features–see Refs.[[5, 7]]–is consistent with a conventional behavior of a disordered Fermi liquid. This statement does not negate i). There is still no consensus on the origin of the effect, and this problem requires the most serious and intensive investigations.
-
iii)
For a successful resolution of the problem, it is probably not sufficient to concentrate on the temperature dependence of the resistivity in the vicinity of the transition. Such features as a weak temperature dependence of the resistivity at a certain electron density in a limited (though large) temperature interval allow for different interpretations and, unfortunately, can not provide an unambiguous information about the zero- state of the system. In particular, it is impossible to determine even the critical density without making rather arbitrary assumptions.
-
iv)
There is a serious experimental difficulty that up to now prevented a substantial increase of the temperature interval, in which the resistivity can reliably be measured in Si-MOSFETs. It turns out that in existing samples phonons can hardly cool the electron gas below a fraction of a Kelvin. On the other hand, the systems are quite noisy, and thus the applied voltage cannot be reduced much below the currently used level. As a result, even in the absence of non-equilibrium noise, one cannot neglect electron heating at mK.
Acknowledgements.
The work at Princeton University was supported by ARO MURI DAAG55-98-1-0270. D. L. M. acknowledges the financial support from NSF DMR-970338 and from the Research Corporation Innovation Award (RI0082). V. M. P. acknowledges the support from RFBR, INTAS, NWO, NATO (PST.CLG.976208) and Programs “Physics of solid-state nanostructures”, “Statistical Physics”, and “Integration”. We would like to thank the Center of Higher Studies (Oslo, Norway) and Institut für Halbleiterphysik Johannes Kepler Universität (Linz, Austria), where parts of this work were done. We are grateful to M. Reizer for numerous illuminating discussions and to A. F. Hebard, R. Fletcher, C. Marcus, G. W. Martin, and A. V. Varlamov for critical reading of the manuscript and valuable comments. We also appreciate the assistance of G. W. Martin in the manuscript preparation.REFERENCES
- [1] V. Senz, T. Heinzel, T. Ihn, and K. Ensslin, cond-mat/9910228.
- [2] S. L. Sondhi, S. M. Girvin, J. P. Carini, D. Shahar, Rev. Mod. Phys. 69, 315 (1997).
- [3] P. A. Lee, T. V. Ramakrishnan, Rev. Mod. Phys. 57, 287 (1985).
- [4] B. L. Altshuler and A. G. Aronov, in Electron-electron interactions in disordered systems, ed. by A. L. Efros and M. Pollak (Elsevier, Amsterdam, 1985), p. 1.
- [5] B. L. Altshuler, D. L. Maslov, V. M. Pudalov, cond-mat/9909353.
- [6] We wish to emphasize that what we call “Drude resistivity” is not necessarily something well-known and described in textbooks. It is quite possible that the mechanism(s) of the unusual Drude resistivity in Si MOSFETs and other 2D systems is (are) based on new physics. The only one feature of the Drude resistivity which we retain in our argument is that has nothing to do with quantum interference.
- [7] Y. Meir, cond-mat/9912423.
- [8] V. M. Pudalov, G. Brunthaler, A. Prinz, and G. Bauer, Phys. Rev. B 60, R2154 (1999).
- [9] V. M. Pudalov, G. Brunthaler, A. Prinz, G. Bauer, Pis’ma ZhETF 70, 48 (1999) [JETP Lett. 70, 48 (1999)].
- [10] M. Y. Simmons, A. R. Hamilton, M. Pepper, E. H. Linfield, P. D. Rose, and D. A. Ritchie, cond-mat/9910368.
- [11] T. M. Klapwijk and S. Das Sarma, Sol. St. Commun. 110, 581 (1999).
- [12] S. Das Sarma and E. H. Hwang, Phys. Rev. Lett. 83, 164 (1999).
- [13] Y. Meir, Phys. Rev. Lett.83, 3506 (1999).
- [14] Y. Yaish, O. Prus, E. Buchstab, S. Shapira, G. Ben Yosef, U. Sivan, and A. Stern, cond-mat/9904324.
- [15] S. V. Kravchenko and T. M. Klapwijk, cond-mat/9909458.
- [16] P. Phillips, S. Sachdev, S. V. Kravchenko, and A. Yazdani, Proc. Natl. Acad. Sci. USA 96, 9983 (1999) [cond-mat/9902025].
- [17] S. V. Kravchenko, D. Simonian, K. Mertes, M. P. Sarachik and T. M. Klapwijk, Phys. Rev. B 59, R12740 (1999).
- [18] A. Prinz, V. M. Pudalov, G. Brunthaler, G. Bauer, in: Proc. Intern. Meeting SIMD-99, Mauri, (1999), edited by K.Hess. To be published in Superlattices and Microstructures (2000).
- [19] S. A. Hikami, A. I. Larkin, and Y. Nagaoka, Prog. Theor. Phys. Lett. 63, 707 (1980).
- [20] A. M. Finkelstein, JETP 84, 168 (1983). Z. Phys. B 56, 189 (1984); Sov. Sci. Rev./Sec. A-Physics Reviews, edited by I. M. Khalatnikov, 14, 3 (1990).
- [21] C. Castellani, C. Di Castro, P. A. Lee, M. Ma, Phys. Rev. B30, 527 (1984); C. Castellani, G. Kotliar, P. A. Lee, Phys. Rev. Lett.59, 323 (1987). C. Castellani, C. Di Castro, H. Fukuyama, P. A. Lee, M. Ma, Phys. Rev. B33, 7277 (1986); C. Castellani, C. Di Castro, and P. A. Lee, ibid. 57, R9381 (1998).
- [22] D. Belitz, T. R. Kirkpatrick, Rev. Mod. Phys. 66, 261 (1994).
- [23] E. A. Abrahams, P. W. Anderson, D. C. Licciardello, and T. V. Ramakrishnan, Phys. Rev. Lett.42 673 (1979). P. Lee and T. D. Ramakrishnan, Phys. Rev. B26, 4009 (1982).
- [24] T. F. Rosenbaum, R. F. Milligan, M. A. Paalanen, G. A. Thomas, R. N. Bhatt, and W. Linn, Phys. Rev. B27, 7509 (1983).
- [25] S. Hatsumoto, F. Komori, N. Sano, and S. Kobayashi, J. Phys. Soc. Jpn. , 56, 2259 (1987).
- [26] S. Bogdanovich, M. P. Sarachik, and R. N. Bhatt, Phys. Rev. B60, 2286 (1999).
- [27] M. Maliepaard, M. Pepper, R. Newbury, J. E. F. Frost, D. C. Peacock, D. A. Ritchie, G. A. C. Jones, and G. Hill, Phys. Rev. B39, 1430 (1989).
- [28] M. Watanabe, K. M. Itoh, Y. Outoka, and E. E. Haller, Phys. Rev. B 60, 15817 (1999).
- [29] M. P. Sarachik, in Metal-Insulator Transition Revisited, edited by P. P. Edwards and C. N. Rao (Taylor and Francis, London, 1995).
- [30] V. M. Pudalov, G. Brunthaler, A. Prinz, and G. Bauer, JETP Lett., 68, 442 (1998). [Pis’ma ZhETF 68, 415 (1998)].
- [31] R. Fletcher, A. D. B. Radcliffe, V. M. Pudalov, C. Possanzini, cond-mat/0002436.
- [32] S. V. Kravchenko, G. V. Kravchenko, J. E. Furneaux, V. M. Pudalov, and M. D’Iorio, Phys. Rev. B50, 8039 (1994).
- [33] S. V. Kravchenko, W. E. Mason, G. E. Bowker, J. E. Furneaux, V. M. Pudalov, and M. D’Iorio. Phys. Rev. BB 51, 7038 (1995).
- [34] S. V. Kravchenko, D. Simonian, M. P. Sarachik, W. Mason, and J. E. Furneaux, Phys. Rev. Lett.77, 4938 (1996).
- [35] Y. Hanein, U. Meirav, D. Shahar, C. C. Li, D. C. Tsui, and H. Shtrikman, Phys. Rev. Lett.80, 1288 (1998).
- [36] D. Simonian, S. V. Kravchenko, and M. P. Sarachik, Phys. Rev. B55, R13421 (1997).
- [37] V. M. Pudalov, G. Brunthaler, A. Prinz, and G. Bauer, Physica E 3, 79 (1998).
- [38] S. V. Kravchenko, M. P. Sarachik, and D. Simonian, Phys. Rev. Lett.83, 2091.
- [39] B. L. Altshuler and D. L. Maslov, Phys. Rev. Lett.83, 2092 (1999).
- [40] V. M. Pudalov and S. T. Chui, Phys. Rev. B 49, 14062 (1994); V. M. Pudalov, M. D’Iorio, S. V. Kravchenko, and J. W. Campbell, Phys. Rev. Lett. 70, 1866 (1993).
- [41] M. D’Iorio, V. M. Pudalov, and S. G. Semenchinsky, Phys. Rev. B 46, 15992 (1992).
- [42] V. M. Pudalov, G. Brunthaler, A. Prinz, and G. Bauer, JETP Lett., 68, 534 (1998).
- [43] D. E. Prober, Appl. Phys. Lett. 62, 119 (1993); Phys. Rev. Lett.75, 3964 (1995).
- [44] B. L. Altshuler, M. E. Gershenson, and I. L. Aleiner, Physica E, 3, 58 (1998).
- [45] B. J. Zieve, D. E. Prober, and R. G. Wheeler, Phys. Rev. B57, 2443 (1998).
- [46] M. Reizer, Phys. Rev. B 44, 12701 (1991).
- [47] V. F. Gantmakher and Y. B. Levinsion, Carrier Scattering in Metals and Semiconductors (North-Holland, Amsterdam), 1987.
- [48] V. Karpus, Semicond. Sci. Technol. 5, 691 (1990).
- [49] R. Fletcher, V. M. Pudalov, Y. Feng, M. Tsaousidou, and P. N. Butcher, Phys. Rev. B 56, 12422 (1997); Phys.Rev. B 60, 8392 (1999).
- [50] M. Batsch, I. Kh. Zharekeshev, and B. Kramer, Sol. State Commun.95, 353 (1995); I. Kh. Zharekeshev, private communication.
- [51] B. L. Altshuler and D. L. Maslov, Phys. Rev. Lett.82, 145 (1999).
- [52] M. P. Sarachik and S. V. Kravchenko, Proc. Natl. Acad. Sci. USA 96, 5900 (1999) [cond-mat/9903292].
- [53] V. M. Pudalov, JETP Lett. 66 175 (1997). [Pis’ma ZhETF 66 168 (1997)].
- [54] A. P. Mills, Jr., A. P. Ramirez, L N. Pfeiffer, and K. W. West, Phys. Rev. Lett.83, p. 2805 (1999).
- [55] A. Gold and V. T. Dolgopolov, Phys. Rev. B 33, 1076 (1986)
- [56] S. Das Sarma, Phys. Rev. B33, 5401 (1986).
- [57] T. M. Klapwijk and S. Das Sarma, Sol. St. Commun. 110, 581 (1999).
- [58] S. Das Sarma and E. H. Hwang, Phys. Rev. Lett. 83, 164 (1999).
- [59] L. D. Landau, JETP 3, 920 (1956).
- [60] N. W. Ashcroft and N. D. Mermin, Solid State Physics (Holt, Rinehart, and Winston, New York), 1976, Ch. 12.
- [61] G. Brunthaler, A. Prinz, G. Bauer, V. M. Pudalov, E. M. Dizhur, J. Jaroszynski, P. Glod, and T. Dietl, Annalen der Phys. (Leipzig), 8, 579 (1999); V. M. Pudalov, G. Brunthaler, A. Prinz, and G. Bauer, Physica B 249-251, 697 (1998).
- [62] V. M. Pudalov, G. Brunthaler, A. Prinz, and G. Bauer, JETP Lett. 65, 932 (1997); Physica B, 249-251, 697 (1998).
- [63] S. C. Dultz, and H. W. Jiang, cond-mat/9909314.
- [64] S. Ilani, A. Yacoby, D. Mahalu, and H. Shtrikman, cond-mat/9910116.