The excess wing in the dielectric loss of glass-forming ethanol: A relaxation process
Abstract
A detailed dielectric investigation of liquid, supercooled liquid, and glassy ethanol reveals a third relaxation process, in addition to the two processes already known. The relaxation time of the newly detected process exhibits strong deviations from thermally activated behavior. Most important, this process is the cause of the apparent excess wing, which was claimed to be present in the dielectric loss spectra of glass-forming ethanol. In addition, marked deviations of the spectra of ethanol from the scaling proposed by Dixon and Nagel have been detected.
I INTRODUCTION
Dielectric spectroscopy plays an important role in the investigation of the molecular dynamics in glass-forming materials. Due to the exceptionally wide frequency/time window accessible with this method, broadband dielectric spectra reveal the large variety of processes governing the dynamic response above and below the glass temperature [1]. Among these, the microscopic origin of the process leading to the so-called excess wing (also called ”high-frequency wing” or ”Nagel-wing”) is still unclear. In the frequency-dependent dielectric loss , the excess wing shows up as an additional contribution to the high-frequency power law of the -relaxation peak (). It can be reasonably well described by a second power law, , with [2, 3]. The excess wing, which was already noted in the early work of Davidson and Cole [4], was found in a variety of glass-forming materials [2, 3, 5, 6]. In another class of glass-forming materials, at frequencies above the -peak frequency , a shoulder or even a second peak shows up, giving clear evidence for a second faster relaxation process [6, 7], usually termed -process [8]. By considering the detailed molecular structure of a material, -processes sometimes can be ascribed to intramolecular degrees of freedom, especially in polymeric systems. But a systematic investigation of various low molecular-weight glass-formers where such contributions can be excluded, revealed that these so-called Johari-Goldstein -relaxations may be inherent to glass-forming materials in general [7]. Consequently more fundamental reasons for their occurrence have been proposed [7, 9].
Commonly it is assumed that the excess wing and -relaxations are different phenomena [5, 6] and the existence of two classes of glass-formers was proposed - ”type A” without a -process but showing an excess wing and ”type B” with a -process [6]. However, very recently, by performing dielectric aging experiments below , we found strong hints that in glass-forming glycerol and propylene carbonate a second relaxation process (called ”-relaxation” in the following, but see the remarks below) is the origin of the excess wing observed in these materials [10]. Due to the fact that the relaxation time of this process is relatively close to the -relaxation time [11], only the high-frequency flank of the corresponding relaxation peak becomes visible, thereby appearing as excess wing. In addition, for the orientationally disordered phase of cyclo-octanol, a -relaxation was unmasked as the origin of an apparent excess wing [12] by simply extending the frequency range of dielectric spectra to higher frequencies [13]. Consequently, in [10] it was proposed that -relaxations may provide an explanation for the excess-wing phenomenon in general and that the difference between ”type A” and ”type B” systems may simply be a different temperature evolution of the -process.
In an effort to check this notion, we initiated a systematic investigation of glass-forming materials that have been reported to exhibit well-pronounced excess wings. In the present work we report results on glass-forming ethanol. There is a large variety of publications concerning the disordered phases of ethanol in recent literature [14, 15, 16, 17]. Aside of the well-known common-life applications of this substance, the recent scientific interest in ethanol was mainly triggered by the fact that it can be prepared both in a structurally disordered and plastic-crystalline phase [18, 19]. In plastic crystals the centers of mass of the molecules form a crystalline lattice but the molecules are orientationally disordered. Studies in both disordered phases of ethanol have contributed to our understanding of the importance of orientational degrees of freedom in the supercooled state of matter [14, 15, 16, 17]. A variety of dielectric studies of this material have appeared [15, 16, 17, 20, 21, 22, 23, 24, 25]. In [16, 17] for the first time dielectric loss spectra in ethanol were shown that revealed a significant excess contribution at the high-frequency flank of the -peak. It was claimed as another example of the excess wing known from other glass-formers [16]. In the present work we report results of a detailed dielectric investigation of liquid, supercooled liquid and glassy ethanol in a frequency range and at temperatures . Compared to the earlier publications [15, 16, 17] we provide additional data at lower frequencies and at temperatures which are difficult to access due to an enhanced crystallization tendency. Most important, we have obtained more precise results in the excess-wing region at high frequencies, . This allows for the unequivocal detection of a third relaxation process in ethanol, which is responsible for the excess-wing feature observed in earlier works.
II EXPERIMENTAL DETAILS
High-precision measurements of the dielectric permittivity in the frequency range were performed using a Novocontrol alpha-analyzer. Results at lower frequencies, down to , were collected with a time domain technique. For the frequency range above a Hewlett-Packard HP4291 impedance analyzer was employed. For details the reader is referred to [26]. For cooling, the sample capacitor was inserted into a closed cycle refrigerator or a gas-heating system. The temperatures were precisely measured by a Si-diode, completely inserted into one of the capacitor plates. Ethanol with a purity of was used for the measurements. In the region of ethanol exhibits an enhanced crystallization tendency. Spectra at were obtained after passing this region with rapid cooling rates ( and subsequent heating to the desired temperature. In addition, during the cooling run, spectra at and were collected with a reduced number of frequencies per decade and shorter integration time. In this way the temperature drift during these frequency sweeps could be reduced to less than .
III RESULTS AND DISCUSSION
A The spectra
Figure 1 shows the dielectric loss spectra for the structurally disordered phases of ethanol. The dominating -relaxation peak shifts through the frequency window with temperature. The overall behavior is in good agreement with the findings in [15, 16, 17]. However, at low temperatures, , there is a discrepancy to the peak positions reported in [15, 17] of up to one decade while a good match with the results in [16] can be stated. At the -peak exhibits a shoulder at and its amplitude is reduced. This finding can be ascribed to a partial transition
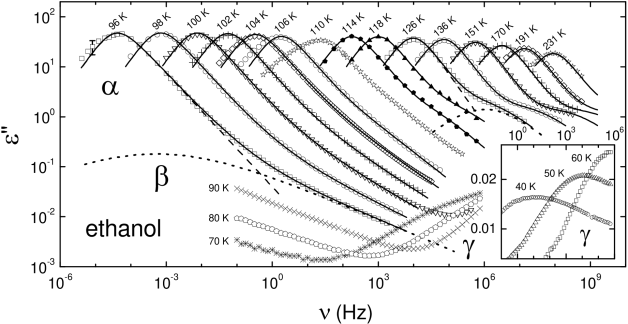
of the sample into the plastic crystalline phase which occurred during the approach of this temperature from below, similar to the observations made in [16] at . In good agreement with the findings in [16, 17], at an excess contribution to the -power law of the -peak is observed. This feature was interpreted as excess wing [16]. At temperatures below and frequencies above this ”excess wing”, starts to rise again. Finally, below , a second relaxation-peak shifts into the frequency window (inset of Fig. 1) in agreement with earlier reports [16, 17]. The upturn of observed at and indicates that this relaxation process is present at , too.
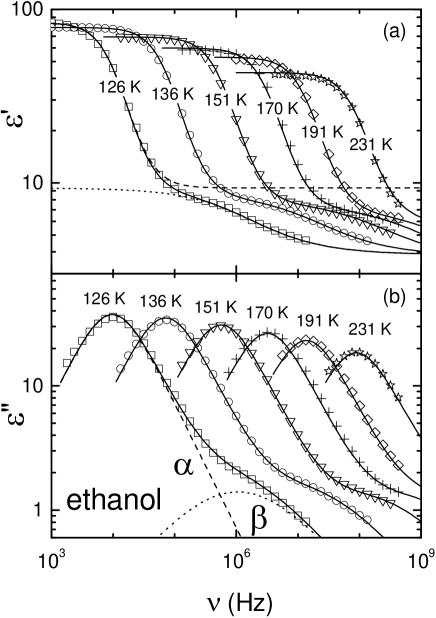
The most important result of the present work is revealed at temperatures : At frequencies about two decades above a shoulder shows up, i.e. exhibits a downward curvature [see also Fig. 2(b)]. This finding clearly indicates the presence of a third relaxation process in ethanol. This notion is confirmed by the observation of well-developed additional relaxation steps in as demonstrated in Fig. 2(a). The loss-spectra at temperatures , presented in [16] obviously do not provide sufficient precision or sufficiently high frequencies to allow for a detection of this relaxation. Instead only a feature resembling an excess wing was observed. In [17] the data at are reported for and in a semilogarithmic plot only, which prevented the observation of this relaxation. In the following the newly detected relaxation will be termed ”-relaxation” and the relaxation observed in the glass state (denoted as ”-relaxation” in [16, 17]) will be called ”-relaxation”. This nomenclature is simply intended to take account of the succession of these relaxations in the frequency window, without making a statement about their physical origin.
Figure 1 strongly suggests that the -relaxation, resolved as a shoulder at high temperatures, develops into an apparent excess wing at low temperatures. Here the situation is similar to that suggested by us for the explanation of the excess wing in glycerol and propylene carbonate [10]: Due to the close vicinity of - and -relaxation times, only the high-frequency flank of the -peak shows up as an apparent excess wing. The solid lines in Figs. 1 and 2 are fits with the sum of the empirical Cole-Davidson (CD) and Cole-Cole (CC) functions [27], very similar to the approach in [17] where a sum of two CD functions was used for fits at lower temperatures [28]. Instead of the second CD function, in the present work a CC function was chosen, which is known to often provide a satisfactory parameterization
of -relaxations. Indeed good fits of the experimental data are possible in this way, including the lower temperatures, where no shoulder is observed (Fig. 1). In this region it is difficult to determine the -relaxation time unequivocally and therefore it was fixed at values obtained from an extrapolation of the high-temperature data as explained in detail below. At deviations of fits and experimental data show up at , which can be ascribed to the successive transition of the sample into the plastic-crystalline state during heating, as mentioned above.
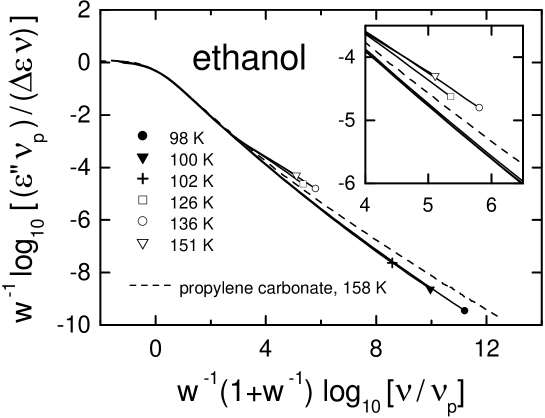
A commonly used description of the excess wing is the so-called Nagel-scaling [5]. For many glass-formers, the -curves for different temperatures and materials can be scaled onto one master curve by plotting vs. . Here denotes the half-width of the loss peak normalized to that of a Debye-peak [27] and is the relaxation strength. In Fig. 3 a Nagel-scaling plot of the present data is shown. In addition, a curve for supercooled propylene carbonate is included, which closely follows the master curve reported in [5] extending it to higher values of the abscissa [29]. The scaled data for ethanol show marked deviations from this curve. For , the curves are located above the master curve, due to the contributions from the newly detected -relaxation. Similar deviations were observed in orientationally disordered cyclo-octanol [30] where a -relaxation was shown to be responsible for the apparent excess wing reported in [12]. In contrast, the scaled curves for fall below the master curve, similar to our findings in various orientationally disordered crystals [31]. This behavior is of special significance as spectra falling above the master curve may always be explained assuming contributions in addition to the excess wing, but this is not the case for spectra falling below the master curve. The Nagel-scaling seems to be clearly violated in glass-forming ethanol.
The width parameter [27] of the -relaxation, obtained from the fits in Figs. 1 and 2, varies between at and at . The width parameter [27] decreases from to with temperature. However, at a clear statement concerning its temperature development is not possible, as the curves start to shift out of the investigated frequency window. At and are equal to the exponents of the two power laws, and observed at . The predicted relation between theses exponents, [3], is not fulfilled in supercooled ethanol. This could be expected having in mind that this relation was deduced from the Nagel-scaling, which seems to be violated in glass-forming ethanol (Fig. 3).
B Relaxation times
In Fig. 4(a) the relaxation times of the three processes detected in the present work are shown in an Arrhenius representation. In contrast to the earlier reports [16, 17], the temperature range investigated in the present work is more complete, allowing for a detailed analysis of the temperature dependent -relaxation time in glass-forming ethanol. The average -relaxation times shown in Fig. 4(a) have partly been determined from the fits shown in Figs.
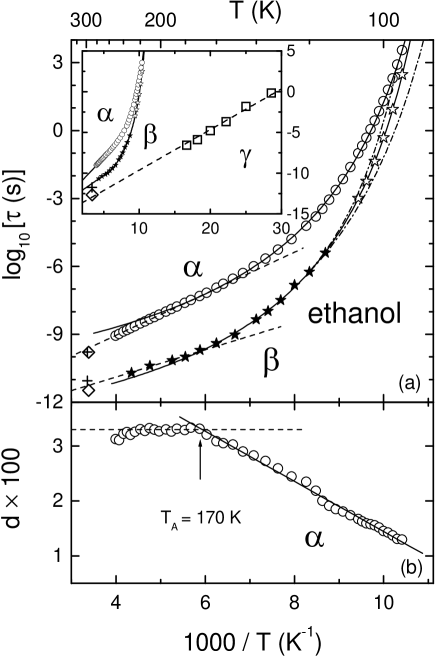
1 and 2 ( [27]), performed at selected temperatures only, and partly calculated from . The latter estimation involves an error of less than 5% as long as . Often the Vogel-Fulcher-Tammann (VFT) law, [32], is employed to parameterize the -relaxation time in disordered materials, with the Vogel-Fulcher temperature and the strength parameter [33]. Indeed at temperatures , of glass-forming ethanol [circles in Fig. 4(a)] can be well described in this way (the parameters of this and the other fits shown in Fig. 4 are collected in Table 1). At high temperatures, shows deviations from a VFT law. In Fig. 4(a) they were taken into account by assuming a transition to thermally activated behavior (dashed line) [25]. This notion finds support in the derivative plot after Stickel et al. [38] [Fig. 4(b)], where is plotted vs. the inverse temperature. This plot leads to a linearization of the VFT law and to a constant for thermally activated behavior. A similar analysis was performed in [25] where was deduced in reasonable agreement with the present value. However, one should mention that the use of derivatives for the test of fitting formulas and theoretical predictions can be criticized [34]. Based on various theoretical models of the glass-transition, many alternative descriptions of -curves in glass-forming materials have been proposed, e.g. in [35]. They often lead to fits of similar quality [36, 37] and often it is difficult to arrive at a decision in favor or against a specific model from the analysis of the -relaxation time. In Fig. 4(a) we also include results from microwave [22] and far-infrared investigations [23] of liquid ethanol at room-temperature. The spectra in [22, 23] were analyzed assuming a sum of three Debye-relaxations. The slowest relaxation time obtained in this way is in reasonable accord with an extrapolation of the high-temperature Arrhenius-law used for the description of our data.
In the inset of Fig. 4 the -relaxation time is included. It agrees reasonably with the results reported earlier [16, 17] and is consistent with the fastest relaxation time reported in [22, 23]. The dashed line is a fit of the present data and the room-temperature point from [23] using an Arrhenius law.
The filled stars in Fig. 4(a) represent the -relaxation time obtained from the fits of with the sum of a CD and a CC function (Figs. 1 and 2). Again the present results can be reasonably extrapolated to the relaxation times of the second-fastest process reported in [22, 23] by assuming a thermally activated behavior above (dashed line). Towards lower temperatures, significantly deviates from an Arrhenius behavior and can be described by a VFT law (solid line). At low temperatures, where a shoulder is no longer observable (Fig. 1), it is difficult to unequivocally determine from the fits. Therefore for the fits shown in Fig. 1 at , was fixed at values obtained from an extrapolation of the VFT law towards low temperatures [open stars in Fig. 4(a)]. However, it is possible to determine a lower-limit value of by performing fits with , fixed at successively lower values, until intolerable deviations of experimental data and fit occur. The lower dash-dotted line in Fig. 4(a) is the lowest possible VFT curve taking into account these lower-limit values of . An upper-limit VFT curve was deduced by assuming a maximum possible value of at [upper dash-dotted line in Fig. 4(a)].
Irrespective of these uncertainties at low temperatures, exhibits clear deviations from a thermally activated behavior. Therefore one may have objections to use the term ”-relaxation” for the relaxation, causing the excess wing in supercooled ethanol, because -relaxations are commonly found to follow an Arrhenius behavior. However, there is no principle reason that -processes always should behave thermally activated, especially as their microscopic origin is still unclear. Already Johari [7] suspected that in systems without a well resolved -process the relaxation times of - and -process are closer together due to a uncommon temperature dependence of . In some respects, in ethanol the situation is similar to that in glycerol or propylene carbonate. In these materials, from aging experiments at , we also found a -relaxation as the probable cause of the excess wing [10]. Here the -relaxation time also deviates from thermally activated behavior [11] and the -relaxation is difficult to detect due to the lack of a clear separation of and .
In this context it is of interest that recently for glass-formers with a well pronounced -relaxation a correlation of and the Kohlrausch-exponent (describing the width of the -peak), both at , was found [9]: increases nearly linearly with . It was noted that those glass-formers that show no well-resolved -relaxation, e.g. glycerol or propylene carbonate, have relatively large values of . As the mentioned correlation implies that the - and -timescales approach each other with increasing , it is easily rationalized that in those materials the -relaxation is difficult to observe. Indeed we find a relatively large for glass-forming ethanol. Using the linear relationship of log and given in [9], leads to the prediction log, which agrees well with the extrapolated VFT law for the -process, shown in Fig. 4(a). In [9] an explanation of this relationship within the coupling model [39] was proposed, which also may be consistent with the observed deviation of from thermally activated behavior.
On the other hand, it should be mentioned that the relaxation-time plot of glass-forming ethanol [Fig. 4(a)] looks quite similar to that determined for 1-propanol [40, 41]. In this material (and other primary alcohols [21]) also three relaxation processes have been detected by dielectric spectroscopy [40, 41]. Similar to the present results, the relaxation time of the second process in 1-propanol was found to exhibit marked deviations from thermally activated behavior. In [40] the explanation for the observed relaxation behavior is quite different to the picture developed above: The second process was interpreted as the ”true” -relaxation. This picture is based on the finding that the relaxation dynamics of the second relaxation in 1-propanol is paralleled by data obtained from methods coupling to the structural relaxation. The low-temperature/high-frequency process (denoted as -relaxation in the present work) was assumed to be a Johari-Goldstein -relaxation. In [40] the dominating Debye-type low-frequency process was termed ”-relaxation” and assigned to distinct OH-group motions, but also other explanations were proposed [20, 42]. Interestingly the present -data of ethanol are of similar magnitude as (but not identical to) the average molecular rotation times determined from NMR measurements [19]. However, they clearly deviate from the results of mechanical spectroscopy [43]. Also it is noteworthy that the slowest process in ethanol exhibits deviations from Debye behavior at low temperatures, in contrast to the ”-relaxation” in 1-propanol.
| Arrhenius | VFT | ||||
|---|---|---|---|---|---|
| process | |||||
IV SUMMARY
In the present dielectric investigation of glass-forming ethanol we have found clear evidence for a third, so-far undetected relaxation process. For the physical origin of the three processes two different scenarios are possible: The similarity of the relaxation map of ethanol with that found in glass-forming 1-propanol suggests a similar explanation of these processes as promoted in [40], especially concerning the identification of the second process with the structural -relaxation. Alternatively, the second process may be simply a Johari-Goldstein -process with an uncommon non-Arrhenius temperature dependence, similar to our findings in glycerol and propylene carbonate [10]. However, the main result of the present study remains unaffected by these open questions: The apparent excess wing in glass-forming ethanol [16, 17], is due to the newly detected relaxation process. This finding further corroborates the notion that the excess wing is not a separate feature in the spectra of glass-formers, but can be commonly ascribed to additional relaxation processes [10]. In addition, we can state a clear violation of the Nagel-scaling [5] in glass-forming ethanol, at least if the parameters of the slowest relaxation are used for the scaling. Of course this may be unjustified, if the scenario analogous to 1-propanol [40] is correct. In this case it is difficult to make a statement about the Nagel-scaling due to the interference of the ”-relaxation” with the ”-relaxation” at low and the ”-relaxation” at high frequencies. Finally, in the light of our finding of the absence of the excess wing in orientationally disordered crystals [31], it certainly would be of interest to check also for the presence of a third process in the plastic crystalline phase of ethanol. Such measurements are currently in progress and will be reported in a future publication.
ACKNOWLEDGMENTS
We thank S. Benkhof for calling our attention to dielectric measurements in ethanol. This work was financially supported by the Deutsche Forschungsgemeinschaft, Grant-Nos. LO264/8-1 and LO264/9-2 and partly by the BMBF, contract-No. EKM 13N6917.
REFERENCES
- [1] for an overview, see: P. Lunkenheimer, U. Schneider, R. Brand, and A. Loidl, Contemporary Physics 41, 15 (2000).
- [2] A. Hofmann, F. Kremer, E.W. Fischer, and A. Schönhals, in: Disorder Effects on Relaxational Processes, ed. R. Richert and A. Blumen (Springer, Berlin, 1994), p. 309.; P. Lunkenheimer, A. Pimenov, B. Schiener, R. Böhmer, and A. Loidl, Europhys. Lett. 33, 611 (1996).
- [3] N.M. Menon and S.R. Nagel, Phys. Rev. Lett. 74, 1230 (1995); R.L. Leheny and S.R. Nagel, Europhys. Lett. 39, 447 (1997).
- [4] D.W. Davidson and R.H. Cole, J. Chem. Phys. 18, 1417 (1950).
- [5] P.K. Dixon, L. Wu, S.R. Nagel, B.D. Williams, and J.P. Carini, Phys. Rev. Lett. 65, 1108 (1990).
- [6] A. Kudlik, S. Benkhof, T. Blochowicz, C. Tschirwitz, and E. Rössler, J. of Molecular Structure 479, 201 (1999).
- [7] G.P. Johari and M. Goldstein, J. Chem. Phys. 53, 2372 (1970).
- [8] They should not be confused with the fast -relaxation, prevailing in the region [see, e.g. P. Lunkenheimer, A. Pimenov, M. Dressel, Yu. G. Goncharov, R. Böhmer, and A. Loidl, Phys. Rev. Lett. 77, 318 (1996)].
- [9] K.L. Ngai, Phys. Rev. E 57, 7346 (1998); K.L. Ngai, J. Chem. Phys. 109, 6982 (1998).
- [10] U. Schneider, R. Brand, P. Lunkenheimer, and A. Loidl, submitted to Phys. Rev. Lett. (cond-mat/0001055).
- [11] P. Lunkenheimer, Dielectric spectroscopy of glassy dynamics (Shaker Verlag, Aachen, 1999).
- [12] D.L. Leslie-Pelecky and N.O. Birge, Phys. Rev. Lett. 72, 1232 (1994).
- [13] R. Brand, P. Lunkenheimer, and A. Loidl, Phys. Rev. B 56, R5713 (1997).
- [14] R. Fayos, F.J. Bermejo, J. Dawidowski, H.E. Fischer, and M.A. González, Phys. Rev. Lett. 77, 3823 (1996); M.A. Ramos, S. Vieira, F.J. Bermejo, J. Dawidowski, H.E. Fischer, H. Schober, M.A. González, C.K. Loong, and D.L. Price, Phys. Rev. Lett. 78, 82 (1997); H.E. Fischer, F.J. Bermejo, G.J. Cuello, M.T. Fernández-Diáz, J. Dawidowski, M.A. González, H. Schober, and M. Jiménez-Ruiz, Phys. Rev. Lett. 82, 1193 (1999).
- [15] M.A. Miller, M. Jiménez-Ruiz, F.J. Bermejo, and N.O. Birge, Phys. Rev. B 57, R13977 (1998).
- [16] S. Benkhof, A. Kudlik, T. Blochowicz, and E. Rössler, J. Phys.: Condens. Matter 10, 8155 (1998).
- [17] M. Jiménez-Ruiz, M.A. González, F.J. Bermejo, M.A. Miller, N.O. Birge, I. Cendoya, and A. Alegriá, Phys. Rev. B 59, 9155 (1999).
- [18] O. Haida, H. Suga, and S. Seki, J. Chem. Thermodynamics 9, 1133 (1977); A. Srinivasan, F.J. Bermejo, A. de Andrés, J. Dawidowski, J. Zúñiga, and A. Criado, Phys. Rev. B 53, 8172 (1996).
- [19] T. Eguchi, G. Soda, and H. Chihara, Molecular Physics 40, 681 (1980)
- [20] F.X. Hassion and R.H. Cole, J. Chem. Phys. 23, 1756 (1955).
- [21] S.K. Garg and C.P. Smyth, J. Phys. Chem. 69, 1294 (1965).
- [22] J. Barthel, K. Bachhuber, E. Buchner, and H. Hetzenauer, Chem. Phys. Lett. 165, 369 (1990).
- [23] J.T. Kindt and C.A. Schmuttenmaer, J. Phys. Chem. 100, 10373 (1996).
- [24] F.-J. Stickel, Untersuchung der Dynamik in niedermolekularen Flüssigkeiten mit Dielektrischer Spektroskopie (Shaker Verlag, Aachen, 1995).
- [25] F. Stickel, E.W. Fischer, and R. Richert, J. Chem. Phys. 104, 2043 (1996).
- [26] U. Schneider, P. Lunkenheimer, A. Pimenov, R. Brand, and A. Loidl, submitted to Ferroelectrics (cond-mat/9908279).
- [27] C.J.F. Böttcher and P. Bordewijk, Theory of Electric Polarization (Elsevier, Amsterdam, 1978).
- [28] The justification for using such a simple additive ansatz is controversially discussed [e.g., E. Donth, K. Schröter, and S. Kahle, Phys. Rev. E 60, 1099 (1999); A. Arbe, J. Colmenero, D. Gómez, D. Richter, and B. Farago, ibid., 60, 1103 (1999)], but nevertheless seems sufficient for a preliminary analysis.
- [29] U. Schneider, R. Brand, P. Lunkenheimer, and A. Loidl, Euro. Phys. J. E, in press (cond-mat/9908476).
- [30] P. Lunkenheimer, R. Brand, U. Schneider, and A. Loidl, Phil. Mag. 79, 1945 (1999).
- [31] R. Brand, P. Lunkenheimer, U. Schneider, and A. Loidl, Phys. Rev. Lett. 82, 1951 (1999).
- [32] H. Vogel, Z. Phys. 22, 645 (1921); G.S. Fulcher, J. Am. Ceram. Soc. 8, 339 (1925); G. Tammann and W. Hesse, Z. Anorg. Allg. Chem. 156, 245 (1926).
- [33] C.A. Angell, in Relaxations in Complex Systems, ed. K.L Ngai and G.B. Wright (NRL, Washington, D.C., 1985), p.3.
- [34] D. Kivelson, G. Tarjus, X. Zhao, and S.A. Kivelson, Phys. Rev. E 53, 751 (1996).
- [35] M.H. Cohen and G.S. Grest, Phys. Rev. B 20, 1077 (1979); G.S. Grest and M.H. Cohen, Adv. Chem. Phys. 48, 455 (1981); W. Götze and L. Sjögren, Rep. Progr. Phys. 55, 241 (1992); D. Kivelson, S.A. Kivelson, X-L. Zhao, Z. Nussinov, and G. Tarjus, Physica A 219, 27 (1995).
- [36] U. Schneider, P. Lunkenheimer, R. Brand, and A. Loidl, Phys. Rev. E 59, 6924 (1999).
- [37] H.Z. Cummins, G. Li, Y.H. Hwang, G.Q. Shen, W.M. Du, J. Hernandez, and N.J. Tao, Z. Phys. B 103, 501 (1997).
- [38] F. Stickel, E.W. Fischer, and R. Richert, J. Chem. Phys. 102, 6251 (1995).
- [39] K.L. Ngai, Comments Solid State Phys. 9, 127 (1979); K.L. Ngai, in: Disorder Effects on Relaxational Properties, edited by R. Richert and A. Blumen (Springer, Berlin, 1994), p. 89.
- [40] C. Hansen, F. Stickel, T. Berger, R. Richert, and E.W. Fischer, J. Chem. Phys. 107, 1086 (1997).
- [41] A. Kudlik, C. Tschirwitz, S. Benkhof, T. Blochowicz, and E. Rössler, Europhys. Lett. 40, 649 (1997).
- [42] M.A. Floriano and C.A. Angell, J. Chem. Phys. 91, 2537 (1989).
- [43] J. Emery, S. Gasse, E.A. Pethrick, and D.W. Phillips, Adv. Mol. Relax. Interact. Processes 12, 47 (1978).