Modifications of the hydrogen bond network
of liquid water in a cylindrical pore
Abstract
We present results of molecular dynamics simulations of water confined in a silica pore. A cylindrical cavity is created inside a vitreous silica cell with geometry and size similar to the pores of real Vycor glass. The simulations are performed at different hydration levels. At all hydration levels water adsorbs strongly on the Vycor surface; a double layer structure is evident at higher hydrations. At almost full hydration the modifications of the confinement-induced site-site pair distribution functions are in qualitative agreement with neutron diffraction experiment. A decrease in the number of hydrogen bonds between water molecules is observed along the pore radius, due to the tendency of the molecules close to the substrate to form hydrogen-bonds with the hydrophilic pore surface. As a consequence we observe a substrate induced distortion of the H-bond tetrahedral network of water molecules in the regions close to the surface.
Electronic mail: eckhard.spohr@chemie.uni-ulm.de
1 Introduction
The increasing interest in the study of structural and dynamical properties of confined water in different environments arises from the close connection with many relevant technological and biophysical problems [1]. It is well known that the properties of liquid water at ambient conditions are mainly determined by the microscopic local tetrahedral order [2]. Understanding how the connected random hydrogen bond network of bulk water is modified when water is confined in small cavities inside a substrate material, is very important, e. g., for studies of stability and enzymatic activity of proteins, oil recovery, or heterogeneous catalysis, where water-substrate interactions play a fundamental role. The modifications of the short range order in the liquid depend on the nature of the water-substrate interaction, i.e. hydrophilic or hydrophobic, as well as on its spatial range and on the geometry of the substrate. Many experimental studies of structural and dynamical properties of water in confined regimes have been performed [1, 3, 4, 5, 6, 7, 8]. Water-in-Vycor is one of the most extensively studied systems. In particular, it has been found in a recent neutron scattering experiment [5, 6] that the hydrogen bond network of water in Vycor is strongly distorted with respect to bulk water. In order to shed light on this behavior, which was not evident in previous experiments [4], a more extensive study of the microscopic details of the molecular arrangement is needed.
Computer simulation methods allow a more detailed exploration of the molecular arrangements inside the system than most experimental techniques. They can therefore be considered as an ideal microscopic tool to study the properties of water in confined geometries, subject, of course, to the usual limitations of the method and the interaction potential functions employed. In this paper we present results obtained by a computer simulation study of water confined in a model for a Vycor glass pore. The simulation cell is obtained by carving a single cylindrical cavity in a modeled silica glass, thus reproducing the symmetry, the average dimensions, and the structure of the rough surface of Vycor pores at the atomic level.
In the next section we will briefly review the method for building the simulation cell and the implementation of the molecular dynamics. In the following sections we summarize some of the key results and compare them with recent experiments. The discussion is more detailed than in earlier work by our groups [9, 10].
2 Model for the Vycor pore and molecular dynamics calculations
A glass of is obtained by computer simulation, following the method proposed by Brodka and Zerda [11], using potential parameters given by Feuston and Garofalini [12]. The system is simulated as a simple ionic model for and ions [13]. Inside a cell of vitreous SiO2 with a box length of approximately 71 Å a cylindrical cavity of 40 Å diameter, corresponding to the average pore size of the Vycor glass of interest, is created. The details for generating the cavity with a rough surface and microscopic structure representative for pores in Vycor glass are given in previous publications [10, 14]. On the surface of the pore two types of oxygen atoms can be distinguished, depending on the number of silicon atoms to which they are connected. Nonbridging oxygens (NBO’s) are bonded to only one silicon atom and are saturated with a hydrogen atom. The number density of the hydroxyl groups in our samples is 2.5 , in good agreement with the experimentally determined value [15]. The second species of surface oxygen atoms are bridging oxygens (BO’s), which are connected to two silicon atoms.
For the water-water interaction we assume the SPC/E model [16]. The atoms of the substrate are allowed to interact with the water sites by means of the Coulomb potential, where different fractional charges are assigned to BO’s (), NBO’s (), silicon atoms () and surface hydrogen atoms (). In addition both BO’s and NBO’s interact with the oxygen sites of water via a Lennard-Jones potential, whose parameters are Å and Å for BO and NBO atoms, respectively, and K in both cases [11]. During the simulation the Vycor atoms are kept fixed, and periodic boundary conditions are applied along the -axis. The shifted force method is used with a cut-off at 9 Å. As discussed in a previous paper [10], the use of larger cut-off or Ewald summation does not change the nature of the obtained results. The temperature is controlled by means of a Berendsen thermostat with relaxation times between 0.5 and 1 ps. This procedure simplifies running the simulations over long times but has negligible effects on the calculated properties. All calculations have been performed at room temperature for several hundred picoseconds, after an equilibration run lasting more than 50 ps. More details can be found in Ref. [10].
3 Structural properties of the confined water

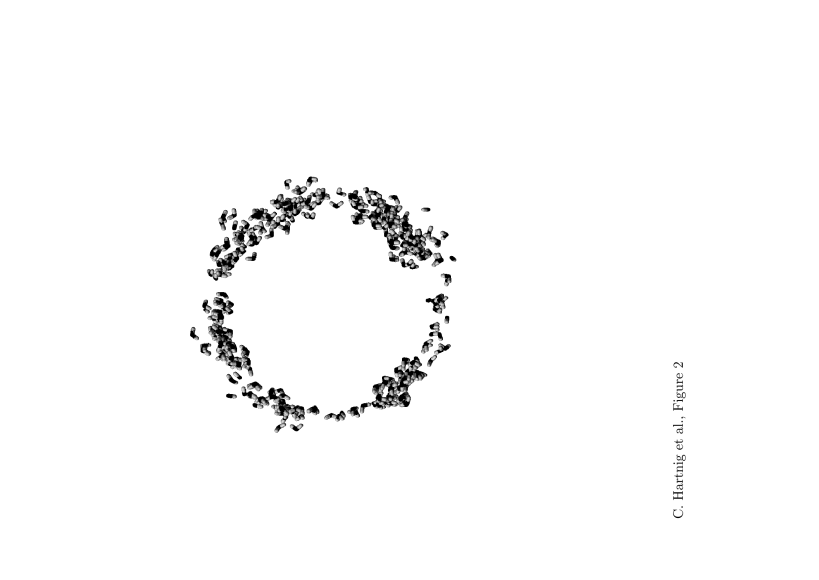
The molecular dynamics calculations have been performed for different numbers of water molecules, corresponding to different levels of hydration. The density profiles of the oxygen and hydrogen atoms of water for 96% (2600 water) and 19% degree of hydration (500 water) are shown in Fig. 1. Density profiles and further results of several intermediate degrees of hydration have been published elsewhere [10]. We observe already at low hydration the presence of a layer of water molecules wetting the substrate surface; at nearly full hydration two layers of water with higher than average density are evident. The same features are present in the density profiles for the hydrogen atoms. Few molecules are able to penetrate into the glass and are trapped inside small pockets close to the surface, which are a byproduct of the ’sample preparation process’. The molecules in these pockets can easily be identified in the snapshot along the pore axis in Fig. 2. At low hydrations the surface is not covered completely; adsorption occurs preferentially in several regions, in which small clusters are formed. We have made no attempt to identify specific surface structures that favor cluster formation.
In the comparison with experiment the definition of the hydration level deserves some consideration. Full hydration in the experimental sample preparation corresponds to an estimated water density which is less than the density of water at ambient conditions [17]. If the simulated cavity would be a perfect cylinder of radius 20 Å, this would translate into molecules. Due to the roughness of the glass surface and the existence of the small pockets inside the glass close to the surface, which trap several water molecules over the entire simulation length, the exact number of molecules can only be determined by a grand canonical simulation scheme. For the investigated number we observe indeed that the density profile does not reach the bulk value in the center of the pore. If one assumes that full hydration corresponds to a bulk-like region in the center of the pore, we estimate that an additional 100 molecules would correspond to full hydration, not much different from the experimental value. Thus, corresponds to a hydration level of approximately 96%.

We calculate the site-site radial distribution functions for , i. e., at approximately the experimental density. The calculation of these functions is not straightforward when dealing with a non-periodic system, since excluded volume effects must be carefully taken into account [6, 18, 19]. Unlike a bulk liquid, a uniform confined fluid, i.e., a collection of non-interacting particles in a confining volume, where periodic boundary conditions are only along the -axis, does not create a uniform radial distribution function . Rather, the form of the radial distribution function depends on the geometry of the confining system.
If we disregard the confinement effects, the raw site-site pair correlation functions can be calculated in the usual way from the simulation by taking the average number of sites of type lying in a spherical shell at distance from a site of type and normalizing it to the average number of atoms in the same spherical shell in an ideal gas at the same density [20]
| (1) |
where is the total number of sites, and is the volume of the cylindrical cell. The three resulting raw site-site correlation functions are shown in Fig. 3. It is evident that the three functions do not approach a constant value at large . The normalization factor in (1) must also include a uniform profile,
| (2) |
is the form factor of the cylindrical simulation cell of height and radius [21]
| (3) |
where are the spherical Bessel functions of the first kind of order . The resulting is the smooth dashed line shown in Fig. 3.

The properly normalized oxygen-oxygen and oxygen-hydrogen site-site distribution functions are then obtained by dividing by . The correction factor , which lies between 1.0 and 1.04, takes into account the roughness of the surface and has been adjusted in such a way that the corrected pair correlation functions are close to one in the region Å. The corrected pair correlation functions are shown in Fig. 4 and are compared to the corresponding functions of SPC/E water at ambient conditions (dashed lines). We note that the modification of the oxygen-oxygen function relative to bulk water shows a similar trend as the experimental one (see Fig. 7a in Ref. [6]). The first minimum becomes shallower and fills in. Such behavior was also observed in experiments and computer simulations of water under pressure, which was explained as resulting from a collapsing hydrogen-bond network [22, 23]. In the oxygen-hydrogen function we notice that the first peak is lower in amplitude and the first minimum shifts towards shorter distances, as was observed in the experiment (Fig. 7b in Ref. [6]). Agreement with experimental results is less satisfactory in the case of the hydrogen-hydrogen pair correlation function. The experimental function is changed much more than the simulated one. The differences may be due to the fact that, in the experiment, the hydroxyl hydrogen atoms of Vycor are not distinguished from water hydrogen atoms.
We conclude that our results are in qualitative agreement with the experimental trend for the confinement-induced changes in water structure. According to Ref. [6], those changes indicate a distortion of the H-bond ordering in the confined water, induced by the interaction with the substrate. The distortion of the hydrogen bond network deserves further investigation. Since there are several approximations made in extracting the water-water contribution from the measured structure factors, computer simulations can contribute to our understanding by first providing a more detailed analysis of the simulated hydrogen bond network than is possible in experiment, and second by investigating the differences between water molecules located at various distances from the substrate surface.
4 Hydrogen bond network of confined water

In a first attempt to characterize the hydrogen bond network, we calculated the number of hydrogen bonds between water molecules and between water molecules and surface atoms. A geometric criterion is applied. A hydrogen bond exists between two oxygen atoms, if the angle between the intramolecular O-H vector and the intermolecular OO vector is less than , provided that the OO separation is less than Å. In Fig. 5 we show the results for . Close to the surface the number of water-water hydrogen bonds is reduced; a large number of interfacial water molecules is engaged in hydrogen bonds between water molecules and oxygen atoms of the pore surface. Taking the sum of both contributions, one can see that the total number of hydrogen bonds remains constant and the loss of water-water hydrogen bonds is compensated by water-Vycor bonds. Only bridging oxygen atoms of the Vycor surface contribute significantly to the number of hydrogen bonds; the amount of bonds between hydroxyl groups on the surface and water molecules is small and therefore not shown in Fig. 5. It is worth noticing that at this high level of hydration the average number of H-bonds is always lower than the number of bonds formed by bulk SPC/E water.
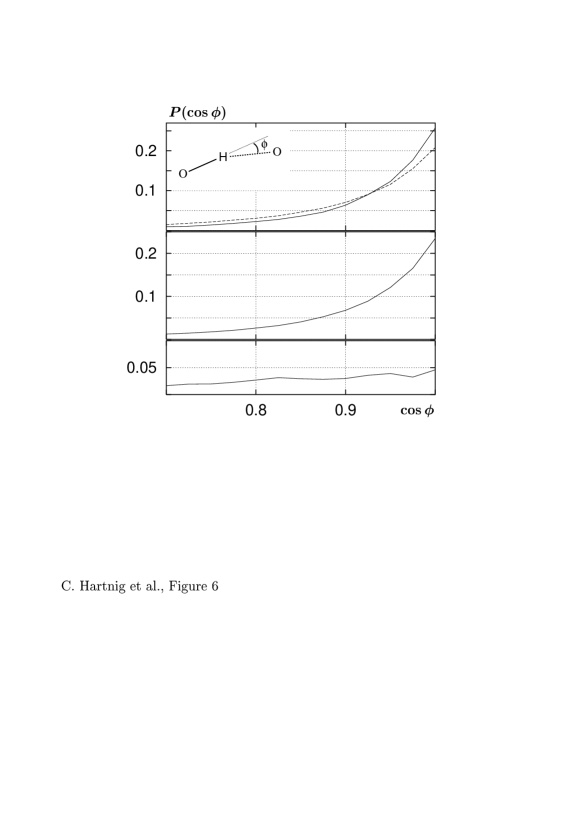
In Fig. 6 we have investigated the distribution of hydrogen bond angles in more detail for the simulation with . The figure depicts the distribution of , where is the angle between intramolecular O-H and intermolecular HO vector (see inset). Only that part of the distribution which corresponds to almost linear hydrogen bonds is shown. The top frame shows the distribution of water-water hydrogen bond angles close to the center of the cylinder (solid line) and close to the pore surface (dashed). While there is a reduction in the number of water-water bonds, their nature is not changed. By and large, linear water-water hydrogen bonds are favored. There is however, a tendency to have slightly more distorted hydrogen bonds close to the pore surface, as can be inferred from the reduced height of the distribution (dashed line) at and the increase for .
The center frame of Fig. 6 contains the corresponding distribution for the hydrogen bonds between water molecules and the bridging oxygen atoms. The distribution is almost identical to that between water molecules. Hence, the loss in water-water bonds is quantitatively (see Fig. 5) and structurally compensated by hydrogen bonds to Vycor atoms. The linearity of hydrogen bonds between water molecules and surface oxygen atoms on hydrophilic substrates was already observed by Lee and Rossky [24]. The angle distribution between water molecules and hydroxyl groups on the surface (bottom frame of Fig. 6) is uniform; there is no tendency to form linear bonds between water and NBO’s as in the case of water and BO’s. The probable cause is the fact that, contrary to Lee and Rossky’s work, all substrate atoms including the hydrogen atoms are immobile during the simulation and that, consequently, the hydroxyl groups are not able to reorientate in an optimal way to form hydrogen bonds with water molecules. Almost linear hydrogen bonds can, however, form between water molecules and BO’s due to the rotational mobility of the water molecule. Since the total number of hydrogen bonds between water and NBO’s is very small, we did not attempt to modify our model of the Vycor surface.

We have further analyzed the local structure around a water molecule. We explored the arrangement of nearest neighbor molecules by means of the distribution of the angle , which is the angle between the two vectors from an oxygen atom of a water molecule with the oxygen atoms of the two closest water neighbors (see inset of Fig. 7). Figure 7 shows the angular distribution function in the fully hydrated system with for different radial layers (full lines, as indicated). For comparison, the corresponding distribution for bulk water is given as the dashed lines. The arrows point to the average value of . Both in experiment and in simulation, the distribution function for bulk water at ambient conditions shows a well defined peak at (), representing the tetrahedral order, and a secondary peak at (), attributed to neighbors located in the cavities of the hydrogen bond network [25].
In Vycor glass the distributions near the center of the pore are similar to the bulk distribution. In the distribution in the innermost region with density less than ambient density, a more ordered tetrahedral structure than in the bulk phase is quite obvious. Closer to the boundary of the pore, the minimum between the main peak of the tetrahedral coordination and the peak at begins to fill in and for Å the distribution is monotonic, indicating a departure from the preferential tetrahedral arrangement. In the layer between 18 and 19 Å, there is an obvious preference for small angles. The average value, (arrows in Fig. 7), shifts to larger values from the center to the surface of the pore. The shift to larger values is a consequence both of the substrate-induced distortion of individual water-water hydrogen bonds and of the higher local density, which leads to a collapse of the tetrahedral structure due to packing effects.
5 Summary and Conclusions
We have performed molecular dynamics simulations of water in porous Vycor glass for different degrees of hydration, ranging from 19 to 96 %. In the present work, we analyzed the modifications of the hydrogen bond network of water at the highest degree of hydration. At nearly full hydration the structural properties of water in the center of the pore are similar to the bulk phase. We did not compare the chemical potential of water in the pore to that of bulk water.
Close to the surface the structure changes in several ways. Due to the hydrophilic properties of the surface the density distribution of hydrogen and oxygen atoms shows the formation of two layers of water molecules which interact with the Vycor surface; the water-water hydrogen bond network in the boundary region is distorted, as hydrogen bonds between water molecules are partially substituted by bonds from water to bridging oxygens of the Vycor glass. Hydrogen bonds close to the surface are still preferentially linear but show a larger deviation from linearity than hydrogen bonds in the center of the pore or in bulk water. The local tetrahedral arrangement of water molecules, however, is destroyed close to the surface due to the geometric confinement and the increased local density.
The presence of the pore surface also changes the radial pair distribution functions relative to those of bulk water. The minimum of the oxygen-oxygen radial distribution function fills in with respect to the bulk; this observation is familiar from water under pressure, where it also indicates a decrease in hydrogen bond order. The comparison of the pair correlation functions with experiment is encouraging, and we believe that further studies at different temperatures would be helpful for a deeper understanding of the phenomena concerned with the modification of hydrogen bonding in confined water.
Acknowledgments
We gratefully acknowledge financial support by the Fonds der Chemischen Industrie and the Clothilde Eberhardt Foundation.
References
- [1] S. H. Chen, and M. C. Bellissent-Funel, ”Hydrogen Bond Networks”, edited by M. C. Bellissent-Funel and J. C. Dore, NATO ASI Series C: Mathematical and Physical Science, 435, 337 (Kluwer Academic Publishers, 1994).
- [2] H.E. Stanley and J. Teixeira, J. Chem. Phys. 73, 3404 (1980).
- [3] M. C. Bellissent-Funel, and S. H. Chen, J. M. Zanotti Phys. Rev. E51, 4558 (1995); M. C. Bellissent-Funel, R. Sridi-Dorbez, and L. Bosio, J. Chem. Phys. 104, 10023 (1996).
- [4] M. C. Bellissent-Funel, J. Lal, and L. Bosio, J. Chem. Phys. 98, 4246 (1993).
- [5] F. Bruni, M. A. Ricci, and A. K. Soper, J. Chem. Phys. 109, 1478 (1998).
- [6] A. K. Soper, F. Bruni, and M. A. Ricci, J. Chem. Phys. 109, 1486 (1998).
- [7] D. C. Steytler, and J. C. Dore, Mol. Phys. 56, 1001 (1985); D. C. Steytler, J. C. Dore, and C. J. Wright, Mol. Phys. 48 , 1031 (1983).
- [8] C. F. Polzanek and R. G. Bryant, J. Chem.Phys 81, 4038 (1984); B. P. Hills, and G. le Floc’k, Mol. Phys. 82, 751 (1994).
- [9] M. Rovere, M.A. Ricci, D. Vellati and F. Bruni, J. Chem. Phys. 108, 9859 (1998).
- [10] E. Spohr, C. Hartnig, P. Gallo and M. Rovere, J. Mol. Liq., in print, 1999.
- [11] A. Brodka, and T. W. Zerda, J. Chem. Phys. 104, 6319 (1996).
- [12] B. P. Feuston and S. H. Garofalini, J. Chem. Phys. 89, 5818 (1988).
- [13] A. Rosenthal and S. Garofalini, J. Am. Ceram. Soc. 70, 821 (1987).
- [14] M. Rovere, M. A. Ricci, D. Vellati, and F. Bruni, J. Chem. Phys. 108, 9859 (1998).
- [15] Y. Hirama, T. Takahashi, M. Hino, and T. Sato, J. Colloid Interface Sci. 184, 349 (1996).
- [16] H. J. C. Berendsen, J. R. Grigera and T. P. Straatsma, J. Phys. Chem. 91, 6269 (1987).
- [17] J.-C. Li, K. Ross, and M. J. Benham, J. Appl. Cryst. 24, 794 (1991).
- [18] A. K. Soper, J. Phys.: Condensed Matt. 9, 2399 (1997).
- [19] B.M. Ladanyi and M. S. Skaf, Annu. Rev. Phys. Chem. 44, 335 (1993).
- [20] M. P. Allen and D. J. Tildesley, Computer Simulation of Liquids (Oxford 1987).
- [21] O. Glatter and O. Kratky Small Angle X-ray Scattering (Academic, New York, 1992).
- [22] A. V. Okhulkov, Y. N. Damianets, and Y. E. Gorbaty, J. Chem. Phys. 100, 1578 (1994).
- [23] G. Pálinkás, P. Bopp, G. Jancsó and K. Heinzinger, Z. Naturforsch. 39a, 179 (1983).
- [24] S. H. Lee and P. J. Rossky, J. Chem. Phys. 100, 3334 (1994).
- [25] P. Jedlovsky, J. P. Brodholt, F. Bruni, M. A. Ricci, A. K. Soper, and R. Vallauri, J. Chem. Phys. 108, 8258 (1998).