Critical behavior of thermopower and conductivity at the metal-insulator transition in high-mobility Si-MOSFET’s
Abstract
This letter reports thermopower and conductivity measurements through the metal-insulator transition for 2-dimensional electron gases in high mobility Si-MOSFET’s. At low temperatures both thermopower and conductivity show critical behavior as a function of electron density which is very similar to that expected for an Anderson transition. In particular, when approaching the critical density from the metallic side the diffusion thermopower appears to diverge and the conductivity vanishes. On the insulating side the thermopower shows an upturn with decreasing temperature.
pacs:
PACS: 71.30.+h, 73.40.-cScaling theory of non-interacting, disordered, electron gases predicts that no metal-insulator transition (MIT) occurs in 2 dimensions [1, 2, 3] as temperature . Nevertheless, what appears to be a MIT has been observed (at finite, though low ), first in Si-MOSFET’s [4] and more recently in many other 2-dimensional (2D) hole and electron gases [5]. In the particular case of Si-MOSFET’s, the transition is most clearly visible in high-mobility samples, roughly m2/V s. As the density, , is varied, there is a particular value, , above or below which the resistivity shows metallic or insulating temperature dependence respectively. For the present purposes we will use as a working definition that negative indicates an ‘insulator’, and positive at the lowest temperatures we can reach corresponds to a ‘metal’ (possible deviations from this definition and the consequences will be mentioned later). At not too close to , metallic behaviour is visible over a wide range of , roughly where is the Fermi energy. The decrease of in the metallic state for high mobility samples is typically two orders of magnitude larger than can be accounted for by electron-phonon scattering.
Most previous work on these systems has focused on , though measurements of the compressibility [6] have also appeared recently. The present paper presents experimental data on the low temperature thermopower, , and conductivity, , both of which are found to exhibit critical behavior around . Earlier, a scaling behaviour was described [4] for the temperature dependence of over a temperature range . In contrast, we report a different type of critical behavior for . When we extrapolate our data on , typically taken over the range K, to the limit, we find a power-law critical behaviour as a function of on the metallic side. In addition, at our lowest temperature of around 0.3 K where diffusion thermopower dominates, appears to diverge when approaching . At there is an abrupt change in behavior of , with lower densities showing an upturn in as is decreased. Similar characteristics have long been predicted for an Anderson MIT in 3D [7, 8, 9, 10] but such a transition should not occur in 2D.
The main sample used for the present and measurements (Sample 1) is the same as that described in a previous paper [11] and the techniques used to measure can also be found there. This sample has m-2 (as defined as above) and a peak mobility m2/Vs at K. and have been measured as a function of , down to about 0.3 K, at many different values of . We have also analyzed independent data for two other samples over the same range of , Sample 2 from the same wafer with m-2, and Sample 3 [12] with peak m2/Vs and m-2. The major experimental problem was that of measuring thermoelectric voltages with the sample in the insulating state. For this purpose an amplifier with input bias current pA and input impedance was used. With some averaging it had a resolution of 0.1 V for source impedances of less than a few hundred k rising to about 1 V at 10-20 M, roughly the highest sample impedance in these measurements. With the sample in the metallic state, a Keithley 182 digital voltmeter usually gave the best compromise of input bias current, input impedance and noise. All connections to the sample had isolation resistance G and all leads were well shielded and filtered against rf interference.
In the metallic region is a linear function of gate voltage and it is believed to follow approximately the same dependence in the insulating region [13], at least close to . The results on the temperature dependence of on both the insulating and metallic side are not shown but are very similar to those seen in previous work [4, 12, 14]. In the metallic regime we have fitted our data on , typically over the range 0.3 K to 4.2 K, to the equation [12]
| (1) |
where , , and are fitting constants, in order to evaluate .
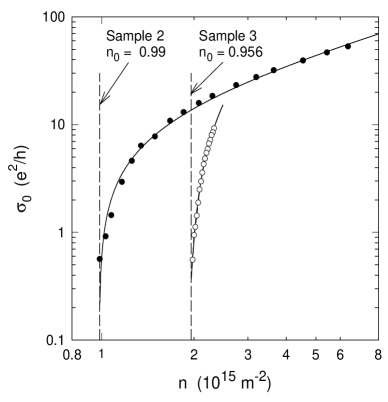
Figure 1 shows the results on as a function of . All samples follow the critical behaviour
| (2) |
The solid lines are the best fits with the following parameters (with in units of ). For sample 2, , and . Sample 1 has an identical behaviour within experimental error. The higher-mobility Sample 3 also follows the same equation with , and . These results suggest increases with peak mobility but clearly more data on a variety of samples are required. The values of for Sample 1 and 2 are consistent with zero within experimental uncertainty. For Sample 3, may be finite. However, if is allowed to decrease from to about m-2, a fit which is indistinguishable over the range of the data can also be obtained with , and . A small discrepancy in could arise from the identification of the critical density for the MIT with that density, , where changes sign, a procedure which has no firm physical foundation [15]. The critical behavior described by Eq. (2) with is formally the same as that expected for a (continuous) Anderson transition with a mobility edge at , whereas a finite would correspond to a (discontinuous) Mott-Anderson transition; neither transition should arise in a non-interacting 2D gas [1, 2]. The inclusion of interactions along with disorder is a much more complex and ongoing theoretical problem (e.g. see Refs. [2, 3] and references therein) and it is not yet clear if such transitions become possible under these conditions. Similar critical behaviour, usually with consistent with zero, has been seen in many 3D systems, typically with values [10] of in the range . There are only two previously reported cases related to 2D. Hanein et al. [16] have made a similar analysis to the one above for a 2D hole gas in GaAs and found a linear relation between and , but with a finite . Feng et al. [17] have also found scaling behaviour in a Si-MOSFET but it appears to be unrelated to that seen here.
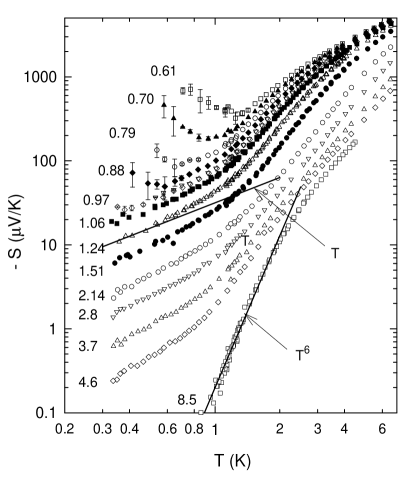
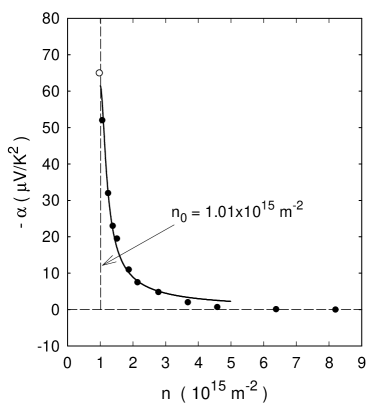
We now turn to the thermopower data. A selection of data on is shown in Fig. 2. At m-2 diffusion thermopower, , is almost zero and one sees only phonon drag, , which varies approximately as at the lowest temperatures.[11] As decreases, begins to show two distinct regions with different dependences. At K there is a relatively rapid increase of , roughly which is that expected for at intermediate temperatures.[11] At K, has a much weaker, approximately linear dependence indicative of becoming dominant; for , this low- behaviour, which is characteristic of ordinary metals, is replaced by an upturn in . Concentrating on the metallic region, the data at lowest are taken to give the best estimate of diffusion . Fig. 3 shows that as a function of appears to diverge as . One would expect a divergence when approaches a gap in the DOS but the present results are inconsistent with this explanation because Hall data [13] show that in the vicinity of the mobile carrier density equals within . However, Eq. (2) also implies a divergence of . Thus, with the assumption of a constant density of states (DOS) Eq. (2) is consistent with
| (3) |
Again, with this is formally equivalent to an Anderson transition with being the mobility edge. The use of the Mott relation with Eq. (3) and taking then gives [8, 10]
| (4) |
This result is valid only if ; in the opposite limit tends to a constant [9, 10] (V/K in 3D). Numerical calculations[10] show that the approximation of Eq. (4) gives a magnitude roughly a factor of 2 too large when which, for our samples, corresponds to at K (using the ideal DOS, , with an effective mass of ).
To simulate this saturation we add in the denominator (but allow it to be a variable when determining the best fit to the data) and, rewriting Eq. (4) in terms of , we have
| (5) |
where is a constant expected to be about 32 V/K2 for Sample 1, again using . If is finite in Eq. (3), then the Mott relation shows that it will contribute to the denominator of Eq. (4), also softening the divergence at . However, the experimental is so small that this is negligible compared to the finite- effect considered here. The best fit of the data to Eq. (5) gives and V/K2 and is shown as the solid line in Fig. 3. (As with , the fit can be improved if is slightly decreased). is consistent with that expected from the argument above, but is too small by a factor of about 3. However, we emphasize that we are comparing our results for a 2D system with a theoretical model of an Anderson MIT valid for non-interacting electrons in 3D. Some progress has been made on calculating with the inclusion of weak interactions and disorder [18]. Corrections are found which are logarithmic in and difficult to detect in thermopower; we are unable to explain the observed strong density dependence in terms of the calculations. We should mention that we can also represent the data over the same range using the simple expression V/K2, with in units of m-2, but this has no obvious physical explanation; in particular, it does not have the form that we would expect for approaching a band edge at , i.e. .
The data in the insulating regime also show a critical behaviour qualitatively consistent with a mobility edge. Thus the observed upturn of is expected for activated conduction across a mobility gap with . Under these conditions the 3D Anderson model predicts[7] (see also the numerical calculations in Ref. [10])
| (6) |
where is a constant of order unity. For m-2 the observed minima in occur at consistent with . Eq. (6) would then imply that the values of at these points should all have about the same magnitude. However, the observed will have other contributions. In particular there will be (see below) and also a contribution to from variable range hopping (VRH) through localized states. (When two or more conduction mechanisms are present, the appropriate are weighted by their contributions to ). The dependence of our data and other previously published data [14] in the insulating region are consistent with Efros-Shklovskii VRH across a soft Coulomb gap. For this mechanism one expects to be a constant given by[19, 20] where can be obtained from the temperature dependence of , e.g. Ref. [14], is the background DOS, and a constant . If we take (implying that may be in the tail of the DOS) and again using to estimate , we find that the calculated are typically a factor of two smaller than the values of observed at . The argument is not significantly changed if Mott VRH is assumed.[19, 20] In this case but the magnitudes calculated for are similar.
As far as we are aware, the only previous work which attempted to follow into the region of 2D electron localization was that of Burns and Chaikin[21] on thin films of Pd and PdAu. They found an upturn of in the strong localization region but no divergence at higher conductivities. The authors attributed their results to the opening of a Mott-Hubbard gap. In 3D, Lauinger and Baumann[22] observed critical behaviour of and a divergence of for metallic AuSb films, but the magnitude of the latter was 2 orders of magnitude smaller than seen here. Other 3D experiments on SiP[23] and NbSi[24] saw no divergence on the metallic side.
For completeness, we make a few comments about at higher where is dominant. Little is known about the behavior of near a MIT but it should be present on the metallic side though its precise form is not known[25]. On the other hand, requires conservation of crystal momentum for electron-phonon scattering so that for conduction via VRH.[20, 26] Thus, should only exist on the insulator side when excitation to delocalized states occurs. Our data show that at any fixed K, rises as decreases but crosses smoothly, i.e., we no longer see divergent behavior of at . These facts show that activated conduction must be present for all densities that we have investigated, even though data (both our own and those of others[14]) appear to follow the Efros-Shklovskii VRH model.
In summary, the behavior of and in the ‘metallic’ and ‘insulating’ phases in Si-MOSFETs are surprisingly consistent with a 3D Anderson MIT, though such a transition is not expected to occur in a 2D electron gas. Nevertheless, it is important to remember that to reliably identify the observed critical behaviour with a MIT requires data in the zero limit. Although our analysis is based on an extrapolation to zero , the actual data extend only to 0.3K. Thus we should be careful not to conclude that a mobility edge or a MIT has necessarily been observed. Even so, the present results provide new information on these systems that further constrains any theoretical model proposed to explain the MIT, whether such a transition be an apparent or real property as .
We acknowledge the support of the NSERC Canada, and from INTAS, RFBR, NATO, Programs ‘Physics of nanostructures’, ‘Statistical physics’ and ‘Integration’.
REFERENCES
- [1] E. Abrahams, P. W. Anderson, D. C. Licciardello, and T. V. Ramakrishnan, Phys. Rev. Lett. 42, 673 (1979).
- [2] Belitz and T. R. Kirkpatrick, Rev. Mod. Physics 66, 261 (1994).
- [3] V. Dobroslavljević, E. Abrahams, E. Miranda, and S. Chakravarty, Phys. Rev. Lett. 79, 455 (1997): S. Chakravarty, L. Yin, and E. Abrahams, Phys. Rev. B 58, R559 (1998).
- [4] S. V. Kravchenko, G. V. Kravchenko, J. E. Furneaux, V. M. Pudalov, and M. D’Iorio, Phys. Rev. B 50, 8039 (1994); S. V. Kravchenko, G. E. Bowler, J. E. Furneaux, V. M. Pudalov, and M. D’Iorio, Phys. Rev. B 51, 7038 (1995).
- [5] e.g. see A. R. Hamilton, M. Y. Simmons, M. Pepper, E. H. Linfield, P. H. Rose, and D. A. Ritchie, Phys. Rev. Lett. 82, 1542 (1999) and references therein.
- [6] S. Ilani, A. Yacoby, D. Mahalu, and H. Shtrikman, cond-mat /9910116: S. C. Dultz and H. W. Jiang, cond-mat/9909314.
- [7] N. F. Mott Conduction in Non-Crystalline Material (Clarendon Press, Oxford) p36 (1987).
- [8] C. Castellani, C. Di Castro, M. Grilli, and G. Strinati, Phys. Rev. B 37 6663 (1988).
- [9] J. E. Enderby and A. C. Barnes, Phys. Rev. B 49, 5062 (1994).
- [10] C. Villagonzalo, R. A. Röhmer, and M. Schreiber, cond-mat/9904362.
- [11] R. Fletcher, V. M. Pudalov, and Y. Feng, Phys. Rev. B 56, 12422 (1997).
- [12] V. M. Pudalov, G. Brunthaler, A. Prinz, and G.Bauer, JETP Lett. 68, 442 (1998): JETP Lett. 68, 534 (1998).
- [13] V. M. Pudalov, G. Brunthaler, A. Prinz, and G.Bauer, JETP Lett. 70, 48 (1999).
- [14] W. Mason, S. V. Kravchenko, and J. E. Furneaux, Surf. Science 361/2, 953 (1996).
- [15] B. L. Altshuler, D. L. Maslov, and V. M. Pudalov, to be published.
- [16] Y. Hanein, D. Shar, J. Yoon, C. C. Li, and D. C. Tsui, Phys. Rev. B 58, R7520 (1998).
- [17] X. G. Feng, D. Popović, S. Washburn, and V. Dobrosavljević, cond-mat/9903236.
- [18] J. W. P. Hsu, A. Kapitulnik, and M. Yu. Reizer, Phys. Rev. B 40, 7513 (1989): M. Fabrizio, C. Castellani, and G. Strinati, Phys. Rev. B 43, 11088 (1991): K. D. Belashchenko, D. Livanov, and A. V. Sergeev, JETP 84, 951 (1997).
- [19] M. J. Burns and P. M. Chaikin, J. Phys. C: Solid State Phys. 18, L743 (1985).
- [20] I. P. Zvyagin in Hopping Transport in Solids edited by M. Pollak and B. Shklovskii, (North-Holland, Amsterdam) p.143 (1991).
- [21] M. J. Burns, W. C. McGinnis, R. W. Simon, G. Deutscher, and P. M. Chaikin, Phys. Rev. Lett. 47, 1620 (1981); M. J. Burns and P. M. Chaikin, Phys. Rev. B 27, 5924 (1983).
- [22] C. Lauinger and F. Baumann, J. Phys.:Condens. Matter 7, 1305 (1995).
- [23] X. Liu, A. Sidorenko, A. Wagner, P. Ziegler, and H. v. Löhneysen, Phys. Rev. Lett. 77, 3395 (1996).
- [24] G. Sherwood, M. A. Howson, and G. J. Morgan, J. Phys.:Condens. Matter 3, 9395 (1991).
- [25] R. Fletcher, V. M. Pudalov, M. Tsaousidou, and P. N. Butcher, Proc. 13th Int. Conf. on the Electronic Properties of Two-Dimensional Systems, Ottawa, 1999 (to be published in Physica (E)).
- [26] M. Pollack and L. Friedman in Localization and Metal-Insulator Transitions edited by H. Fritzsche and D. Adler, (Plenum, N. Y.) p347 (1985).