The effect of strain on the adsorption of CO on Pd(100)
Abstract
We study how the binding energy, the vibrational frequencies and the adsorption isotherm of CO on Pd(100) are modified when the solid is subject to uniform strain. The parameters controlling the thermodynamics of adsorption (the adsorption energy, the vibrational frequencies of the adsorbed molecules and the interaction energy between the molecules) have been calculated by using density functional theory. These parameters are then used in a grand canonical Monte Carlo simulation that determines the CO coverage when the surface is in thermodynamic equilibrium with a CO gas, at a specified pressure and temperature. We find that this is substantially affected by the strain. Our results, along with those obtained by others, suggest that the development of “elastochemistry”, a study of the change in the chemical properties of a surface when subjected to strain, will lead to interesting and measurable results. It also suggests that differences in chemical activity between clusters on a support and clusters in gas phase may be partly due to the strain induced when a cluster is placed on the support.
pacs:
PACS: 68.10.Et, 68.10.Jy, 81.40.Jj, 82.65.MyI Introduction
A number of recent experiments and calculations have shown that chemisorption causes surface strain and that straining a surface modifies the properties of adsorbed molecules. Webb, Lagally and their students [2, 3] demonstrated that the structure of a silicon surface can be changed by bending it. They worked with a (100) face of a thin silicon slab. This surface has steps separated by two kinds of terraces: on one, the dimer rows are parallel to the steps; on the other, they are perpendicular to the steps. These terraces give different low electron diffraction (LEED) patterns. When the slab is bent, the relative LEED intensities change, because the size of these terraces is modified by strain. Ibach and his coworkers[4, 5, 6, 7] have demonstrated a “reciprocal” phenomenon: chemisorption on the surface of a very thin slab will cause it to bend. If adsorption causes strain, then it should be possible to affect adsorption by straining the surface. Mentzel’s group[8] implanted noble gas ions under a metal surface, causing local strain. They then showed that the strained surface has different adsorption properties. Other groups[9, 10, 11, 12, 13, 14] have strained a surface by growing a very thin metal film on a substrate of a different metal. If the two lattices are mismatched, but the growth is in registry, the atoms in the film are either stretched or compressed. This affects the chemisorption properties of the film. In this kind of experiment the chemisorption properties are modified by the strain and also by electronic effects caused by binding to a substrate made of a different metal. The two effects cannot be separated experimentally.
Density functional calculations have been used to explore the effect of surface strain on the properties of the adsorbates. Ratsch, Seisonen and Scheffler[15] have shown that the activation energy for diffusion of a Ag atom on a Ag surface is affected by strain. Mattsson and Metiu[16] have used this effect to show that periodic strain on a surface[17] can order nanostructures nucleated on it and increase their size uniformity. Finally, Mavrikakis, Hammer and Nørskov[18] calculated the change in the binding energy of O and CO and in the dissociation energy of CO when the Ru(0001) surface on which they are adsorbed is under strain.
Ibach[19] has published a thorough review of the effects of strain in epitaxy and surface reconstruction. Norskov[20] discusses the effect of strain in an excellent review of density functional studies of chemisorption systems relevant to catalysis.
It is not surprising that straining a surface affects the chemistry taking place on it. Strain changes the distance between the surface atoms and this must change the properties of the adsorbates. The only question is whether this change can be, at least in some cases, sufficiently large to matter. If this is so, one can envision the development of “elastochemistry” as a new subfield of physical chemistry.
In this paper we study how the binding energy, the vibrational frequencies and the adsorption isotherm of CO on Pd(100) change with surface strain and coverage. We use generalized gradient, density functional theory for energy calculations and Monte-Carlo simulations and an analytical model for calculating the adsorption isotherm. The change in these quantities, caused by straining the surface, is sufficiently large to be measurable. In the case of the adsorption isotherm the coverage at a given gas pressure changes by almost two orders of magnitude. This happens because relatively small changes in adsorption energy have large effects on the isotherm.
To model the adsorption isotherm we need to know how the properties of the adsorbed molecules change with coverage. Ideally, we should calculate how these properties change when we change the clustering of CO on the surface. One would need then the energy of all possible clusters. This is beyond the current capability of the density functional method, which uses a periodic system with a unit cell of limited size. For this reason we have adopted the following strategy. We calculate the properties of adsorbed CO for 1/8, 1/2 and 1 monolayer. The one-monolayer calculation is used to determine the adsorption energy of a molecule that does not interact with its neighbors. The half-monolayer results provide the interaction energy between the next-nearest-neighbors. The full monolayer one is used to extract the interaction energy between nearest-neighbors. A Hamiltonian based on these energies is then used in a grand-canonical Monte Carlo simulation to determine the adsorption isotherm. We have also tested the quasi-chemical approximation[27] and found it to be inaccurate.
II Methodology
The density functional calculations reported here were performed with the Vienna program VASP.[21, 22] This uses periodic boundary conditions, a plane-wave basis set and fully nonlocal Vanderbilt-type [23] ultra soft psudopotentials. The generalized gradient exchange-correlation energy is that of Wang and Perdew[24].
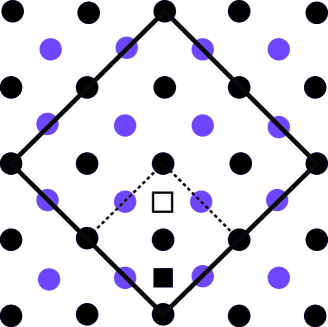
The metal is represented by a four-layer slab bounded by an empty region whose thickness equals that of six Pd layers. When the coverage is high ( and 1/2), we use the small supercell shown by the dashed lines in Fig. 1; the thick lines show the supercell for the lowest coverage ().
The CO molecules are placed on the top layer of the slab. The positions of the atoms in the bottom layer was fixed to coincide with those of the bulk Pd, calculated with the same program. The distance between the bottom layer and the layer next to it is also fixed to the bulk value. The calculated equilibrium lattice constant of bulk Pd is Å. The atoms in the other layers are allowed to relax and take the values that give a minimum total energy.
Brillouin-zone integrations have been performed on a grid of points for the high-coverage case and on a grid of points for the low-coverage case. The Methfessel-Paxton smearing is eV. For high coverage we have tested convergence by performing calculations with thicker slab and a denser mesh. For low coverage, a -point mesh is the densest we can afford on a workstation with 1GB memory. The cut-off energy is 495 eV, which is a high value.
III The properties of adsorbed CO, as a function of coverage and strain
A Bulk Pd
To determine the lattice constant of bulk Pd we used the supercells described in Fig. 1 and a slab having ten Pd layers. It is not necessary to use such a thick slab, but we had the results from calculations for another project. If the sample is unstrained, we allow the atoms to relax in all directions and obtain a lattice constant of 3.961 Å. This corresponds to a distance of 1.9805 Å between the (100) layers. We have also calculated the bulk structure of two samples, subject to an uniform strain of in a plane (the xy plane) perpendicular to the (100) direction. In these calculations the and coordinates of the atoms are fixed, but the space between the layers is allowed to relax. In the sample with strain the distance (in the z direction) between the layers is 1.9250 Å; if the strain is %, this distance is 2.0457 Å. Increasing the distance between atoms in the plane decreases the distance between the layers in the direction.
B Strain and coverage dependence of adsorption energy
All calculations involving adsorbed molecules are performed on a slab having Pd layers, surrounded by a vacuum whose dimension in the z-direction is equal to that occupied by Pd layers. The distance between the lowest two layers is fixed at the bulk value mentioned above (this distance depends on the state of strain of the surface). The top two layers are allowed to relax. We calculate the energy of the slabs constrained in this way for 0 and % strain.
The properties of the chemisorbed CO molecules are calculated by placing 1 ML, 1/2 ML and 1/8 ML CO on top of the Pd slab. Since these calculations are extremely time consuming, we have investigated only the bridge binding sites, which have the lowest binding energy when the surface is not under strain.[25] It is possible that other sites are occupied with a finite probability, when the system is in thermal equilibrium. Also, the CO molecules may prefer a different binding site, when the surface is under strain. These possibilities have not been considered in our calculations. We also ignore the fact that at high coverage the CO molecules might change their binding site.
The energy of the CO covered slab is denoted by , and depends on CO coverage and on surface strain. The adsorption energy is then given by:
meV is the total energy of a free CO molecule, is the number of CO molecules in a supercell and is the energy of the Pd slab, without CO on it. For the supercells used in our calculations, for 1 ML of CO and for 1/2 ML or 1/8 ML (see Fig. 1). The adsorption energies calculated with this equation, for different CO coverages and strains, are given in Table I. For 1/2 ML and no strain, the adsorption energy of eV is consistent with that reported in Ref. [25], which is eV.
The adsorption energy defined above includes the lateral interactions between the molecules. Such a definition is often used when the dependence of desorption rate on coverage is modelled. As we shall see later, this definition does not work well; we prefer the one given when we define Model II (see Section D).
C The dependence of the vibrational frequencies of CO on coverage and strain
The dependence of the vibrational frequencies of chemisorbed CO on strain is of interest for two reasons. They are measurable and therefore the predictions made here can be tested by experiment. Furthermore, the change of these frequencies with strain will affect the chemical potential of the chemisorbed molecules and therefore will influence the adsorption isotherm. A thorough study of these effects would have to perform a complete phonon analysis of the system. Such calculations are possible, in principle, but they require too much computer power, especially for the case of low coverage, to be attempted here. Since the adsorption isotherm is dominated by the chemisorption energy and by the lateral interactions, small errors in evaluating the vibrational energies are not likely to affect our conclusions.
| STRAIN | 1/8 ML | 1/2 ML | 1ML |
|---|---|---|---|
| % | |||
| 0 % | |||
| 2 % |
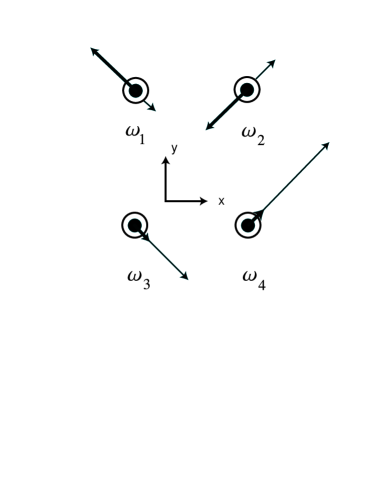
Because of these considerations, we calculate the vibrational frequencies by giving small displacements to the O and C atoms, away from their equilibrium positions, while keeping the metal atoms fixed. The displacements along the and directions are Å and Å, and those along the direction are Å and Å. We calculate the forces exerted on the C and O atoms, for all combinations of shifted coordinates, and fit it to a linear form in the displacements. This allows us to calculate the force constants and then the vibrational frequencies. The results are given in Table II, for different coverages and strains. In Fig. we show the amplitudes of four vibrations in the plane, as seen by looking down towards the surface. The highest frequency, , is the CO stretch. In the absence of strain, at a coverage of 1/2 ML, our result (1878 cm-1) is close to that calculated by Eichler and Hafner[25] (1887 cm-1). They also report a frequency of 417 cm-1 for the carbon-metal stretch; our calculations give 341 cm-1. This discrepancy is not sufficiently large to affect the chemisorption isotherm. We suspect that this is due to the fact that we use more k points in our calculation.
The frequency is easiest to measure. Our calculations predict that either a compressive or a tensile strain, which changes the lattice constant by two percent, will increase by an amount measurable by infrared spectroscopy. The largest change, of 29 cm-1, is at the lowest coverage (1/8 ML).
| Coverage | STRAIN | ||||||
|---|---|---|---|---|---|---|---|
| 1/8 ML | % | 397.42 | 334.23 | 169.51 | 49.94 | 338.13 | 1849.71 |
| 1/8 ML | 0 % | 416.01 | 346.05 | 180.26 | 55.86 | 334.00 | 1820.05 |
| 1/8 ML | 2 % | 422.36 | 327.99 | 182.70 | 72.12 | 319.95 | 1849.80 |
| 1/2 ML | % | 407.33 | 339.38 | 178.37 | 64.27 | 395.00 | 1890.61 |
| 1/2 ML | 0 % | 406.60 | 330.06 | 170.89 | 14.45 | 340.63 | 1878.08 |
| 1/8 ML | 2 % | 414.24 | 323.98 | 182.64 | 71.50 | 343.95 | 1883.84 |
| 1 ML | % | 417.83 | 379.86 | 180.94 | 56.17 | 367.33 | 1995.30 |
| 1 ML | 0 % | 416.85 | 374.93 | 193.24 | 77.14 | 362.00 | 1982.70 |
| 1 ML | 2 % | 393.38 | 356.56 | 187.32 | 77.00 | 341.90 | 1986.67 |
D The interaction between the adsorbed CO molecules
To calculate the adsorption isotherm we need to know the energy of the interaction between molecules. A very precise treatment of this problem would have to determine the energy of dimers, trimers,…. This would require an enormous amount of computer power and would be an overkill at this stage in our research. For this reason we have studied two approximate models.
In Model I we assume that the effect of the interaction between the adsorbates is to make the adsorption energy depend on coverage. This is obviously a mean field model; in reality the desorption energy is different, for different local configurations. For each strain, the adsorption energy at the three coverages used here is given in Table I. For other coverages we interpolate between these values.
In Model II we partition the total energy into an adsorption energy and the energy of interaction between the adsorbed molecules. First we assume that at a coverage of 1/8 ML there are no interactions between the CO molecules. Therefore,
gives the adsorption energy of a CO molecule. Here is the total energy of the slab with 1/8 ML CO on it, is the total energy of the slab without CO, is the energy of the gaseous CO and is the number of CO molecules in the supercell when the CO coverage is 1/8 ML.
Next, we assume that the adsorption energy of one molecule is independent of coverage. This means that we attribute the change in adsorption energy at higher coverages to the interaction between molecules. When the coverage is 1/2 ML we assume that the total energy is the slab energy, plus the adsorption energy of the molecules in the supercell, plus the interaction between all the next-nearest-neighbors (nnn) in the supercell. Thus, we can calculate the interaction between the nnn-pairs from the equation
Here is the number of adsorbed CO molecules in the unit cell. The total energy of a CO monolayer can then be used to calculate the interaction energy between the nearest neighbors (nn). We assume that the total energy of the CO-covered surface is the energy of the slab, plus the adsorption energy of the CO molecules, plus the interaction energy of all the nn and nnn pairs in the supercell. As a consequence, the interaction energy between the nearest neighbors is given by
The values of and calculated from these equations, for the strained and the unstrained surfaces, are given in Table III.
| Strain | ||
|---|---|---|
| % | ||
| % | ||
| % |
We have now all the elements needed for writing an effective Hamiltonian to be used in the statistical mechanical theory of the adsorption isotherm: the vibrational frequencies of the molecule, the adsorption energy, the energy of interaction between nearest neighbors and that between next-nearest neighbors.
IV The calculation of the adsorption isotherm
We are now ready to calculate the coverage of the adsorbed layer in equilibrium with a gas of CO molecules. This calculation is performed in two ways. The first method uses the equilibrium condition: the chemical potential of a CO molecule in gas is equal to the chemical potential of an adsorbed CO molecule. To calculate the latter we use the quasichemical approximation[27]. The second method, uses Grand Canonical Monte Carlo simulations with the chemical potential of the gas calculated from the equations provided by Statistical Mechanics for ideal gases.
A The quasichemical approximation
The quasichemical approximation gives for the chemical potential of CO on Pd
| (2) | |||||
where is the coverage of CO (number of molecules divided by the number of lattice sites).[27] The symbol stands for
with
Since the pressure is low, we can use the ideal gas expression for the chemical potential[27] of the gas:
| (3) |
with
| (4) |
In these equations, is the pressure, is the mass of CO-molecule, is the moment of inertia of CO and is the vibration frequency of free CO, 2114 cm-1.
In equilibrium calculations we must ensure that the two chemical potentials use the same reference energy. For us, this is the electronic energy of the slab plus the electronic energy of a CO molecule in gas phase. The zero point vibrational energy of the molecule in the gas and on the surface is included in the chemical potential.
By making the chemical potential for the adsorbed CO, [Eq. (2)], equal to the chemical potential of the gas [Eq. (3)], we obtain a relationship between surface coverage and gas pressure (the adsorption isotherm). Since we know the dependence of the parameters on strain, we can calculate the adsorption isotherm for a strain of %, at K.


We first consider Model I, which assumes that and includes the effect of the interactions between the molecules in the adsorption energy . The magnitude of is given in Table I, for different coverages and strains. The values at other coverages are obtained by interpolation. For the vibrational frequencies we use the mean of the values given in Table II.
The adsorption isotherm for Model I is calculated by setting given by Eq. (3) equal to given by Eq. (2), with and replaced with . This gives us an equation connecting the gas pressure to the coverage (the adsorption isotherm). The dependence of coverage on the gas pressure obtained with this method is plotted in Fig. 3(a), for 0 and % strains, at K.
In the next calculation we use Model II, which assumes that the adsorption energy is independent of coverage, that the nearest-neighbors interact with the energy , and that . The isotherm is obtained by making . The resulting adsorption isotherm is plotted in Fig. 3(b).
It is clear that in both models the strain has a very large effect on chemisorption. For example, the Fig. 3(b) shows that at Torr the CO coverage on the unstrained surface is ML. Stretching the metal to increase the lattice constant by % changes the coverage to ML. Another way to look at this is to note that a coverage of 0.7 is achieved at roughly Torr if the lattice constant is increased by %, at Torr if the surface is not strained, and at Torr if the lattice constant is decreased by %. These effects are large enough to be easily detected experimentally, if one could find a convenient way to strain the surface in ultra-high vacuum.
B Monte Carlo simulation
We use grand-canonical Monte Carlo (MC) calculations to determine the coverage of CO on the Pd(100) surface, at given gas pressure and temperature. The methodology is presented well in an excellent book by Frenkel and Smit[26] so there is no need to discuss it here. The Hamiltonian consists of the adsorption energy multiplied by the number of adsorbed molecules, plus the pairwise interaction energy multiplied by the number distinct nearest-neigbor pairs, plus the energy multiplied by the number of distinct next-nearest-neighbor pairs, plus the adsorption energy, plus the vibrational energies of the adsorbate. The chemical potential of the gas is calculated from Eq. (3). We use lattice sites.
The results of the simulations are plotted in Fig. 4 for K. As in the calculations performed in the previous section, we find that strain substantially affects the surface coverage. For example, at a pressure of Torr and a temperature of 300 K, the coverage is for strain, in the absence of strain, and for strain. The effect is much stronger if the quasi-chemical approximation is used (see Fig. 3 (b)), but we attribute this to inaccuracies in Model II. The discrepancy between this model and the Monte Carlo simulation is so great that we have to discount Model II as insufficiently accurate. We suspect that this is due to the neglect of the repulsive, next-nearest-neighbor interactions, which makes the coverage given by Model II larger than in reality (here the Monte Carlo simulation is the “reality”). Model I is so far off from both the quasichemical approximation and the Monte Carlo simulation that it should be completely discarded. This is a pity since, had it been correct, this model would have allowed a very simple interpretation of the experiments.

V Summary
We have studied how uniform strain in the plane parallel to the (100) surface of palladium affects the properties of chemisorbed CO. The effect on the vibrational frequencies is small: it is comparable to or less than that observed for the molecule located in different binding sites. The shift in the stretch frequency of CO is sufficiently large to be detected by infrared spectroscopy. The effect on the binding energy at low coverage is larger. We found the weakest binding when the surface is compressed (i.e. for % strain). Releasing the compressive strain raises the binding energy by 0.025 eV. Going to a tensile strain of increases the binding energy by another 0.027 eV. From the equilibrium condition ( given by Eq.(3) is equal to given by Eq.(2) ) we see that the logarithm of the equilibrium pressure is proportional to the adsorption energy. This means that small changes in the adsorption energy lead to large changes in the equilibrium pressure. While the quasi-chemical approximation is not quantitatively accurate, this particular prediction is reliable. It is indeed confirmed by the Monte Carlo simulations.
It is interesting to speculate on the broader consequences of these findings. Ibach’s experiments[4, 5, 6, 7] showed that chemisorption induces surface strain, which results in the bending of the thin slab on which the adsorption was performed. This means that in all equilibrium studies we ought to take strain as an additional thermodynamic variable[28] and stress as its conjugate variable. It follows that all equilibria will depend on the strain state of the surface. Moreover, the outcome of transformations performed at constant strain will be different from that of transformations taking place at constant stress, just as transformations at constant volume differ from those at constant pressure. This will affect the adsorption isotherm and chemical equilibrium at the surface. Since strain affects equilibrium, detailed balance tells us that it must also affect kinetics. The only question is whether the modifications caused by strain are large enough to make it necessary to include them in a thermodynamic analysis of surface phenomena. The present work suggests that they are, and therefore they deserve further study.
Besides using simple mechanical means, one could induce strain by passing sound through the solid. In particular, the excitation of the Rayleigh mode would seem most effective, since it affects the surface more than other modes. Based on our calculations one would expect desorption to occur from the regions compressed by the sound wave. Moreover, chemical equilibrium on the surface is likely to be affected. Indeed, Krishner and Lichtman[29] have shown that passing sound through a surface causes desorption of the molecules adsorbed on it. Inoue et al. [30, 31, 32, 33] have demonstrated that sound affects the yield of catalytic reactions. Prompted by these experiments King et al.[35, 36] have performed careful ultra-high vacuum experiments in which the interplay between sound and chemisorbed molecules can be studied in a clean and controlled environment. They found that exposing a Pt surface to sound can change the rate of CO oxidation. By using photo-electron microscopy, Kelling, Cerasari, Rotermundt, Ertl and King [37] have shown that the reaction is affected mostly by controlling CO adsorption at given CO pressure.
In most “sonochemistry”, sound acts by heating and compressing the system[38]. This is not the case in the surface science experiments mentioned above, which have ruled out heating effects[35, 36, 37]. The effect of sound on chemical reaction is very hard to explain by conventional arguments: sound frequency is very low and excites phonons of long wavelength with very low energy. It is unlikely that these can affect the rate of chemical processes. For this reason we speculate that perhaps it is the strain induced by the sound wave that plays a role in the process. The fact that the presence of sound does not affect the activation energy of the oxidation reaction but influences the CO coverage supports t his view.
We expect that strain effects also play a role in supported catalysts, especially those using small clusters. When such a cluster is deposited on a support it suffers two modifications: a charge rearrangement and a distortion of its geometry (strain). It is therefore possible that a part of the change in the catalytic activity cause by depositing clusters on a inert support comes from the strain.
Acknowledgements.
We thank Nick Blake, Ross Larsen and Professor Jurgen Hafner for help with the computations. We are grateful to Jens Norskov for many useful discussions in the early stages of this work. This work has been supported by AFOSR F49620-98-1-0366, by NSF (through CDA96-01954), and by Silicon Graphics Inc.REFERENCES
- [1] Author to whom correspondence should be addressed. Email: metiu@chem.ucsb.edu.
- [2] W. E. Packard and M. B. Webb, Phys. Rev. Lett. 61, 2469 (1988)
- [3] M. B. Webb, F. K. Men, B. S. Swartzentruber, R. Kariotis and M. G. Lagally, in Kinetics of Ordering and Growth at Surfaces, ed. M. G.Lagally,(Plenum, New York, 1989)
- [4] D. Sander and H. Ibach, Phys. Rev B 43, 4263 (1991)
- [5] A. Grossmann, W. Erley and H. Ibach, Surface. Sci. 313, 209 (1994)
- [6] H. Ibach, J. Vac. Sci. Technol. A 12, 2440 (1994)
- [7] A. Grossmann, W. Earley, J. B. Hannon and H. Ibach, Phys. Rev. Lett. 77, 127 (1996)
- [8] M. Gsell, P. Jakob and D. Menzel, Science 280, 451 (1998)
- [9] J. A. Rodriguez and D. W. Goodman, Science 257, 897 (1992)
- [10] T. E. Madey, C.-H. Nien, K. Pelhos, J. J. Kolodziej, I M. Abdelrehim, H. -S. Tao, Surface Sci. 438, 191 (1999)
- [11] F. Buatier de Mongeot, M. Scherer, G. Gleich, E. Kopatzki, and J. Behm, Surface Sci. 411, 249 (1998)
- [12] E. Kampshoff, E. Hahn, K. Kern, Phys. Rev. Lett. 73, 704 (1994)
- [13] J. H. Larsen and I. Chorkendorff, Surface Sci. 405, 62 (1998)
- [14] M. Ø. Pedersen, S. Helveg, A. Ruban, A. Stensgaard, E. Lægsgaard, J. K. Norscov, and F. Bessenbacher, Surface Sci. 426, 395 (1999)
- [15] C. Ratsch, A. P. Seitsonen and M. Scheffler, Phys. Rev. B55, 6750 (1997)
- [16] T. R. Mattsson and H. Metiu, Appl. Phys. Lett. 75, 926 (1999)
- [17] A. E. Romanov, P. M. Petroff and J. S. Speck, Appl. Phys. Lett. 74, 2280 (1999)
- [18] M. Mavrikakis, B. Hammer and J. K. Nørskov, Phys. Rev. Lett. 81, 2819 (1998)
- [19] H. Ibach, Surface Sci. Reports 29, 193 (1997)
- [20] J. Norskov, Advances in Catalysis, 43, xxxx (2000)
- [21] G. Kresse and J. Hafner, Phys. Rev. B 47, 558 (1993); 49, 14251 (1994)
- [22] G. Kresse and J. Furthmüller, Phys. Rev. B 54, 11169 (1996); Comput. Mater. Sci. 6, 15 (1996)
- [23] D. Vanderbilt, Phys. Rev. B 41, 7892 (1990); G. Kresse and J. Hafner, J. Phys.: Condens. Matter 6, 8245 (1996)
- [24] Y. Wang and J.P. Perdew, Phys. Rev. B 44, 13928 (1991)
- [25] A. Eichler and J. Hafner, Phys. Rev. B 57, 10110 (1998)
- [26] D. Frenkel and B. Smit, Understanding Molecular Simulation (Academic Press, San Diego, 1996)
- [27] T. Hill, Statistical Mechanics (Dover Publicatons, New York, 1956), p. 348
- [28] The Scientific Papers of J. Willard Gibbs , vol. 1, Thermodynamics, (Dover Publications, New York, 1961), p. 184
- [29] C. Krishner and D. Lichtman, Phys. Lett. 44A, 99 (1973)
- [30] Y. Inoue, Y. Matsukawa and K. Sato, J. Am. Chem. Soc. 111, 8965 (1989)
- [31] Y. Inoue, Y. Matsukawa and K. Sato, J. Phys. Chem. 96, 2222 (1992)
- [32] Y. Inoue and Y. Watanabe, Catal. Today 16, 487 (1993)
- [33] Y. Inoue, J. Chem. Soc., Faraday Trans. 90, 815 (1994)
- [34] Y. Watanabe, Y. Inoue and K. Sato, Surf. Sci. 358, 769 (1996)
- [35] M. Gruyters, T. Mitrelias and D.A. King, Appl. Phys. A 61, 243 (1995)
- [36] S. Kelling, T. Mitrelias, Y. Matsumoto, V. P. Ostanin and D. A. King, J. Chem. Phys. 107, 5609 (1997)
- [37] S. Kelling, S. Cesari, H. H. Rotermund, G. Ertl and D. A. King, Chem. Phys. Lett. 293, 325 (1998)
- [38] K. S. Suslik, Science 247, 1439 (1990)