Abstract
\AbstractIntroduction
The determination of crystal structures is an important part of chemistry, physics and of course crystallography. Conventional structure determination is based on the analysis of the intensities and positions of Bragg reflections which only allows the determination of the long range average structure of the crystal. For powder diffraction data this is now routinely done using the Rietveld (Rietveld, 1969) method. It should be kept in mind that the analysis of Bragg scattering assumes a perfect long range periodicity of the crystal. However, many materials are quite disordered and even more important the key to a deeper understanding of their properties is the study of deviations from the average structure or the study of the local atomic arrangements (Billinge, 1996). Deviations from the average structure result in the occurance of diffuse scattering which contains information about two-body interactions. It is interesting to remember that the information that can be extracted from diffuse scattering is indeed limited to two-body correlations. In an review article about diffuse scattering, Welberry and Butler (1994) show two chemically disordered structures giving rise to the same diffuse scattering pattern. Two similar structures are shown in Figure 1 and one can easily see the different arrangement of the two atoms types shown as filled and empty circles. However, for both structure all two body correlations are zero, the only difference is a non-zero three-body term for one of the structures, giving rise to the triangular arrangement seen in Figure 1. In principle those two structures can not be distinguished using diffuse scattering or PDF measurements. The corresponding PDFs for the two structures are shown in Figure 1c. However, in many cases three-body correlations might impose constrains on local displacements which then change the diffraction pattern or PDF. A detailed discussion of this topic can be found in Welberry (1986).

There are various ways to extract information about the defect structure from single crystal diffuse scattering. An overview of traditional approaches and the analysis of diffuse scattering via computer simulations can be found in (Welberry and Butler, 1994), further general information about disorder diffuse scattering can be found in numerous review articles (Welberry, 1985; Jagodzinski, 1987; Jagodzinski and Frey, 1993; Frey, 1995, 1997; Welberry and Butler, 1995). However, the data collection, interpretation and analysis of diffuse scattering is a time consuming and in general difficult task. Information about the local environment of atoms in a given structure can be extracted using extended X-ray fine absorption structure (XAFS) analysis and related techniques. A recent review of those methods was given by Yacoby (1999). The method to reveal the local structure of crystals used here is the analysis of the PDF. This approach is long known in the field of studying short range order in liquids and glasses but has recently been applied to crystalline materials (Egami, 1998; Toby and Egami, 1992; Billinge and Egami, 1993). The PDF is obtained from the powder diffraction data via a sine Fourier transform of the normalized total scattering intensity :
| (1) | |||||
where is the microscopic pair density, is the average number density and is the magnitude of the scattering vector. For elastic scattering with being the scattering angle and the wavelength of the radiation used. Since the total scattering contains Bragg and diffuse scattering, the information about local arrangements is preserved. Details about the determination of an experimental PDF can be found e.g. in Egami (1998); Warren (1990) and are not discussed here.
In many systems one is faced with chemical short range order and subsequent displacements of neighboring atoms. In previous work, the capability of the RMC technique to refine single crystal diffuse scattering of systems showing similar disorder was investigated (Proffen and Welberry, 1997a, b). However, obtaining a PDF from a powder diffraction experiment is often simpler than carrying out a single crystal diffuse scattering measurement and allows one to e.g. collect data for many temperature points around a phase transition or explore a family of compounds more systematically. The aim of this paper is to investigate the capability and possible limitations of reverse Monte Carlo (RMC) refinement of PDF data to obtain information about chemical ordering and subsequent displacements.
Simulation techniques
In this section some details about the simulation techniques in general are given. In the first part the calculation of a PDF from a structural model is discussed, the following two parts describe the Monte Carlo (MC) and reverse Monte Carlo (RMC) simulation technique. Although this paper concentrates on the RMC refinements of various simulated structures showing occupational and displacive disorder, these defect structures themselves were created using the MC method.
Calculating the PDF
The PDF can be understood as a bond-length distribution between all pairs of atoms and within the crystal (up to a maximum distance), however each contribution has a weight corresponding to the scattering power of the two atoms involved. The PDF can be calculated from a structural model using the relation
| (2) |
where the sum goes over all pairs of atoms and within the model crystal separated by . The scattering power of atom is and is the average scattering power of the sample. In the case of neutron scattering is simply the scattering length, in the case of x-rays it is the atomic form factor evaluated at a user defined value of . The default value is in which case is simply the number of electrons of atom .
Generally there are two different ways to account for displacements (either thermal or static) from the average position. First one can use a large enough model containing the desired displacements and perform an ensemble average. This can be achieved e.g. by displacing atoms in the model according to a given Debye-Waller factor. Alternatively one can convolute each delta-function in (2) with a Gaussian accounting for the displacements. The width of the Gaussian is given by the anisotropic thermal factors of atoms and .
The study of a measured PDF ranges from a simple peak width analysis revealing information about correlated motion (Jeong et al., 1999) to the full profile refinement of the PDF based on a structural model either using the Reverse Monte Carlo technique (Toby and Egami, 1992; Nield et al., 1994) or least square regression (Billinge, 1998). The later can be carried out using the program PDFFIT (Proffen and Billinge, 1999). The reader might refer to this paper for details on the calculation of PDFs and experimental factors like terminating the data at a given value of determined by the experiments. We will exclude the discussion of experimental influences on the PDF from this paper, since its scope is a principle investigation of the capability of RMC refinements of the PDF to obtain information about chemical ordering and possibly accompanying displacements. All simulations and refinements presented in this paper were carried out using the program DISCUS (Proffen and Neder, 1997).
Monte Carlo (MC)
The total energy of a model crystal is expressed as a function of random variables such as site occupancies or displacements from the average structure. The algorithm is based on the original Metropolis Monte Carlo technique (Metropolis et al., 1953). A site within the crystal is chosen at random and the associated variables are altered by some random amount. The energy difference of the configuration before and after the change is computed. The new configuration is accepted if the transition probability given by equation 3 is greater than a random number h, chosen uniformly in the range [0,1].
| (3) |
In 3 is the temperature and Boltzmann’s constant. It should be noted that the value of the temperature controls the proportion of accepted modifications which lead to a larger total energy. The process is repeated until the system reaches its equilibrium. In this paper we refer to a single MC (or RMC) step as ’move’, whereas the number of moves necessary to visit every crystal site once on average will be called one ’cycle’.
Next we briefly describe the actual energy expressions used to introduce occupational and displacement disorder using the MC algorithm. All simulations start from a given undistorted average crystal structure. Chemical ordering is described using binary random variables , with to represent a Cu atom and for a Au atom. The energy of interaction between sites used in the MC vacancy ordering scheme is of the form of
| (4) |
where is the sum of all four nearest-neighbor variables, the sum of all four next-nearest-neighbor variables and so on. The sum in equation 4 is over all crystal sites and . The interaction parameters , and are initially unknown and a feedback mechanism is used to achieve the desired ordering of the vacancies(see Welberry and Butler, 1994). The displacements were modeled in a similar way using a Hamiltonian, where the atoms move in harmonic potentials (Hooke’s law).
| (5) |
The sum is over all atoms and all nearest-neighbor atoms . Only nearest-neighbor terms are used in this modeling. The atom-atom distance is given by , the average distance is , is the displacement factor and a force constant.
Reverse Monte Carlo (RMC)
The RMC method was originally developed by McGreevy and Pusztai (1988). The principle is the same MC type algorithm described in the last section. However, rather than minimizing the total energy, the difference between observed and calculated data (in our case PDFs) is minimized. The algorithm works as follows: First, the PDF is calculated from the chosen crystal starting configuration and a goodness-of-fit parameter is computed.
| (6) |
The sum is over all measured data points , stands for the experimental and for the calculated PDF. The RMC simulation proceeds with the selection of a random site within the crystal. The system variables associated with this site, such as occupancy or displacement, are changed by a random amount, and then the model PDF and the goodness-of-fit parameter are recalculated. The change of the goodness-of-fit before and after the generated move is computed. Every move which improves the fit () is accepted. ’Bad’ moves worsening the agreement between the observed and calculated PDF are accepted with a probability of . As the value of is proportional to , the value of has an influence on the amount of ’bad’ moves which will be accepted. Obviously there are two extremes: For very large values of , the experimental data are ignored () and with very small values of the fit ends up in the local minimum closest to the starting point, because there is a negligible probability for ’bad’ moves. The parameter acts like the temperature in ’normal’ MC simulations. The RMC process is repeated until converges to its minimum. The result of a successful RMC refinement is one real space structure which is consistent with the observed PDF. In order to exclude chemically implausible resulting structures additional constrains, e.g. minimal allowed distances between atoms, may be introduced.
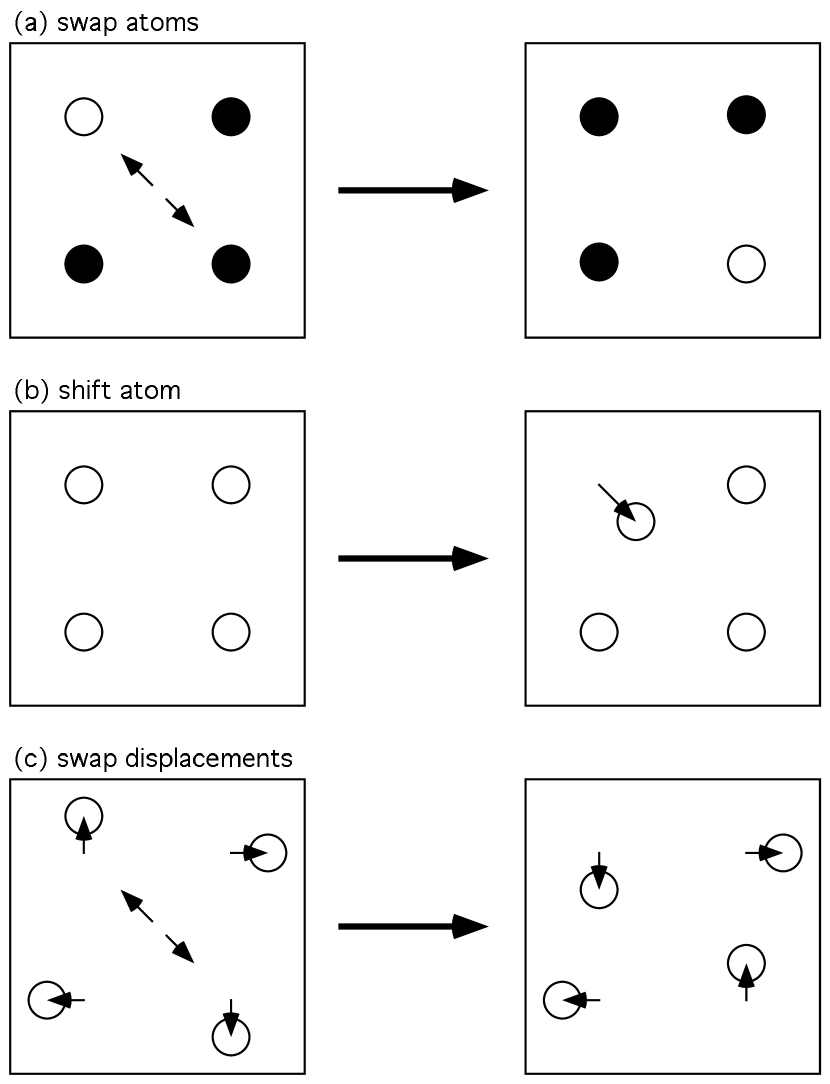
The program used for the RMC refinements presented in this paper is DISCUS (Proffen and Neder, 1997). The program is capable of modeling occupational as well as displacement disorder and so far we have called each crystal modification simply RMC move. In practice we use a mode (’switch-atoms’) of simulation in which occupational disorder is modeled by swapping two different randomly selected atoms (Fig. 2a). This procedure forces the relative abundances of the different atoms within the crystal to be constant. It should be noted, that vacancies are treated as an additional atom type within the program DISCUS. The introduction of displacement disorder can be realized in two different ways. In the first method a randomly selected atom is displaced by a random Gaussian distributed amount (’shift’, Fig. 2b). Alternatively the displacement variables associated with two different randomly selected atoms are interchanged (’switch-displacements’, Fig. 2c). The latter method has the advantage that the overall mean-square displacement averages for each atom site can be introduced into the starting model and these will remain constant throughout the simulation.
Occupational disorder: Cu3Au
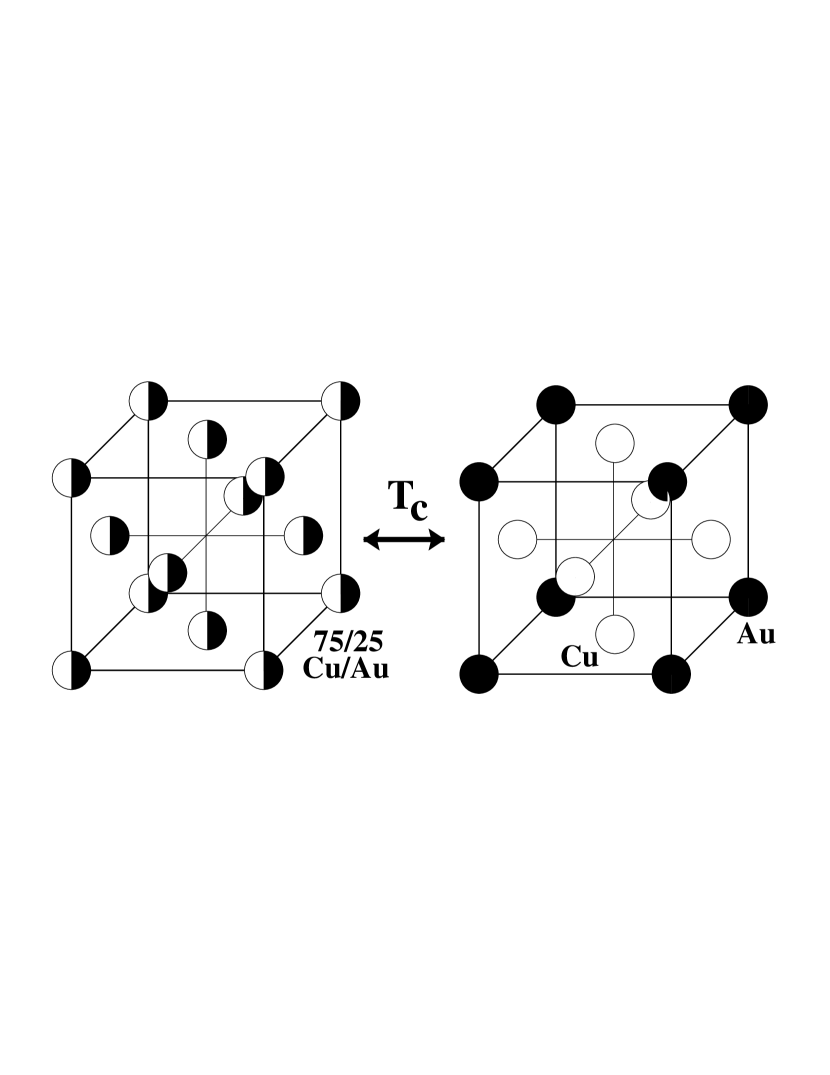
In this section we will extract chemical ordering information from a simulated PDF, which we will refer to as ’data’. This allows one to test the capability of the PDF method to extract such information for crystalline samples. The basis for these simulations is the system Cu3Au. The chemical ordering in these systems has been studies for quite some time and features as text book example for chemical ordering e.g. in the highly recommended book by Cowley (1995). The structure of Cu3Au is cubic, space group with a lattice parameter of Å at room temperature. The system undergoes a order-disorder phase transition at Tc=394C∘, schematically shown in Figure 3. Above Tc the two atom types are randomly distributed, below Tc copper atoms occupy the corners of the unit cell and gold occupies the face centers.
Simulations
Chemical ordering ordering is most conveniently described using the correlation coefficient which is defined as:
| (7) |
is the joint probability that both sites and are occupied by the same atom type and is its overall occupancy. Negative values of correspond to situations where the two sites and tend to be occupied by different atom types while positive values indicate that sites and tend to be occupied by the same atom type. A correlation value of zero describes a random distribution. The maximum negative value of for a given concentration is (), the maximum positive value is +1 ().

| ordered | T=396C∘ | T=420C∘ | T=685C∘ | ||||||||
|---|---|---|---|---|---|---|---|---|---|---|---|
| Neighbor | Model | RMC | Input | MC | RMC | Input | MC | RMC | Input | MC | RMC |
| 0 | -0.33 | -0.30 | -0.18 | -0.17 | -0.17 | -0.13 | -0.13 | -0.13 | -0.13 | -0.13 | -0.13 |
| 100 | 1.00 | 0.91 | 0.21 | 0.23 | 0.23 | 0.15 | 0.16 | 0.16 | 0.11 | 0.12 | 0.12 |
| 1 | -0.33 | -0.30 | 0.01 | 0.01 | 0.01 | 0.02 | 0.02 | 0.02 | 0.03 | 0.04 | 0.04 |
| 110 | 1.00 | 0.90 | 0.06 | 0.07 | 0.07 | 0.05 | 0.06 | 0.06 | 0.02 | 0.01 | 0.00 |
| 0 | -0.33 | -0.29 | -0.08 | -0.08 | -0.08 | -0.08 | -0.07 | -0.07 | -0.07 | -0.07 | -0.07 |
| 111 | 1.00 | 0.90 | 0.02 | 0.03 | 0.02 | 0.01 | 0.03 | 0.03 | -0.01 | -0.03 | -0.04 |
| 1 | -0.33 | -0.30 | -0.01 | -0.01 | -0.01 | -0.01 | -0.02 | -0.02 | 0.00 | 0.01 | 0.01 |
| 200 | 1.00 | 0.89 | 0.07 | 0.08 | 0.08 | 0.07 | 0.06 | 0.07 | 0.03 | 0.04 | 0.05 |
| 0 | -0.33 | -0.29 | -0.03 | -0.01 | -0.01 | -0.02 | 0.00 | 0.00 | 0.00 | -0.01 | -0.01 |
| 2 | -0.33 | -0.29 | 0.03 | -0.01 | -0.01 | 0.02 | 0.00 | 0.00 | 0.01 | -0.01 | -0.01 |
| 210 | 1.00 | 0.89 | 0.03 | 0.05 | 0.04 | 0.02 | 0.03 | 0.03 | 0.00 | 0.00 | 0.00 |
Using MC simulations as described earlier, a total of five disordered structure were created corresponding to temperatures of: below Tc (ordered), T=396C∘, 420C∘, 685C∘ and random distribution of Cu and Au. The simulated crystal structures extended over 10x10x10 unit cells, containing a total of 4000 atoms. The concentration of gold is as expected . The target correlation values were taken from Chen et al. (1970) and all eleven neighbor values were used in the simulation. The MC simulations were carried out for 200 cycles, i.e. every atom was visited on average 200 times. The target values and achieved values after the MC simulations are shown in Table 1 in columns ’input’ and ’MC’, respectively. Note that the ordered structure of Cu3Au was created directly from the structural information. The PDFs calculated from these structures are shown in Figure 4. The calculation was done for x-ray scattering. In order to observe the change in the PDF more clearly, PDFs of two subsequent temperatures and the resulting difference are plotted as separate panels in Figure 4. At high temperature the Cu and Au atoms are randomly distributed, which corresponds to correlation values for all neighbors. At T=685C∘ we are still well above the phase transition at Tc=394C∘ and inspection of Table 1 shows a significant negative correlation for the nearest neighbor and a positive correlation for the next-nearest neighbor. At this temperature the system starts having preferred Cu-Au nearest neighbors, however the ordering does not yet extend to larger neighbor distances. The top panel in Figure 4 shows the PDFs for the random arrangement and the situation at C∘. The main differences that can be observed for the first few neighbors showing correlations significantly different from zero. As the temperature is lowered towards the phase transition, the differences of the PDFs between temperature points become smaller, however, as correlations of more distant neighbors deviate from zero, changes in the PDF at higher values of can be seen. Note that the difference curves of the top three panels in Figure 4 are enlarged by a factor of 15. The bottom panel of Figure 4 show the difference between the PDF just above the phase transition and the ordered low temperature state. Here differences are clearly visible and this time the difference curve is not enlarged. It can be clearly observed that the main change of the PDF is not at higher values of , since in the ordered state, non-zero correlations extend over the complete crystal.
The aim of these simulation was to explore the capability of RMC simulations of these calculated PDFs to recover the correct chemical correlation values at least for this idealized situation not considering experimental factors. The RMC simulation method was described previously. The parameter given in equation 6 was decreased linearly during the RMC refinement. This had the effect that initially the ratio of accepted ’good’ to ’bad’ moves was about 2:1 which then decreased until no ’bad’ moves were accepted in the last cycles. The refinements were carried out in ’swchem’ mode which kept the relative abundance of Cu and Au constant at its initial values. The refinement was stopped after 15 RMC cycles when practically no RMC moves were accepted.
Results

The results of the PDF refinements for the ordered structure and the three temperature points above Tc are shown in Figure 5. The corresponding correlation values are given in Table 1 in the column marked ’RMC’. Inspection of Figure 5 reveals a nearly prefect agreement between the simulated ’data’ and the RMC result for all data sets except for some small differences in case of the ordered low-temperature structure. It should be noted, that the differences shown in Figure 5 are enlarged by a factor of 5. When comparing the resulting correlation values, one finds a very good agreement between the initial correlations (column ’MC’) and the refinement results (column ’RMC’). The most noticeable differences again are for the ordered structure. It is, however, not surprising that the RMC refinement is not able to produce the ordered structure exactly without some residual deviations. The results clearly show that chemical ordering information from crystalline materials can be obtained using RMC refinements of PDF data. However, one should keep in mind, that these simulations were carried out to investigate the principle possibilities of this technique, excluding problems introduced by noise and systematic errors one would encounter when using real experimental data.
Occupational and displacive disorder
The next step is to add distortions to a defect structure showing chemical short range order. In this example, the simulated test structure had no ’real’ analog. For convenience, we used the same concentration of Cu and Au atoms as in Cu3Au.
Simulations

The disordered structures were created in two steps: First the desired chemical ordering was introduced the same way as described in the previous section. As a second step, the atoms were displaced using MC simulations and a Hooke’s law potential as described above. The starting structure used is cubic primitive with a lattice parameter of Å. The model crystal extends over 32x32x32 unit cells giving a total of 32768 atoms. The site at (0,0,0) is randomly occupied with 75% copper atoms and 25% gold atoms. The chemical arrangement is characterized by a negative nearest neighbor correlation of and a positive second nearest neighbor correlation of . In other words nearest neighbor Cu-Cu and Au-Au pairs are avoided whereas second nearest neighbor pairs of the same atom type are favored compared to a random arrangement. The correlation coefficients actually achieved by the MC simulation are listed in Table 2. The PDF calculated from the structure containing only the occupational short-range order is shown in Figure 6a) superimposed on the PDF of the random structure. The difference between both data sets is plotted as well.
The effect of thermal motion on the PDF is simulated by convoluting with a Gaussian. In addition the atoms are shifted from their ideal position by the MC simulation introducing a size-effect type (Butler et al., 1992) distortion. In this case the resulting nearest neighbor distances are is Å and Å (Table 2). Note that the average distance is the lattice parameter Å. A total of 200 MC cycles were computed to create this structure. The calculated PDF is shown in Figure 6 in the bottom panel. The PDF of the undistorted starting structure is plotted in the same panel and the difference between both is shown below the data.

| Neighbor | Input | Run O | Run D |
|---|---|---|---|
| 1 0 0 | -0.30 | -0.29 | -0.25 |
| 1 1 0 | 0.51 | 0.50 | 0.50 |
| d | 3.73 | - | 3.74 |
| d | 3.77 | - | 3.76 |
Two different RMC refinements were carried out: Run O using the ’data’ containing chemical ordering only and Run D using the ’data’ containing additional displacements. Run O was carried out as a reference of the chemical correlations that can be refined when no displacements are present. The refinement was carried out exactly as described in the last section. The resulting PDFs are shown in Figure 7 and the achieved correlation values for run O are listed in Table2. As for Cu3Au, we observe an excellent agreement between ’data’ and the calculation. The interesting question is now, can one extract the chemical short range order equally well with the size-effect distortion present, and can one extract the magnitude of those distortions. In order to model occupational and displacive disorder simultaneously during the RMC refinement, we employed the following strategy which was already found to be successful when refining single crystal diffuse scattering (Proffen and Welberry, 1997b). The occupational shifts and displacement shifts were carried out alternately with no more than 10% of the crystal sites being visited before switching between the two modes. As before, the parameter was decreased during the RMC refinement in such a way that initially a significant amount of ’bad’ moves was accepted, however, in the final few cycles, no moves worsening the agreement between observed and calculated PDFs are accepted. The simulations were carried out for a total of 15 cycles when the agreement did not significantly improve any further. The resulting PDFs of run D are shown in Figure 7 and the achieved correlation values are listed in Table 2.
Results
Inspection of Figure 7a shows a very good agreement between the RMC result and the ’data’ for run O. The chemical correlations of the resulting structure match the expected ones nearly perfectly (see Table 2) similar to the result found for the Cu3Au simulations presented in the last section. The focus in this part is on run D where chemical and displacive contributions were present. The refined PDF shows a good agreement with the ’data’ (Fig. 7b), the only noticeable differences are at the nearest neighbor distance and at twice that distance. This indicates some residual differences in the exact distribution of distortions within the crystal. It is interesting to note that the successful refinement of a system showing displacements required a much larger model containing in excess of 32000 atoms compared to only 4000 used for the simulations of Cu3Au. In addition to the static displacements introduced as size-effect, the contribution of thermal vibrations to the PDF needs to be accounted for. Various test runs showed that modeling the thermal component via convolution of the PDF with a Gaussian gives better results compared to randomly displacing all atoms in the model structure. Inspection of the achieved correlations and displacements listed in Table 2 shows an overall good agreement with the expected values, although the nearest neighbor correlation does not match as good as for run D compared to the result of run O. The resulting distortions match the expected values as well. In summary, the chemical correlations as well as magnitudes of distortions were successfully extracted from the PDF using RMC simulations.
Conclusions and outlook
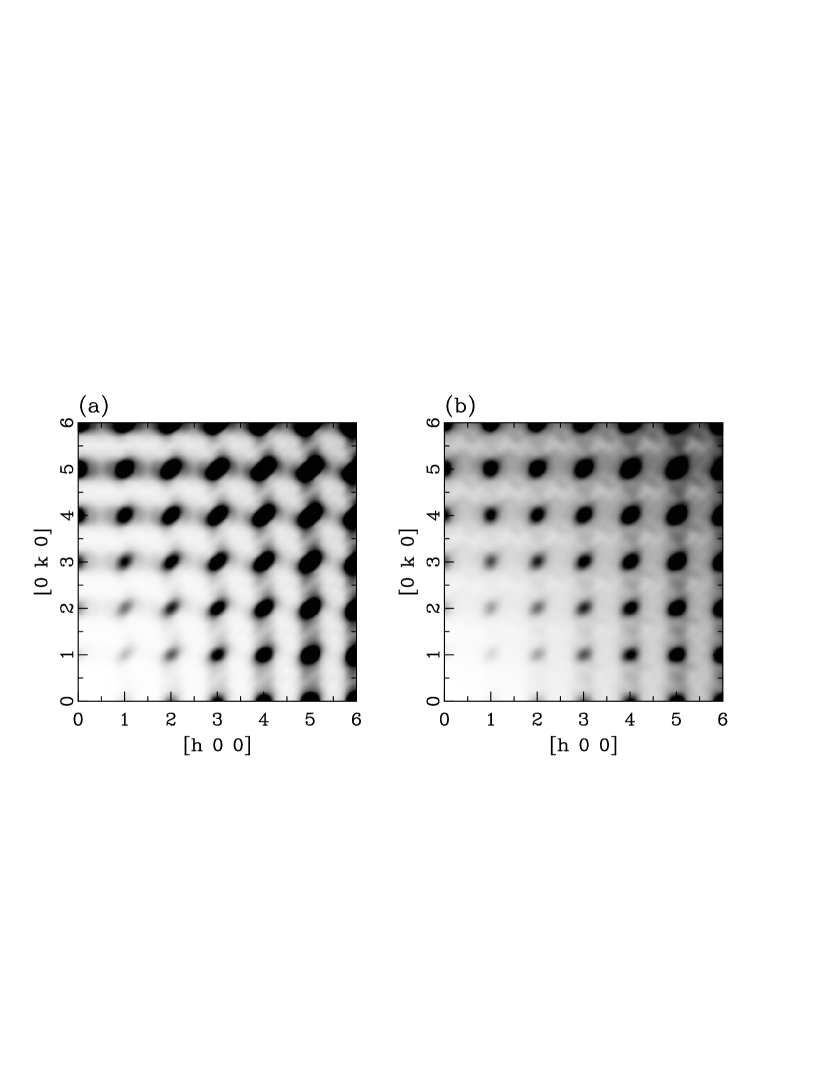
Two important conclusions can be made from the results presented in this paper: First the chemical short range order information can be extracted from the PDF using RMC simulations even in cases where additional displacive disorder is present. Furthermore, one can also extract the magnitude of the specific distortions very reliably. For this simple isotropic disorder, the extracted correlations for the underlying chemical ordering from the PDF are even slightly closer to the expected values than in a similar set of RMC refinements of single crystal diffuse scattering (Proffen and Welberry, 1997b). It is interesting to compare the diffuse scattering calculated from the input and resulting structure of run D. The calculated diffuse scattering for the zeroth layer of the hk-plane in reciprocal space is shown in Figure 8. The patterns show a qualitative agreement between ’data’ and refinement result, which strengthens the results obtained from refining the PDFs. In case of refining the diffuse scattering directly one obtains a much better match with the observed data (see Proffen and Welberry, 1997b). However, although the diffuse scattering patterns shown in Figure 8 are in general similar, closer inspection reveals an interesting difference: The pattern corresponding to the input structure has in general sharper more localized diffuse scattering whereas the pattern calculated from the RMC result is somewhat broader. This indicated that the defects in the resulting structure are not correlated over long enough lengths. Although the PDF contains diffuse scattering information as well, there is a certain complementarity between single crystal diffuse scattering and PDF data. We are currently investigating this relationship on the system In1-xGaxAs (Jeong et al., ). This opens the possibility of a joined refinement of single crystal diffuse scattering and PDF data obtained from powder data.
The ’data’ used for the refinements in this paper were calculated from given disordered structures, which allowed us to judge the results since the ’correct’ result was known. Additionally those data were free from experimental errors and noise, which of course will make refining of PDFs obtained from real experimental data more challenging. The simulations presented here were carried out using the total PDF, i.e. all atom pairs are included in the PDF. Using anomalous scattering or by combining neutron and x-ray data, one can separate out the different partial PDFs. For a simple binary compound consisting of atoms A and B, the corresponding partials would contain only AA, BB or AB (same as BA) atoms. More details can be found in a recent study of the total and differential PDF of In1-xGaxAs by Petkov et al. (1999). The program DISCUS used here can also be used to calculate or refine any partial PDF of a given structure. A different definition for partial PDFs was proposed by Bhatia and Thornton (1970). They separated the different terms in a binary case into a topological term (the usual PDF), the radial concentration correlation function (RCF) containing information about chemical fluctuations and a cross-term. Current efforts are to include the calculation and refinement of the RCF into the DISCUS program.
In summary, we have shown in this paper that RMC refinements of the PDF of disordered crystalline materials can extract chemical short-range order information for systems showing only occupational disorder as well as for systems showing occupational and displacive disorder in combination. The usage of faster and usually simpler powder diffraction measurements allows one to extract this information more quickly and cover e.g. many temperature points around a phase transition. However, for certain problems, one will still need to use single crystal diffuse scattering to determine the details of the defect structure or even perform a combined refinement of PDF and single crystal data. Measurements of the system Cu3Au using synchrotron radiation are planned and will be the first ’real’ test using the PDF method to extract chemical short range order parameters for this crystalline system. {acknowledgment} The author would like to thank A. Tomic for her contributions during the inital phase of the project as well as S.J.L. Billinge and V. Petkov for many fruitful discussions on the topic of chemical ordering and its influence on the PDF, which ultimately led to the work presented in this paper. I would also like to thank T.R. Welberry for his program and help to create the structures shown in Figure 1. This work was supported by DOE through Grant No. DE FG02 97ER45651.
References
- Bhatia and Thornton (1970) Bhatia, A.B.; Thornton, D.E.: Structural Aspects of the Electrical Resistivity of Binary Alloys. Phys. Rev. B 2 (1970) 3004–3012.
- Billinge (1998) Billinge, S.J.L.: Real-Space Rietveld: Full Profile Structural Refinement of the Atomic Pair Distribution Function. In Billinge and Thorpe (1998), page 137.
- Billinge and Thorpe (1998) Billinge, S.J.L.; Thorpe, M.F.; editors. Local Structure from Diffraction, New York, 1998. Plenum.
- Billinge (1996) Billinge, S.J.L.: The Structure of Real Materials using X-ray and Neutron Scattering. Current Opinion in Solid State and Mater. Sci. 1 (1996) 477–479.
- Billinge and Egami (1993) Billinge, S.J.L; Egami, T.: Short-Range Atomic Structure of Determined by Real-Space Refinement of Neutron-Powder-Diffraction Data. Phys. Rev. B 47 (1993) 14386–14406.
- Butler et al. (1992) Butler, B.D.; Withers, R.L.; Welberry, T.R.: Diffuse Absences due to the Atomic Size Effect . Acta Cryst. A48 (1992) 737–746.
- Chen et al. (1970) Chen, H.; Compstock, R.J.; Cohen, J.B.: Examination of Local Atomic Arrangements Associated with Ordering. Ann. Rev. mater. Sci. 9 (1970) 51–86.
- Cowley (1995) Cowley, J.M.: Diffraction Physics . Elsevier Science B.V., 3 edition, 1995.
- Egami (1998) Egami, T.: PDF Analysis applied to Crystalline Materials. In Billinge and Thorpe (1998), page 1.
- Frey (1995) Frey, F.: Diffuse Scattering from Disordered Crystals . Acta Cryst. B51 (1995) 592–602.
- Frey (1997) Frey, F.: Diffuse Scattering from Periodic and Aperiodic Crystals . Z. Kristallogr. 212 (1997) 257–282.
- Jagodzinski (1987) Jagodzinski, H.: Diffuse X-ray Scattering from Crystals . Prog. Cryst. Growth 14 (1987) 47–102.
- Jagodzinski and Frey (1993) Jagodzinski, H.; Frey, F.: Disorder Diffuse Scattering of X-rays and Neutrons , international tables of crystallography b 4.2, pages 392–432. IUCr, 1993.
- (14) Jeong, I.-K.;, Mohiuddin-Jacobs, F.; Petkov, V.; Billinge, S.J.L.; Chung, J.S.; Thorpe, M.F.; Kycia, S.: Local Structure Study of InxGa1-xAs Semiconductor Alloys using High Energy Synchrotron X-ray Diffraction. in preparation.
- Jeong et al. (1999) Jeong, I.-K.; Proffen, Th.; Mohiuddin-Jacobs, F.; Billinge, S.J.L.: Measuring Correlated Atomic Motion using X-Ray Diffraction. J. Phys. Chem. A103 (1999) 921–924.
- McGreevy and Pusztai (1988) McGreevy, R.L.; Pusztai, L.: Reverse Monte Carlo Simulation: a New Technique for the Determination of Disordered Structures . Mol. Simul. 1 (1988) 359–367.
- Metropolis et al. (1953) Metropolis, N.; Rosenbluth, A.W.; Rosenbluth, M.N.; Teller, A.H.; Teller, E.J.: Equation of State Calculations by Fast Computing Machines . J. Chem. Phys. 21 (1953) 1087–1094.
- Nield et al. (1994) Nield, V.M.; McGreevy, R.L.; Keen, D.A.; Hayes, W.: Structural Disorder in CuBr. Physica B 202 (1994) 159–166.
- Petkov et al. (1999) Petkov, V.; Jeong, I.-K.; Mohiuddin-Jacobs, F.; Proffen, Th.; Billinge, S.J.L.; Dmowski, W.: Local Structure of In0.5Ga0.5As from Joint High-Resolution and Differential Pair Distribution Function Analysis. J. Appl. Phys. (1999) submitted.
- Proffen and Billinge (1999) Proffen Th.; Billinge, S.J.L.: PDFFIT, a Program for Full Profile Structural Refinement of the Atomic Pair Distribution Function. J. Appl. Cryst. 32 (1999) 572–575.
- Proffen and Neder (1997) Proffen, Th.; Neder, R.B.: DISCUS, a Program for Diffuse Scattering and Defect Structure Simulations . J. Appl. Cryst. 30 (1997) 171–175.
- Proffen and Welberry (1997a) Proffen, Th.; Welberry, T.R.: An Improved Method for Analysing Single Crystal Diffuse Scattering using the Reverse Monte Carlo Technique . Z. Kristallogr. 212 (1997a) 764–768.
- Proffen and Welberry (1997b) Proffen, Th.; Welberry, T.R.: Analysis of Diffuse Scattering via Reverse Monte Carlo Technique: a Systematic Investigation . Acta Cryst. A53 (1997b) 202–216.
- Rietveld (1969) Rietveld, H.M.: A Profile Refinement Method for Nuclear and Magnetic Structures. J. Appl. Crystallogr. 2 (1969) 65–72.
- Toby and Egami (1992) Toby, B.H.; Egami, T.: Accuracy of Pair Distribution Function Analysis Applied to Crystalline and Non-Crystalline Materials. Acta Cryst. A48 (1992) 336–346.
- Warren (1990) Warren, B.E.: X-ray Diffraction . Dover Publications Inc., New York, 1990.
- Welberry (1985) Welberry, T.R.: Diffuse X-ray Scattering and Models of Disorder . Rep. Prog. Phys. 48 (1985) 1543–1593.
- Welberry (1986) Welberry, T.R.: Multi-Site Correlations and the Atomic Size Effect . J. Appl. Cryst. 19 (1986) 382–389.
- Welberry and Butler (1994) Welberry, T.R.; Butler, B.D.: Interpretation of Diffuse X-ray Scattering via Models of Disorder . J. Appl. Cryst. 27 (1994) 205–231.
- Welberry and Butler (1995) Welberry, T.R.; Butler, B.D.: Diffuse X-ray Scattering from Disordered Crystals . Chem. Rev. 95 (1995) 2369–2403.
- Yacoby (1999) Yacoby, Y.: Local Structure Determination on the Atomic Scale. Current Opinion in Solid State and Mater. Sci. 4 (1999) 337–341.