Dynamics of Excited Electrons in Copper: Role of Auger Electrons
Abstract
Within a theoretical model based on the Boltzmann equation, we analyze in detail the structure of the unusual peak recently observed in the relaxation time in Cu. In particular, we discuss the role of Auger electrons in the electron dynamics and its dependence on the -hole lifetime, the optical transition matrix elements and the laser pulse duration. We find that the Auger contribution to the distribution is very sensitive to both the -hole lifetime and the laser pulse duration and can be expressed as a monotonic function of . We have found that for a given , the Auger contribution is significantly smaller for a short pulse duration than for a longer one. We show that the relaxation time at the peak depends linearly on the -hole lifetime, but interestingly not on the amount of Auger electrons generated. We provide a simple expression for the relaxation time of excited electrons which shows that its shape can be understood by a phase space argument and its amplitude is governed by the -hole lifetime. We also find that the height of the peak depends on both the ratio of the optical transition matrix elements and the laser pulse duration. Assuming a reasonable value for the ratio, namely , and a -hole lifetime of , we obtain for the calculated height of the peak fs, in fair agreement with fs measured for polycrystalline Cu.
I Introduction
Two-photon photoemission (2PPE) has been applied intensively to study the electron-electron interaction in alkali, noble and transition metals.[2, 3, 4, 5, 6] The experimental results are often compared with the Fermi-liquid theory (FLT),[7] but such a comparison is only valid if the influence of secondary-electron generation and transport of excited carriers is negligible. Indeed, a series of 2PPE experiments involving photoexcitation of electrons from the band in Cu have shown an unusual non-monotonic behavior of the relaxation time.[8, 9, 10, 11] The relaxation time shows a broad peak at energies just above the -band threshold which shifts linearly with photon energy. Both the non-monotonic behavior and the dependence on photon energy are incompatible with FLT description or with recent calculations based on Green’s-function formalism.[12, 13, 14, 15] There is currently a controversy in the literature on the origin of the peak and especially on the role of secondary electrons.[8, 9, 10, 11] One of the key questions concerns the amount of Auger electrons contributing to the hot-electron distribution in the region of the peak. On the basis of simple model calculations, Petek et al. have estimated that the Auger contribution is less than 10%,[16] while Knoesel, Hotzel, and Wolf could reproduce their correlation measurement by assuming that the hot electron population above the -band threshold was entirely generated via the Auger process.[10] Note that the experiments were performed using different pulse durations (12 and 70 fs, resp.).
In a previous work, we have developed a theory for the dynamics of excited electrons in metals, which includes both the effects of secondary electrons and transport. We used a Boltzmann-type equation in the random-k approximation for the calculation of the distribution function of excited electrons. A detailed description is given in Ref. [17]. The calculations have shown a peak in the relaxation time at the right energy reflecting the -band threshold and a linear shift with photon frequency, in agreement with experiments. However, the height of the peak fs calculated using fs was smaller than the observed one fs.[9] Furthermore, a simplified procedure was used to extract the relaxation time which also led to an overestimate of the peak height. Indeed for simplicity, the relaxation time was extracted by fitting the distribution of excited electrons, , which was very sensitive to the influence of secondary electrons causing a deviation from a simple exponential decay. To make our results more reliable, in this work we use the same fitting procedure as the one used by experimentalists, i.e. we fit , given by the convolution of the probe laser profile with the distribution of excited electrons.
In this paper, we will analyze in detail the structure and height of the peak and the role of secondary electrons, especially focussing on the Auger contribution and the -hole lifetime. In order to shed light on the contribution of Auger electrons,[10, 16] we have started by analyzing their weight in the total hot-electron distribution. For this purpose we have performed calculations for different hole lifetimes () and laser pulse durations () and found that their relative contribution can be expressed in a simple way as a product of a function of and a phase space function which is energy-dependent. In addition, we show that the height of the peak in the relaxation time depends mainly on the hole lifetime and surprisingly not on the amount of Auger electrons. It will be shown that the relaxation time for energies above the -band threshold scales linearly with and its structure is determined by the same phase space function as mentioned above. Finally, we study how the height of the peak depends on the optical transition matrix elements and on the laser pulse duration.
II Results and discussion
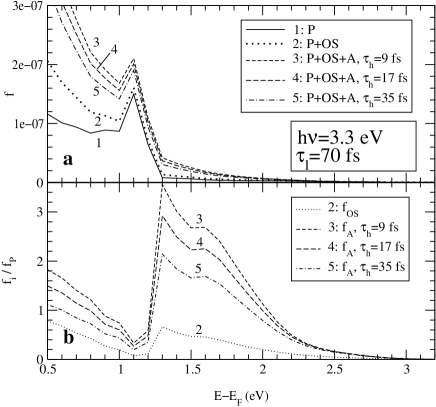
As said in the introduction, the composition of the hot-electron distribution in terms of different contributions ( for primary, Auger, other secondary electrons) is an open question. We determine their respective weight and compare the distribution of hot electrons for different cases in Fig. 1. We especially focus our attention on the variation as function of the hole lifetime at the top of the band, . The hole lifetime plays an important role, since it determines the generation rate of Auger electrons which may strongly influence the dynamics of excited electrons above the Fermi energy. Note that in our model, the hole lifetime is the inverse of the Auger scattering rate, thus we cannot vary independently the hole lifetime and the amount of Auger electrons generated. One should mention that experimentally, lower bounds of 24 fs and 26 fs have been reported for the hole lifetime at the top of the band in Cu.[18, 19] Since there is up to now no clear consensus on the value of , in our calculation we will consider it as a free parameter. In absence of a band, the electron-hole symmetry would hold, and our calculation gives then fs for the hole lifetime at eV. Due to the localized nature of the -wave functions, the -hole lifetime is expected to be significantly larger than the -hole lifetime, which will hence be considered as a reasonable lower bound. We start with the case of a laser pulse of photon energy eV and duration fs (FWHM) as used in Ref. [10]. Later, we will discuss the effect of changing the laser pulse duration.
In Fig. 1(a) we show results of the distribution of hot electrons for different cases: with and without secondary electrons and for different hole lifetimes. We observe a peak in the primary electron distribution at eV which is due to the sharp feature in the -band density of states; at this energy, primary electrons are dominating. To simplify the discussion, in Fig. 1(b), we plot for . In the region of the peak in , the primary electron contribution is dominating, which appears now as a dip in . Below the peak, there is a continous rise of both the Auger and other secondary electron contribution. On the other hand, just above the peak, there is a sharp increase of the weight of the secondary electrons, largely dominated by the Auger contribution, with a maximum at eV. We observe that a change of the hole lifetime leads to a significant variation of the Auger contribution. For example, for fs, , whereas for shorter lifetime fs, . In our model, a shorter hole lifetime corresponds to a larger Auger scattering rate and therefore to a larger amount of Auger electrons. Note that has the same shape for any given , only the relative amplitude is changing. This will be analyzed further when discussing the effect of the laser pulse duration. Furthermore, we find that for eV, the contribution of secondary electrons is always negligible.
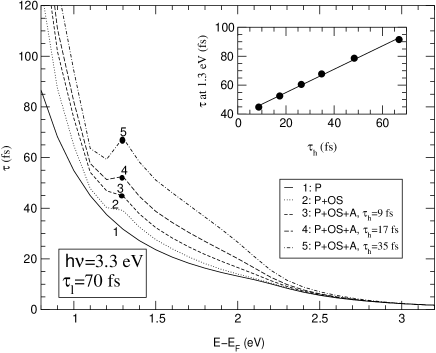
In Fig. 2, we show the relaxation time as function of energy for different cases (see Fig. 1). The relaxation time is determined by a fit to the 2PPE signal as discussed in connection with Fig. 6. It will be interesting to see how the peak in the relaxation time depends on both and on the hole lifetime. First, we observe that when considering only primary processes (), the relaxation time is a monontonic function, as it can be expected on the basis of FLT. However, when including other secondary processes (but no Auger process), we immediately observe some significant changes for eV and some new structure at intermediate energy. When comparing with Fig. 1(b), the changes in due to the presence of other secondary electrons coincide with the variation of discussed previously. Indeed, at eV (dip in ), is almost unchanged. Then a small peak appears at eV (region where the secondary contribution is the highest), and for eV, (negligible secondary electron contribution). This picture remains qualitatively unchanged when including the Auger process.
Let us now comment on the quantitative aspect. First of all, a clear and well-defined peak is observable when gets sufficiently large (typically fs). It is also interesting to note that for small (large Auger scattering rate), the effect is very weak, in spite of the fact that the Auger contribution to the electron distribution is large [see Fig. 1(b)]. This is a clear indication that the amplitude of the peak in is mainly controlled by the hole lifetime. This is indeed illustrated in the inset of Fig. 2, where at is plotted as function of the hole lifetime. We see clearly that scales linearly with .
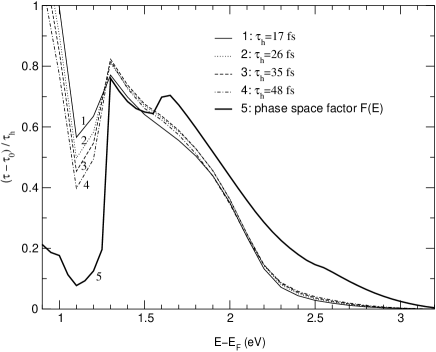
It is important to mention that we have found that this linear scaling behavior is also valid for other energies. This suggests that could be expressed as a sum of two terms, (including primary and other secondary processes), and a term proportional to (Auger contribution), where the coefficient is a phase space factor depending on the DOS only. To be more explicit, we suggest that the relaxation time can be written as , where is a phase space factor defined as the ratio between a) the available phase space for Auger scattering and b) the phase space for the optical excitation.
To test the validity of this expression, in Fig. 3, we have plotted in the same figure as function of and the calculated . Clearly, for eV, one can see that the values for lie almost on the same curve, which depends only on the energy. A deviation is observed for smaller energy, where Auger electrons are no longer the dominant contribution to the hot-electron distribution [see Fig. 1(b)]. However, the position of the dip is always found at 1.1 eV. Within some deviations at high and low energy, we observe a fair agreement between and . Note that a peak appears in at eV, whereas in , one finds only a shoulder at this position. This can be attributed to the fact that by definition contains the explicit details of the DOS, whereas the relaxation time is not so sensitive to the details of the DOS.
To summarize this discussion, the important result is that the amplitude of the broad peak in is controlled by and its shape by the phase-space factor (in random-k approximation, it depends only on the DOS). When comparing Fig. 3 and Fig. 1, we find that is also proportional to , which will be commented later.
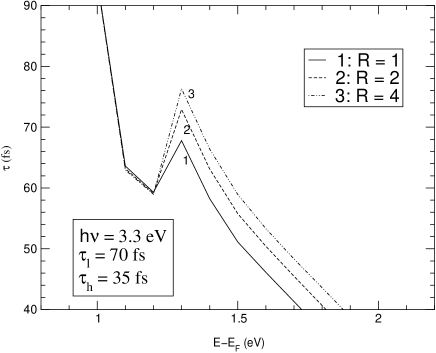
As was shown in Fig. 3, the shape of the peak in the relaxation time is determined by the function which contains the information on the optical transition matrix elements. Therefore, in Fig. 4 we analyze how sensitively the relaxation time depends on the optical transition matrix elements. Till now, we have presented data for the case of equal matrix elements, . However, on the basis of the different degree of localization of the and -type wave functions, it is expected that should be larger than . For example, in the calculation of the dielectric function for Ag, a ratio was estimated.[20]
In Fig. 4, we have plotted for different values of the ratio . If we define the height of the peak as , we find that when changing from 1 to 2, varies significantly from 9 fs to 14 fs (increase by 60%). However for a further increase of from 2 to 4, the change is much weaker (14 fs to 17 fs, increase by only 30%). Assuming that for Cu, is of the same order of magnitude as for Ag, one can get an estimate of the hole lifetime required to get fair agreement with the observed height of the peak for polycrystalline Cu, fs.[9] We have found that for , fs gives fs. Note that our results obtained in the random-k approximation are most suitable for comparison with experiments performed on polycrystalline material. Measurements on single crystals for different orientations have provided values ranging from to 40 fs, which is the same order of magnitude.[8, 9, 10, 11] It is interesting to note that fs coincides with the value used by Knoesel, Hotzel, and Wolf in their simulation.[10]
Note that our conclusions are not restricted to the case of Cu only, but hold also in the case of other noble and transition metals. Indeed, let us discuss the case of Ag, Au and the 3 transition metals Fe, Co and Ni. In the case of Ag, no peak is observed in the relaxation time,[4] due to the fact that the band threshold is approximatively at 4 eV below the Fermi level and no electrons are excited for the photon energies widely used in 2PPE experiments ( eV). The case of Au is more intriguing, since the location of the -band threshold is very similar to the one in Cu. Indeed, a very weak structure in the relaxation time was also observed for Au.[21] The fact that the peak in Au is so weak can be attributed to the small degree of localization of the of the hole. It is expected that a 5 hole in Au should be less localized and therefore have a larger Auger scattering rate than a 3 hole in Cu. Thus one expects and thus in accordance with our result that the peak is governed by , a less pronounced structure in Au than in Cu. Another possible explanation is the fact that the peak in the -band DOS in Au is much less pronounced than in Cu (again due to the less localized electrons in Au), leading to a less sharp separation between excitations from the and bands and therefore to a weaker peak. Let us now comment on the fact that in the ferromagnetic transition metals Fe, Co and Ni, no peak is observed.[6, 17] There are two main reasons for the absence of this feature. (i) A threshold for transitions is not observable due to the band structure. The majority band extends to energies above and a threshold does not exist. The upper minority band edge is located very closely to and the threshold occurs only at the highest excitation energies where secondary (Auger) electron contributions are not important. (ii) The holes have a large available phase space for decay within the band which leads to a very short -hole lifetime.
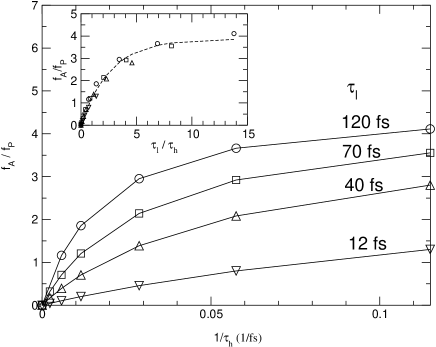
All the results presented up to now were for fs. However, experiments were performed with laser pulse durations ranging from 70 fs down to 12 fs.[8, 9, 10, 11] Hence, it is interesting to calculate how depends on . First, let us show that the relative weight of the Auger contribution to the hot electron distribution is indeed strongly sensitive to the laser pulse duration. In Fig. 5, we have plotted as a function of for laser pulses varying from 12 to 120 fs duration. The first observation is that when reducing the laser pulse duration for a given , is strongly reduced. For instance, for fs, goes from 3 to 0.5 (6 times smaller) when reducing the laser pulse from 120 to 12 fs. This might already explain the origin of the controversy about the amount of the Auger electron contribution mentioned before. It is clear that in experiments with very short laser pulses (12 fs in Ref. [16]), the Auger electron contribution is much smaller than in experiments with longer laser pulses (70 fs in Ref. [10]). At this level, one can conclude that the laser pulse duration is a new relevant time scale. However, we have found that the only relevant parameter for the variation of is in fact . In the inset of Fig. 5, we have plotted as function of and we see that all the data points lie to a very good approximation on the same curve, i.e. . In this figure, the data are plotted for eV, however, it has to be stressed that this scaling is also found for higher energies. The ratio can be reduced to an expression of the form , where is again the phase factor discussed in the previous section.
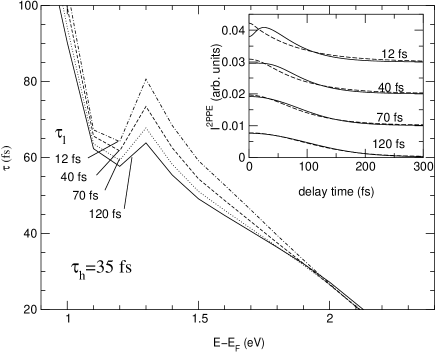
Since the relaxation time is determined from which contains explicitly the information about the laser pulse, let us now analyze how is affected by changing the pulse duration. In Fig. 6, we show the dependence of the relaxation time on the pulse duration for durations varying from 120 to 12 fs. We observe a significant effect in the region of the peak. Interestingly, the peak gets higher for the shorter pulses, although the amount of Auger electrons is much smaller, see Fig. 5. Note that the dependence on the pulse duration disappears for high energies, where the secondary-electron contribution is negligible. In order to understand the sensitivity to the pulse duration, in the inset of Fig. 6, we present the calculated and the fit by an exponential model function used to extract the relaxation time. We see that the agreement is very good for pulses of 120 and 70 fs duration, while there is a clear deviation from the single-exponential fit for shorter pulses of 40 and 12 fs. Indeed, for the 12 fs pulse, there is a delayed rise in which is due to the delayed generation of Auger electrons. Such a delayed rise for very short laser pulses was recently observed experimentally.[11] As an additional remark, the observed deviations underline the difficulties in extracting a relaxation time in the limit of very short pulses and indicate that maybe an improved definition of the relaxation time would be appropriate in this case.
III Conclusion
To conclude, this work presents a detailed analysis of the role of secondary electrons in 2PPE experiments on Cu. The -hole lifetime plays a crucial role. Our conclusions are more general and can also be applied to other noble and transition metals as discussed. We have found that in the case of Cu, the secondary-electron distribution is dominated by the Auger contribution (for fs) for longer laser pulses ( fs), but not for a very short laser pulse of fs. For a given , the Auger contribution is much larger for a longer laser pulse duration than for a shorter one. The parameter which controls the variation of is . Concerning the structure in the relaxation time, we have shown that the relaxation time at the peak depends linearly on , but surprisingly not on the amount of secondary electrons generated. The shape depends on a phase-space factor (in random-k approximation, on the DOS). We provided an expression for the relaxation time as a sum of two terms: the first for primary (and other secondary) electrons and the second for the Auger contribution. We have also found that the height of the peak depends sensitively on the optical transition matrix element ratio, , and on the laser pulse duration. For a value of and , the calculated height of the peak is fs in fair agreement with a measurement on polycrystalline Cu giving fs. Note, preliminary results indicate that transport changes the magnitude of the relaxation time, but not the structure and height of the peak. The influence of transport will be studied in detail in a separate publication.[22] In view of the importance of the -hole lifetime, it would be highly desirable to perform further experiments as well as theoretical calculations on the -hole lifetime in both Cu and Au.
Acknowledgements.
We would like to thank M. Aeschlimann, M. Wolf and E. Matthias for interesting discussions. Financial support by Deutsche Forschungsgemeinschaft, Sfb 290 and 450, is gratefully acknowledged.REFERENCES
- [1] [∗]Author to whom correspondence should be addressed. Electronic address: roland.knorren@physik.fu-berlin.de
- [2] C. A. Schmuttenmaer, M. Aeschlimann, H.E. Elsayed-Ali, R.J.D. Miller, D.A. Mantell, J.Cao, and Y. Gao, Phys. Rev. B 50, 8957 (1994).
- [3] T. Hertel, E. Knoesel, M. Wolf, and G. Ertl, Phys. Rev. Lett. 76, 535 (1996).
- [4] M. Aeschlimann, M. Bauer, and S. Pawlik, Chem. Phys. 205, 127 (1996).
- [5] S. Ogawa, H. Nagano, and H. Petek, Phys. Rev. B 55, 10869 (1997).
- [6] M. Aeschlimann, M. Bauer, S. Pawlik, W. Weber, R. Burgermeister, D. Oberli, and H.C. Siegmann, PRL 79, 5158 (1997).
- [7] J.J. Quinn, Phys. Rev. 126, 1453 (1962).
- [8] S. Pawlik, M. Bauer and M. Aeschlimann, Surf. Sci. 377-379, 206 (1997).
- [9] J. Cao, Y. Gao, R.J.D. Miller, H.E. Elsayed-Ali, and D.A. Mantell, Phys. Rev. B 56, 1099 (1997).
- [10] E. Knoesel, A. Hotzel, and M. Wolf, Phys. Rev. B 57, 12812 (1998).
- [11] H. Petek, H. Nagano, and S. Ogawa, Appl. Phys. B 68, 369 (1999).
- [12] I. Campillo, J.M. Pitarke, A. Rubio, E. Zarate, and P.M. Echenique, Phys. Rev. Lett. 83, 2230 (1999).
- [13] P.M. Echenique, J.M. Pitarke, E.V. Chulkov, and A. Rubio, Chem. Phys. 251, 1 (2000).
- [14] W.D. Schöne, R. Keyling, M. Bandić, and W. Ekardt, Phys. Rev. B 60, 8616 (1999).
- [15] R. Keyling, W.D. Schöne, and W. Ekardt, Phys. Rev. B 61, 1670 (2000).
- [16] H. Petek, H. Nagano, M.J. Weida, and S. Ogawa, Chem. Phys. 251, 71 (2000).
- [17] R. Knorren, K.H. Bennemann, R. Burgermeister, and M. Aeschlimann, Phys. Rev. B 61, to appear.
- [18] H. Petek, H. Nagano, and S. Ogawa: Phys. Rev. Lett. 83, 832 (1999).
- [19] R. Matzdorf, A. Gerlach, F. Theilmann, G. Meister, A. Goldmann, Appl. Phys. B 68, 393 (1999).
- [20] R. Rosei, C.H. Culp, J.H. Weaver, Phys. Rev. B 10, 484 (1974).
- [21] J. Cao, Y. Gao, H.E. Elsayed-Ali, R.J.D. Miller, D.A. Mantell, Phys. Rev. B 58, 10948 (1998).
- [22] R. Knorren, G. Bouzerar, K. H. Bennemann, unpublished.