[
A reconstruction from small-angle neutron scattering measurements of the real space magnetic field distribution in the mixed state of Sr2RuO4.
Abstract
We have measured the diffracted neutron scattering intensities from the square magnetic flux lattice in the perovskite superconductor Sr2RuO4, which is thought to exhibit p-wave pairing with a two-component order parameter. The relative intensities of different flux lattice Bragg reflections over a wide range of field and temperature have been shown to be inconsistent with a single component Ginzburg-Landau theory but qualitatively agree with a two component p-wave Ginzburg-Landau theory.
pacs:
PACS numbers: 61.12 Ex, 74.60 Ge, 74.70 Tx]
The discovery of superconductivity at temperatures near 1K in strontium ruthenate [1] has excited great interest because it is a superconducting layered perovskite which does not contain copper. However it shows great differences from the High-Tc cuprates: it is a stoichiometric undoped compound with a long mean free path, in which the electrons form a Fermi liquid with a well-established quasi-two-dimensional Fermi surface [2]. Furthermore, it was suggested [3] that the strongly interacting electrons pair in a triplet p-wave state (rather than the singlet, mainly d-wave state which is believed to occur in hole-doped cuprates). Clear evidence of non s-wave pairing in this compound has been provided by the observation [4] that nonmagnetic impurities strongly suppress Tc, which extrapolates to K in the clean limit. Strong support for triplet (p-wave) pairing is given by the results of Ishida et al. who have measured the Knight shift with a field parallel to the RuO2 planes [5]; the spin susceptibility measured by the Knight shift is not suppressed below Tc,unlike a singlet superconductor. Also, SR measurements in the Meissner state in zero field [6] have revealed spontaneous fields, which can be generated by domain boundaries, surfaces and impurities in a superconductor which breaks time-reversal symmetry [7]. Such states can arise most naturally with p-wave pairing, but also are possible with d-wave singlet pairing.
Agterberg [8, 9] argued that if the pairing was time-reversal symmetry breaking p-wave, then in tetragonal symmetry the d-vector [10] has the symmetry ( is the azimuthal angle about the tetragonal c axis), and a two-component Ginzburg Landau (TCGL) theory would be expected to describe the superconductor. In zero field, this gives two degenerate states which are related by time reversal; with a field applied in the c-direction perpendicular to the planes, one is dominant, but the other is also present [11]. Under these conditions, a small amount of anisotropy in the Fermi surface would lead to a square flux lattice instead of a triangular one, with the orientation of the square flux line lattice (FLL) relative to the crystal axes determined by the orientation of the fourfold anisotropy of the paired electrons. The FLL structure has been observed in this material [12] and is observed to be square over a wide range of field and temperature. The nearest-neighbour directions in the square FLL are at 45∘ to the Ru-O-Ru directions in the crystal lattice [13].
These results are consistent with the pairing wavefunction described above. However, a square FLL is also seen in borocarbide superconductors, which are definitely non-p-wave [14, 15, 16]. Also, one can measure spontaneous fields in a superconductor by SR due to other causes or from other states than that proposed, and application of a strong field in the basal plane to observe the Knight shift might alter the pairing state. Hence, it is important to obtain further evidence as to what kind of superconductivity occurs in strontium ruthenate. Here we present a detailed study of the scattered neutron intensities from the FLL. We show that they are not consistent with a single component Ginzburg-Landau model. Also we demonstrate how the local may be reconstructed from our data and show that the FLL structure is quite different from the Abrikosov one.
We shall present measurements of intensities of higher-order Bragg reflections from the FLL so we consider how they are related to the FLL structure. The formula [17] for the integrated intensity of a diffracted peak of wavevector gives:
| (1) |
where is a spatial Fourier component of the local field in the mixed state:
| (2) |
In the Abrikosov solution of the Ginzburg-Landau (GL) equations (as applied to a square lattice) [18], the are given by:
| (3) |
this rapidly falls off with (see Table I).
The Abrikosov solution is only valid near . In high- superconductors, with the field not close to , the London expression [19] is appropriate instead. This gives . Note that unlike the Abrikosov solution, all the are positive. Table I shows that the Fourier components fall off much less rapidly with . However, strontium ruthenate has a value of the Ginzburg Landau parameter for the field along the c axis, which means that the London approach is not realistic except at very low inductions. Therefore, to see what conventional GL theory predicts for this material at lower fields, one must use the Brandt numerical solution of the GL equations [20]. Typical results are given in Table I.
Next, we consider the Agterberg TCGL solution [8, 9], which is equivalent to the Abrikosov one, except that there are two complex order parameters instead of only one. In the mixed state with parallel to c both components are automatically present because of mixed gradient terms in the free energy functional [8, 9]. Typical values from this theory for , relative to and the resulting SANS intensities are given in Table I. It may be seen that the two-component theory gives intensities that fall off much less rapidly with than those given by the one-component Abrikosov solution.
Under the conditions of our experiments, where the field is not close to , it may be argued that the Abrikosov approximation used by Agterberg is not appropriate. However, recently Heeb and Agterberg have solved numerically the GL equations at all fields for the TCGL case [21]. We also give in Table I a list of Fourier components from these calculations, using values of parameters that appear to describe our results quite well.
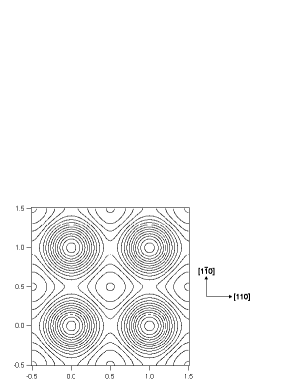
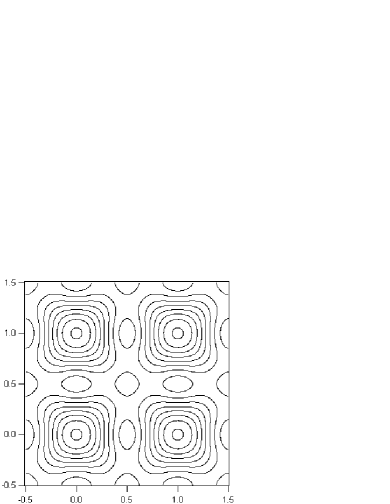
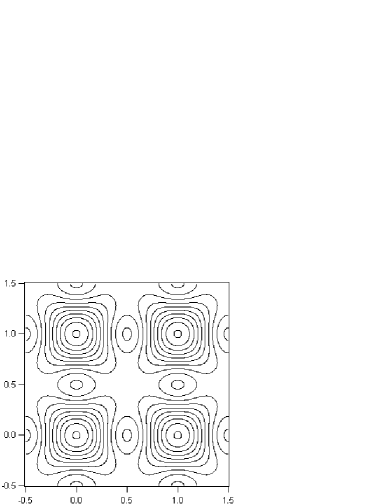
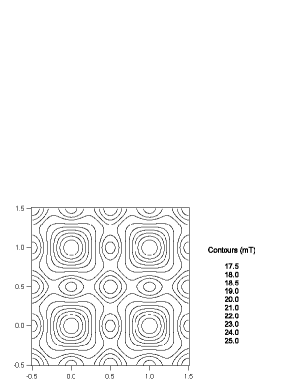
The corresponding vortex structures in real space are shown in Figures 1-4. Note that there is a minimum field point in the two-component theory (for the conditions of our experiment) which lies between the positions of the flux line cores, not in the centre of the square. We give results of this theory for two values of the parameter () [9] which describes the degree of fourfold anisotropy of superconducting electrons ( corresponds to a cylindrical Fermi surface). We note that the results do not change greatly with . Hence the qualitative difference between Figures 1 and 3 is due to the difference between TCGL and GL theories rather than effects of fourfold crystal anisotropy. It may be that is quite small since is sufficient to stabilise a square FLL and align it to the crystal lattice with an orientation determined by the sign of [9].
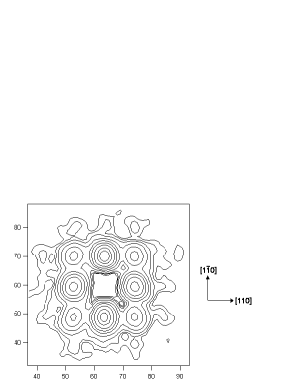
We now turn to measurements of the FLL structure. Single crystal Sr2RuO4 was prepared by the floating zone technique with excess RuO2 as a flux [22]. Six plates of total mass 556 mg were cleaved from the as-grown crystal and annealed for 72 hours in air at 1420∘C to remove defects and increase Tc, which was 1.39K with a width (10-90%) of 50 mK. With the field applied parallel to the c-axis at 100 mK, the value of was 58mT. For the small angle neutron scattering (SANS) measurements, the samples were mounted with conducting silver paint as an aligned mosaic with their c-axes perpendicular to a copper plate, which was mounted on the mixing chamber of a dilution refrigerator. This was placed between the poles of an electromagnet, which had holes parallel to the field for transmission of neutrons. The magnetic field was parallel to the c-axes of the crystals within 2∘, and the FLL was observed using long-wavelength neutrons on instrument D22 at the Institut Laue Langevin. Typical wavelengths employed were 14.6 Å, with a wavelength spread (FWHM) of 12%; the neutron beam was incident nearly parallel to the applied field, and the transmitted neutrons were registered at a pixel multidetector (pixel size mm2) placed 17.71 m beyond the sample. Typical results are shown in Fig 5. In addition to the strongest reflections, the reflections are strong, and higher orders are present. The intensity of the strongest diffraction spot is 10-3 of the incident beam intensity, so these higher order reflections are not due to multiple scattering. Their intensities are recorded in Table I: it will be noted that they are much larger than those given by the Abrikosov structure.
To reconstruct the of the FLL corresponding to these results, we require the sign of relative to (the FLL is centrosymmetric, so all the are real). The most important component after is . If it has the same sign as , then the components add in phase at the flux line cores to give a field peak that is sharper than the field minimum. Measurements of the field distribution in strontium ruthenate by SR [23, 24] show that this is the case. This sign for is not surprising, since all models in Table I give it as positive. For the small contributions of and , we may assume the same signs as given by the Agterberg and Abrikosov solutions: taking the London sign makes a large difference to , and also can be ruled out by SR results . The reconstruction of is shown in Fig. 4. Note that it is completely different from the Abrikosov or Brandt solutions to the GL equations, and in good qualitative agreement with the TCGL predictions.
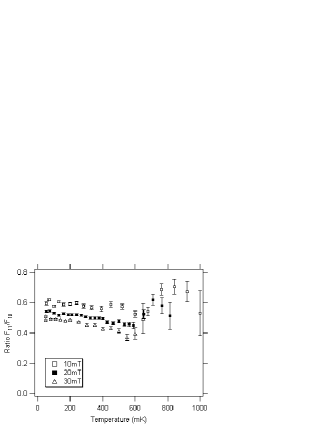
The results we have given so far correspond to low temperature and a particular magnetic field value. In Table II we present the values of the form factors and for a range of fields at 100mK. Also, in Fig 3 we plot versus temperature the ratio of the Fourier components for the strongest two reflections at 10, 20 and 30mT. Remarkably, this ratio varies little with field and temperature and does not tend to the Abrikosov value as TTc. Non-local effects [16] and deviations from GL theory in ultra pure superconductors [25] should both die away at high temperatures. Therefore, these effects are not expected to be the cause of the flux line shapes we report, although they may affect the details of (r) at low temperatures.
In conclusion, the strength of the higher order reflections from the FLL in strontium ruthenate and their temperature dependence certainly show that a standard one component Ginzburg Landau model is insufficient to explain the observed diffraction pattern. However, our results are in good qualitative but not perfect agreement with a two component Ginzburg Landau theory. Unconventional flux line shapes in this material are strong evidence for unconventional superconductivity in Sr2RuO4.
We thank J-L Ragazzoni of the ILL for setting up the dilution refrigerator, E.H. Brandt for a copy of his code to solve the GL equations and G.M. Luke for communicating his results prior to publication. This work was supported by the U.K. E.P.S.R.C., CREST of Japan Science and Technology Corporation, and the neutron scattering was carried out at the Institut Laue-Langevin, Grenoble.
REFERENCES
- [1] Y. Maeno et al., Nature 372, 532 (1994).
- [2] A. P. Mackenzie et al., Phys. Rev. Lett., 76, 3786 (1996), C.Bergemann et al., cond-mat/9909027
- [3] T. M. Rice and M. Sigrist, J.Phys: Condens. Matter 7, L643 (1995).
- [4] A. P. Mackenzie et al., Phys. Rev. Lett., 80, 161 and 3890 (1998).
- [5] K. Ishida et al., Nature 396, 658 (1998).
- [6] G. M. Luke et al., Nature 394, 558 (1998).
- [7] M. Sigrist and K. Ueda, Rev. Mod. Phys. 63, 239 (1991).
- [8] D. F. Agterberg, Phys. Rev. Lett. 80, 5184 (1998).
- [9] D. F. Agterberg, Phys. Rev. B. 58, 14484 (1998).
- [10] Y. Maeno et al., Journal of Superconductivity, 12, 535 (1999).
- [11] R. Heeb and D. F. Agterberg, Phys. Rev. B 59, 7076 (1999)
- [12] T. M. Riseman et al., Nature 396, 242-5 (1998).
- [13] E. M. Forgan and D. McK. Paul, Correction to Nature, to be published (2000).
- [14] D. McK. Paul et al.. Phys. Rev. Lett. 80 1517 (1998).
- [15] M. R. Eskildsen et al., Nature 393, 242 (1998)
- [16] Y. De. Wilde et al., Phys. Rev. Lett. 78, 4273, (1997).
- [17] D. K. Christen et al., Phys. Rev. B 15, 4506-9 (1977).
- [18] A. A. Abrikosov, 1957, Sov. Phys. JETP 5 1174 (1957), E. H. Brandt, Phys. Stat. Sol. B 64 257, 467 65 469 (1974).
- [19] M. Tinkham, 1975, Introduction to Superconductivity, Malabar, Florida, USA:McGraw-Hill
- [20] E. H. Brandt, Phys. Rev. Lett., 78, 2208 (1997).
- [21] R. Heeb and D. F. Agterberg, to be published
- [22] Z. Q. Mao et al., to be published in Mat. Res. Bull (2000).
- [23] C.M. Aegerter et al., J.Phys: Cond. Mat., 10, 7445-51 (1998).
- [24] G. M. Luke et al., to be published (2000)
- [25] J. M. Delrieu, J. Low Temp Phys., 6, 197-219 (1972).
∗Email address: P.G.Kealey@bham.ac.uk

| of diffraction peak: | {1,1} | {2,0} | {2,1} |
|---|---|---|---|
| 1.414 | 2.0 | 2.236 | |
| (London | 0.53 | 0.27 | 0.22 |
| (Abrikosov): | 0.2079 | -0.00898 | 0.00187 |
| (Agterberg ): | 0.5657 | -0.1051 | 0.0353 |
| (Agterberg ): | 0.7711 | -0.0667 | 0.0503 |
| (Heeb and Agterberg | 0.484 | -0.019 | 0.046 |
| , ): | |||
| (London): | 0.199 | 0.0365 | 0.0216 |
| (Abrikosov): | 0.0306 | 0.00004 | 0.000002 |
| (GL (Brandt)): | 0.0783 | 0.00091 | 0.000298 |
| (Agterberg ): | 0.2263 | 0.00552 | 0.00056 |
| (Heeb and Agterberg | 0.166 | 0.00095 | 0.00018 |
| , ): | |||
| 0.197(2) | 0.011(3) | 0.007(1) | |
| (Expt. at 20 mT 100mK): |
| Magnetic Field (mT) | (mT) | (mT) |
|---|---|---|
| 100 | 1.14(3) | 0.66(3) |
| 150 | 1.02(9) | 0.54(1) |
| 200 | 0.88(1) | 0.47(1) |
| 250 | 0.71(1) | 0.36(1) |
| 300 | 0.58(1) | 0.29(1) |
| 350 | 0.45(1) | 0.24(1) |
| 400 | 0.30(2) | 0.14(1) |