Dynamics of two-particle granular collisions on a surface
Abstract
We experimentally examine the dynamics of two-particle collisions occuring on a surface. We find that in two-particle collisions a standard coefficient of restitution model may not capture crucial dynamics of this system. Instead, for a typical collision, the particles involved slide relative to the substrate for a substantial time following the collision; during this time they experience very high frictional forces. The frictional forces lead to energy losses that are larger than the losses due to particle inelasticity. In addition, momentum can be transfered to the substrate, so that the momentum of the two particles is not necessarily conserved. Finally, we measure the angular momenta of particles immediately following the collision, and find that angular momentum can be lost to the substrate following the collision as well.
pacs:
45.50.Tn, 83.10.Pp, 45.70.-nI Introduction
Dry granular systems have generated much interest recently in the physics and engineering communities, both for fundamental understanding and for direct applications [1, 2, 3]. These systems are important both in nature (e.g. avalanches) and in industry (e.g. pharmeceuticals and grain elevators).
Particles in such systems are typically considered to interact only through interparticle collisions, i.e. repulsive contact forces. Experiments that can yield quantitative data for velocities, collision rates and other useful quantities are often performed in two dimensions. In order to allow reasonable motion of particles in such an experiment, the particles must either be free to roll or they must be levitated, for instance by air flow. Here, we consider particles rolling on a smooth flat surface. We note that there are then two types of friction that the particles experience when in motion. The first, rolling friction, occurs when the particle is moving without sliding on the substrate; its effect is relatively weak, with a coefficient of friction on the order of [4]. Rolling friction affects individual particles independently of collisions; it tends to damp motion slowly over time. It also affects the mobility of particles on the surface. For example, segregation occurs when particles of differing surface properties are shaken on a smooth surface[5]. The second type of friction affecting particles is sliding friction. This occurs when the contact point of the particle and the surface is not instantaneously at rest. Sliding friction can occur when particles undergoing collisions experience frictional frustration, i.e. when it is impossible to maintain nonsliding contacts between colliding particles and the substrate. During a collision the contact force between the particles is much greater than the force of gravity, so some sliding on the substrate will occur. Sliding friction is much more dissipative than rolling friction, with a coefficient of friction on the order of [6]. In the experiments described here, the sliding interactions with the substrate are the predominant mechanism for energy loss. The sliding of particles following a collision leads to an energy dissipation rate that is times greater than dissipation from rolling friction. The time over which particles slide is typically relatively long, . Hence, the effective time over which a collision influences the dynamics of a particle is much longer than the actual contact time of [6]. After a pair of particles has stopped sliding, the momentum of their center of mass (in the lab frame) need not be the same as the before-collision value. These features have tremendous importance on dynamics of systems rolling on surfaces, but have been relatively little explored experimentally. However, recent related theoretical and numerical work has been conducted by Kondic[6].
The purpose of this paper is to examine in detail some important aspects of the dynamics of two-particle collisions which occur on a surface. We begin by briefly describing the measurement apparatus used to follow the particles’ motion, and then discuss the surface effects.
II Apparatus
The particles used were steel balls, which moved on a flat aluminum surface. The aluminum was black anodized to improve visual contrast between the steel spheres and the background. The apparatus was illuminated from nearly directly overhead; with this lighting, each metal sphere produced a single bright spot near its highest point due to the reflection of the overhead light. In order to track the centers of individual spheres over time, we used high speed video at rates of 250 frames per second. We then used particle tracking techniques to follow the particles. We began by finding the positions of the centers of all particles within a video frame, identified by the brightest points in the image (the local maxima in the brightness field). Although there were some secondary reflections between neighboring balls, these reflections were much less bright than the primary reflections, and they could be eliminated easily. By following the positions of individual particles from frame to frame, we obtained trajectories, velocities, and other time-varying quantities of interest.
III Particle-substrate dynamics
A Rolling friction
The simplest effect of motion on a substrate is rolling friction, and we consider this effect first. The frictional force from a single sphere rolling on a substrate is usually modeled by
| (1) |
where is the normal force at the sphere-substrate contact and is the coefficient of rolling friction.
We have carried out measurements of the frictional force on a single steel sphere rolling on the aluminum substrate described above. The sphere was tracked as described in Section II. We determined its acceleration by dividing the change in velocities between two frames by the time between the frames; the resulting acceleration versus velocity is shown in Fig. 1. The solid line in the figure corresponds to a least-squares linear fit to the data. We see that the rolling friction for this system is velocity dependent, with higher frictional force at higher velocity. This tends, in principle, to make velocities in rolling granular systems become more uniform. To a reasonable approximation, the acceleration due to rolling friction which a particle experiences is , where and . Using , with a typical acceleration of , we find that , which is comparable to that reported by Kudrolli [4] for steel balls rolling on a Delrin surface.
B Sliding friction
While this rolling friction has a dissipative effect over long times, there is another, stronger, mechanism for energy loss to the substrate: sliding friction. We find that sliding friction with the substrate immediately after a collision plays a particularly important role in the system dynamics. In order to investigate this effect, we consider the collision of two particles on a substrate. We first review the textbook example of two particles colliding in free space, which we assume is two-dimensional, and then compare this to experimental observations when the motion occurs on a substrate.
In the standard case of two inelastic frictionless particles colliding in free space, i.e. with no substrate, the collision is described by conservation of momentum and by an energy loss given through the coefficient of restitution, . We introduce the following notation to describe this process. The initial momenta of the two particles are given by and , the final momenta by and , and . The direction of the vector connecting the centers of mass of the two particles at the time of the collision is . The relative velocity of the particles in the direction after colliding is a fraction of their initial relative velocity, while the relative velocity tangential to is a fraction of its initial value. Thus,
| (2) | |||||
| (3) | |||||
| (4) |
where the subscripts and refer to the directions parallel and perpendicular to , respectively. We take , the simplest case describing an inelastic collision.
This model is usually used in modeling granular systems[7, 8]. However, it does not accurately reflect the dynamics of two rolling particles colliding on a surface. When two rolling particles collide, there are three contact points: each particle with the substrate, and the particles with each other. In general, these contact points are frictional. This leads to rotational frustration and, after the collision, to sliding[6]. The following simple argument shows why the particles are likely to slide on the substrate following a collision. During a collision the frictional force between the particles competes with the frictional forces between the particles and the substrate. If the static friction coefficients at all contacts are comparable, the frictional force will be greatest where the contact forces are greatest. The interparticle contact force is , where is the momentum change of a particle and [6] is the contact time for a hard-particle collision. The contact force for a particle with the substrate is , and the ratio . Thus for hard metal spheres defines a crossover velocity, with sliding on the substrate occuring for . If sliding has been initiated in the collision, a finite time and distance is required after the spheres separate before dynamic (sliding) friction slows the spheres’ sliding motion. They will eventually reach a point where sliding stops and the particles are simply rolling. During this time, both the direction and the speed of the particles change significantly, as detailed below.
We have investigated this effect experimentally by rolling one ball at an identical stationary ball, and by tracking their motion before and after the collision. Fig. 2 shows a typical set of trajectories in such a two-particle collision. The moving ball (in the lab frame) enters from the left of the image, hitting the stationary ball. Since it is difficult to produce a perfectly head-on collision, the incoming ball strikes the stationary ball slightly off-center. Immediately after the collision the two balls behave almost as though there were no surface interactions (see inset). Somewhat later, the particles begin to show the influence of the substrate as they change direction and speed.
During the time between the collision and the time when the balls begin rolling without sliding, both the direction and the speed of the balls change due to sliding. This is shown in Fig. 3, which gives the distance between the two balls shown in Fig. 2 over time. The collision occurs at . For times before and well after the collision, the separation varies nearly linearly with time, indicating that the balls roll with nearly constant velocity in these periods. By contrast, during the immediately following the collision, the interparticle separation varies nonlinearly in time. This indicates a regime in which the two particles experience dynamic, or sliding, friction with the substrate. We denote the time following the collision at and before the particles start rolling without sliding at as the “relaxation time,” . We define as the time at which the particles’ centers of mass are closest together, and as the point in time after the collision at which a particle begins moving with nearly constant velocity. was typically in the systems we studied, which is very large compared to the time the particles are in contact, roughly [6]. After a period of time equal to has elapsed, each particle has nearly constant velocity, affected only by rolling friction.
From collision data we can determine the coefficient of restitution , as defined in Eq. 3 by examining the velocities immediately preceeding and after the collision, but before sliding friction has had significant effects. Fig. 4 gives a histogram of data obtained for a number of measurements of obtained this way. To produce these results, we measured velocities immediately before and within seconds after the collision. We find an average value of the coefficient of restitution to be , with no obvious dependence on the velocity of incoming particle. This value is similar to the value of reported by others for steel-on-steel collisions: in ref. [4] and in ref. [9].
Immediately after the collision, the relative angle of the particles’ new directions is also close to what one would expect for an elastic collision between two equal-sized spherical particles with one initially at rest. Fig. 5 shows a typical example. In a collision between two identical spheres of radius , with coefficient of restitution and impact parameter , the angle between the directions of the spheres’ motion after the collision is given by
| (5) |
Then as , a perfectly elastic collision, and , provided that . A typical value of the impact parameter in these experiments is . The collision in Fig. 5 occurs at time , indicated by the vertical dotted line; at this time, the relative angle between the particle velcities is near . As sliding friction begins to affect the particles and they are accelerated or decelerated, the angle between the velocities decreases. The direction of the acceleration is discussed in detail below, in Sec. III D.
Kondic has investigated a model for two particles colliding on a surface that includes both the interaction between the particles via a collision and the interaction of the particles with the substrate through friction [6]. For a system consisting of a moving particle hitting a stationary particle head-on, he predicts velocities and relaxation times of each particle after the collision. If the initial velocity of the moving particle is , the final (i.e. purely rolling) velocities of the initially stationary and initially moving particles are and respectively, and the relaxation times of the initially stationary and initially moving particles are and respectively, then:
| (6) | |||||
| (7) | |||||
| (8) | |||||
| (9) |
where is the coefficient of restitution of the particles, is the coefficient of kinetic friction of the particles with the substrate, is the acceleration of gravity, and is the moment of inertia of the particles (). is a measure of the transfer of angular momentum between the particles during the collision, such that immediately after the collision
| (10) | |||||
| (11) |
where , for , is the angular velocity of each particle and is the angular velocity of the incoming particle before the collision.
We fitted data for experimentally determined final velocities and versus and relaxation times and versus to these predictions by minimizing the squared deviation of the model from observed data. Specifically, we minimized
| (13) | |||||
with fitting parameters , , and . Here represents the experimental uncertainty in the variable . We found that , , and in our experiments. Note that this result for the coefficient of restitution is consistent with, but much more precise than, the value of determined from Fig. 4. Results of these fits can be seen in Fig. 6 and Fig. 7.
We conclude that for a two-particle collision on a substrate, the picture of an instantaneous normal coefficient of friction is inaccurate, and may not be particularly useful. Without surface interactions, the relaxation times are and the final velocities are and (represented by the dotted lines in Fig. 7).
C Energy loss
For many-particle systems, important indicators of the properties of the collision are the net energy and momentum losses of the system. Thus we now turn our attention to them. By the time the particles have reached the point of rolling without sliding, there has been an energy loss much greater than that which would occur in a system described only by a standard coefficient of restitution. For two particles undergoing a collision described by a conventional coefficient of restitution, as in Eq. 3, the maximum fractional energy loss, which occurs in a head-on collision, is . For steel balls, with , . For collisions that are not head-on, the energy losses are smaller, as only the component of velocity normal to the collision decreases, assuming the tangential coefficient of restitution equals 1. Figure 8 shows the total system energy versus time for the two-particle collision described above. Figure 9 shows the fractional energy remaining in the system at the end of the relaxation time for a series of collisions as a function of the final angle between the velocities. For a head-on collision the system’s energy after the collision is on average of the energy before the collision, representing a loss of of system energy as the result of a single collision. Also shown in Fig. 9 is a prediction based on Eqs. 6-9 (solid line) with the parameters determined in the fit discussed above. The dashed line represents energy loss in a system with and no surface interactions. The observed energy loss is only weakly dependent on the collision angle for nearly head-on collisions.
D Momentum loss and the direction of sliding frictional forces
We note that the direction of force due to sliding friction is not necessarily parallel to the contact normal, ; instead, it is in the direction of the relative velocity of the contact between the substrate and the bottom of the particle, which we call the contact velocity . Thus,
| (14) |
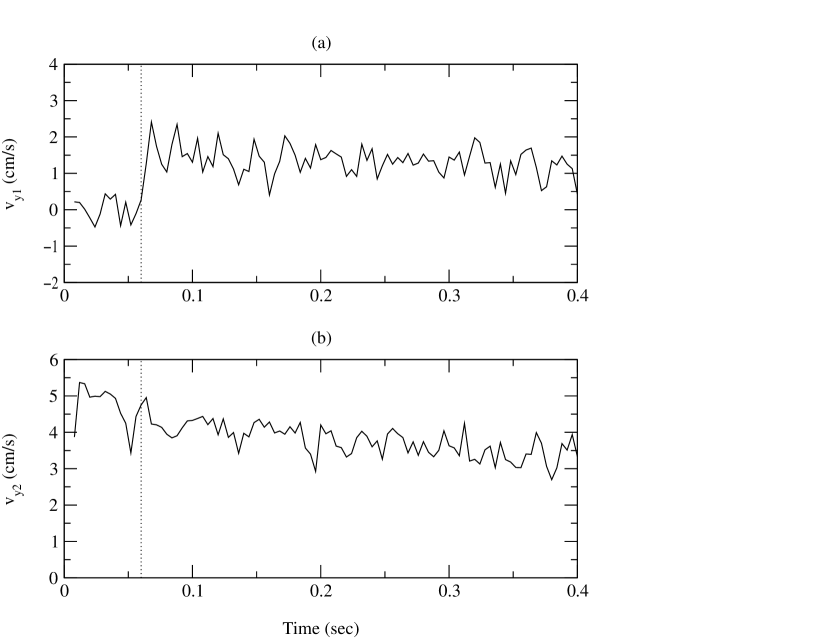
where is the velocity of the center of mass of the particle, is the vector from the contact point to the center of the particle, and is the particle’s angular velocity. A sketch is provided in Fig. 10. Here, we define the direction as , and the direction as . All momentum loss to the substrate will occur in the direction, as this is the direction of the only force acting on the particle (neglecting rolling friction, which is small compared to sliding friction). We experimentally determine the direction by finding the direction in which a particle’s velocity changes following a collision. Figures 11 and 12 show the momenta of the individual particles versus time in the collision described above, in the (Fig. 11) and (Fig. 12) directions. Note that the and directions are independently defined for each of the particles, i.e. for the initially moving particle is different from for the initially stationary particle. Figure 11 illustrates the finite time after the collision (the collision time is marked by a vertical dotted line) for which momentum is transferred to the substrate through sliding friction. After this time, the only momentum loss is due to rolling friction. In Fig. 12 we observe that no momentum is lost in the direction for either particle after the collision, aside from a slow loss due to rolling friction.
We also examine the net momentum loss in the direction of the initial momentum versus the final angle between the particle velocities (Fig. 13). Note that in the usual case, with no surface interactions, no momentum is lost, so for all angles. In contrast, for a head-on collision with surface interactions we see that of is lost. Further, we note that this quantity is weakly dependent on the final angle between the velocities after the collision for small angles. The solid line in this figure shows the prediction based on Eqs. 6-9, with the parameters determined above.
This momentum loss may be important in many-particle systems. For example, inelastic collapse, a condition in which there are an infinite number of collisions in a finite time, occurs in one- and two-dimensional idealized systems [10, 11]. One-dimensional numerical simulations by Dutt [12] show that if even a very small momentum loss per collision is introduced, inelastic collapse does not occur. This suggests that inelastic collapse cannot be observed in experimental granular systems which interact with a surface.
IV Angular velocity
We would also like to determine the angular velocities of the particles immediately after the collision. These are difficult to measure directly, but we can derive expressions for them from Eq. 14, given the assumption that after sliding stops each particle will be rolling without sliding. Then the angular velocity of a particle immediately after the collision, , is
| (15) |
and
| (16) |
where is the change of the center of mass velocity in the direction due to sliding forces, is the center of mass velocity immediately following the collision, and . Since we can directly measure the center of mass velocity at all times, we can deduce the values of and .
These calculations determine the components of in the and directions, as defined in Sec. III D. These directions are defined by the sliding frictional forces acting on the particles; a more natural coordinate system when examining the effect of the collision itself on angular velocities is defined by the and directions, that is, parallel () and perpendicular () to the vector connecting the centers of mass of the particles at the time of the collision. If surface effects are negligible during the collision, there is no torque in the direction, so we expect that for each particle will not be changed by the collision. Indeed, we find that during the collision the mean change of the angular velocity in the direction, averaged over 50 particles and normalized by the angular velocity of the incoming particle in each case, is . In contrast, we expect that during the collision, some angular momentum will be transferred from the moving particle to the stationary particle in the direction. The amount of angular velocity transferred can be quantified by Eq. 11; we find from these calculations that . This is similar to, although slightly smaller than, the value of obtained from the fit to Eqs. 6-9 above.
V Conclusion
In two-dimensional granular systems, understanding interactions with the substrate is crucial to understanding the system dynamics. As two particles collide, there is rotational frustration between them and the substrate, leading to sliding on the surface. The large contact force between the particles at the time of the collision is much greater than gravity, with , guaranteeing that particles will slide on the substrate after the collision. The resulting sliding friction leads to high energy losses and can be modeled simply, as discussed by Kondic [6]. In fact, we find that up to of the incoming energy is lost in a single collision between two particles with coefficient of restitution of , and most of this is due to sliding friction with the substrate. The sliding continues for a time, , which is long relative to the collision time. is comparable to or longer than the time between collisions for moderately dense, rapidly cooling systems, which means that sliding is experimentally important for many-particle systems until typical velocities reach . Additionally, we find that both momentum and angular momentum are typically lost to the substrate following a collision.
REFERENCES
- [1] Heinrich M. Jaeger, Sidney R. Nagel, and Robert P. Behringer. Granular solids, liquids, and gases. Rev. Mod. Phy., 68:1259, 1996.
- [2] C. S. Campbell. Annu. Rev. Fluid Mech., 22:57, 1990.
- [3] I. Goldhirsch and G. Zanetti. Clustering instability in dissipative gases. Phys. Rev. Lett., 70:1619, 1993.
- [4] A. Kudrolli, M. Wolpert, and J. P. Gollub. Cluster formation due to collisions in granular material. Phys. Rev. Lett., 78:1383, 1997.
- [5] S. Tennakoon and R. P. Behringer. (to be published).
- [6] Ljubinko Kondic. Dynamics of spherical particles on a surface: Collision-induced sliding and other effects. Phys. Rev. E, 60:751, 1999.
- [7] E. L. Grossman, Tong Zhou, and E. Ben-Naim. Towards granular hydrodynamics in two dimensions. Phys. Rev. E, 55:4200, 1997.
- [8] I. Goldhirsch, M.-L. Tan, and G. Zanetti. A molecular dynamical study of granular fluids I: The unforced granular gas in two dimensions. J. Sci. Comp., 8:1, 1993.
- [9] S. Luding, E. Clement, A. Blumen, J. Rajchenbach, and J. Duran. Studies of columns of beads under external vibrations. Phys. Rev. E, 49:1634, 1994.
- [10] Sean McNamara and W. R. Young. Inelastic collapse and clumping in a one-dimensional granular medium. Phys. Fluids A, 4:496, 1992.
- [11] Sean McNamara and W. R. Young. Inelastic collapse in two dimensions. Phys. Rev. E, 50:R28, 1994.
- [12] M. Dutt and R. P. Behringer. (to be published).