Classes of behavior of small-world networks
Abstract
Small-world networks are the focus of recent interest because they appear to circumvent many of the limitations of either random networks or regular lattices as frameworks for the study of interaction networks of complex systems. Here, we report an empirical study of the statistical properties of a variety of diverse real-world networks. We present evidence of the occurrence of three classes of small-world networks: (a) scale-free networks, characterized by a vertex connectivity distribution that decays as a power law; (b) broad-scale networks, characterized by a connectivity distribution that has a power-law regime followed by a sharp cut-off; (c) single-scale networks, characterized by a connectivity distribution with a fast decaying tail. Moreover, we note for the classes of broad-scale and single-scale networks that there are constraints limiting the addition of new links. Our results suggest that the nature of such constraints may be the controlling factor for the emergence of different classes of networks.
Disordered networks, such as small-world networks are the focus of recent interest because of their potential as models for the interaction networks of complex systems [1, 2, 3, 4, 5, 6]. Specifically, neither random networks nor regular lattices appear to be an adequate framework within which to study “real-world” complex systems [7] such as chemical-reaction networks [8], neuronal networks [1], food-webs [9, 10, 11], social networks [12, 13, 14], scientific-collaboration networks [15], and computer networks [4, 16, 17].
Small-world networks [1, 2] —which emerge as the result of randomly replacing a fraction of the links of a -dimensional lattice with new random links— interpolate between the two limiting cases of a regular lattice () and a random graph (). A “small-world” network is characterized by the properties (i) the local neighborhood is preserved —as for regular lattices [1, 2]—, and (ii) the diameter of the network, quantified by average shortest distance between two vertices [18], increases logarithmically with the number of vertices —as for random graphs [19]. The latter property gives the name “small-world” to these networks, as it is possible to connect any two vertices in the network through just a few links while the local connectivity would suggest the network to be of finite dimensionality.
The structure of small-world networks and of real networks has been probed through the calculation of their diameter as a function of network size [1]. In particular, networks such as (a) the electric-power grid for Southern California, (b) the network of movie-actor collaborations, and (c) the neuronal network of the worm C. Elegans, appear to be small-world networks [1]. Further, it was proposed [5] that these three networks, the world-wide web [4], and the network of citations of scientific papers [20, 21] are scale-free —that is, they have a distribution of connectivities that decays with a power-law tail.
Scale-free networks emerge in the context of a growing network in which new vertices connect preferentially to the more highly connected vertices in the network [5]. Scale free networks are still small-world networks because (i) they have clustering coefficients much larger than random networks [1, 2], and (ii) their diameter increases logarithmically with the number of vertices [5].
Here, we address the question of the conditions under which disordered networks are scale-free through the analysis of several networks in social, economic, technologic, biologic, and physical systems. We identify a number of systems for which there is a single scale for the connectivity of the vertices. For all these networks there are constraints limiting the addition of new links. Our results suggest that such constraints may be the controlling factor for the emergence of scale-free networks.
First, we consider two examples of technologic and economic networks: (i) the electric-power grid of Southern California [1], the vertices being generators, transformers and substations and the links high-voltage transmission lines, and (ii) the network of world airports [22], the vertices being the airports and the links non-stop connections. Figure 1 shows the connectivity distribution for these two examples. It is visually apparent that neither case has a power-law regime, and that both have exponentially decaying tails, implying that there is a single scale for the connectivity .
Second, we consider three examples of “social” networks: (iii) the movie-actors network [1], the links in this network indicating that the two actors were cast at least once in the same movie, (iv) the acquaintance network of Mormons [23], the vertices being 43 Utah Mormons and the number of links the number of other Mormons they know, and (v) the friendship-network of 417 Madison Junior High School students [24]. Figure 2 shows the connectivity distribution for these social networks. The scale-free (power-law) behavior of the actor’s network [5] is truncated by an exponential tail. In contrast, the network of acquaintances of the Utah Mormons and the friendship network of the high-school students display no power-law regime, but instead we find results consistent with a Gaussian distribution of connectivities, indicating the existence of a single scale for .
Third, we consider two examples of networks from the natural sciences: (vi) the neuronal network of the worm C. Elegans [1, 25, 26], the vertices being the neurons and the links being connections between neurons, and (vii) the conformation space of a lattice polymer chain [27], the vertices being the possible conformations of the polymer chain and the links the possibility of connecting two conformations through local movements of the chain [27]. The conformation space of a protein chain shares many of the properties [27] of the small-world networks of Ref. [1]. Figures 3a,b show for C. Elegans the cumulative distribution of for both incoming and outgoing neuronal links. The tails of both distributions are well approximated by exponential decays, consistent with a single scale for the connectivities. For the network of conformations of a polymer chain the connectivity follows a binomial distribution, which converges to the Gaussian [27], so we also find a single scale for the connectivity of the vertices (Fig. 3c).
Thus, there is empirical evidence for the occurrence of three classes of small-world networks: (a) scale-free networks, characterized by a connectivity distribution with a tail that decays as a power law [4, 20, 21]; (b) broad-scale or truncated scale-free networks, characterized by a connectivity distribution that has a power-law regime followed by a sharp cut-off, like an exponential or Gaussian decay of the tail [see example (iii)]; (c) single-scale networks, characterized by a connectivity distribution with a fast decaying tail, such as exponential or Gaussian [see examples (i),(ii),(iv-vii)].
A natural question is “What are the reasons for such a rich range of possible structures for small-world networks?” To answer this question let us recall that preferential attachment in growing networks gives rise to a power-law distribution of connectivities [5]. However, preferential attachment can be hindered by two classes of factors: (I) aging of the vertices. This effect can be pictured for the network of actors: in time, every actress or actor will stop acting. For the network, this fact implies that even a very highly connected vertex will, eventually, stop receiving new links. The vertex is still part of the network and contributing to network statistics, but it no longer receives links. The aging of the vertices thus limits the preferential attachment preventing a scale-free distribution of connectivities. (II) cost of adding links to the vertices or the limited capacity of a vertex. This effect is exemplified by the network of world airports: for reasons of efficiency, commercial airlines prefer to have a small number of hubs where all routes would connect. To first approximation, this is indeed what happens for individual airlines, but when we consider all airlines together, it becomes physically impossible for an airport to become a hub to all airlines. Due to space and time constraints, each airport will limit the number of landings/departures per hour, and the number of passengers in transit. Hence, physical costs of adding links and limited capacity of a vertex [28, 29] will limit the number of possible links attaching to a given vertex.
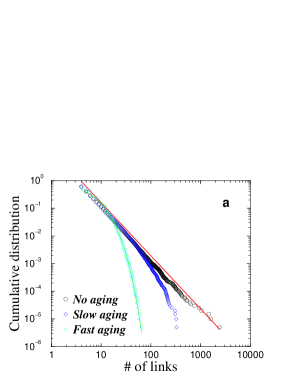
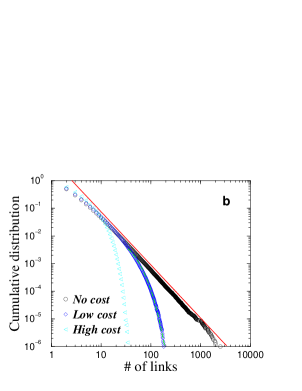
To test numerically the effect of aging and cost constraints on the local structure of networks with preferential attachment, we simulate the scale-free model of Ref. [5] but introduce aging and cost constraints of varying strength. Figure 4 shows that both types of constraints lead to cut-offs on the power-law decay of the tail of connectivity distribution and that for strong enough constraints no power-law region is visible.
We note that the possible distributions of connectivity of the small-world networks have an analogy in the theory of critical phenomena [30]. At the gas-liquid critical point, the distribution of sizes of the droplets of the gas (or of the liquid) is scale-free, as there is no free-energy cost in their formation [30]. As for the case of a scale-free network, the size of a droplet is power-law distributed: . As we move away from the critical point, the appearance of a non-negligible surface tension introduces a free-energy cost for droplets which limits their sizes, so that their distribution becomes broad-scale: , where is the typical size for which surface tension starts to be significant and the function introduces a sharp cut-off for droplet sizes . Far from the critical point, the scale becomes so small that no power-law regime is observed and the droplets become single-scale distributed: . Often, the distribution of sizes in this regime is exponential or Gaussian.
We thank J.S. Andrade Jr., R. Cuerno, N. Dokholyan, P. Gopikrishnan, C. Hartley, E. LaNave, K.B. Lauritsen, H. Orland, F. Starr and S. Zapperi for stimulating discussions and helpful suggestions. The Center for Polymer Studies is funded by NSF.
REFERENCES
- [1] D. J. Watts and D. H. Strogatz, Nature 393, 440 (1998).
- [2] D. J. Watts., Small Worlds: The Dynamics of Networks Between Order and Randomness (Princeton Reviews in Complexity) (Princeton University Press, Princeton, New Jersey, 1999).
- [3] M. Barthélémy and L.A.N. Amaral, Phys. Rev. Lett. 82, 3180 (1999).
- [4] R. Albert, H. Jeong, and A.-L. Barabási, Nature 401, 130 (1999).
- [5] A.-L. Barabási and R. Albert, Science 286, 509 (1999).
- [6] L. F. Lago-Fernandez, R. Huerta, F. Corbacho, and J. A. Siguenza, cond-mat/9909379.
- [7] M. Kochen, ed., The Small World (Ablex, Norwood, NJ, 1989).
- [8] U. Alon, M. G. Surette, N. Barkai, and S. Leibler, Nature 397, 168 (1999).
- [9] S. L. Pimm, J. H. Lawton, and J. E. Cohen, Nature 350, 669 (1991).
- [10] R. T. Paine, Nature 355, 73 (1992).
- [11] K. McCann, A. Hastings, and G. R. Huxel, Nature 395, 794 (1998).
- [12] S. Wasserman and K. Faust, Social Network Analysis (Cambridge university Press, Cambridge, 1994).
- [13] R. Axtell, J. S. Dean, G. J. Gumerman, and J. Epstein, in Gumerman, G.J. and Kohler, T., Modeling Small-Scale Societies (Santa Fe Institute, Santa Fe, 1999).
- [14] R. Axtell, in Aaron, H.J., Behavioral Dimensions of Retirement Economics (1999).
- [15] A. F. J. Van Raan, Nature 347, 626 (1990).
- [16] B. A. Huberman, P. L. T. Pirolli, J. E. Pitkow, and R. J. Lukose, Science 280, 95 (1999).
- [17] B. A. Huberman and L. A. Adamic, Nature 401, 131 (1999).
- [18] J. van Leeuwen, ed., Handbook of Theoretical Computer Science. Volume A: Algorithms and Complexity (Elsevier, Amsterdam, 1990).
- [19] B. Bollobás, Random Graphs (Academic Press, London, 1985).
- [20] P. O. Seglen, J. Am. Soc. Inf. Sci. 43, 628 (1992).
- [21] S. Redner, Eur. Phys. J. 4, 131 (1998).
- [22] ACI Annual Worldwide Airports Traffic Reports (Airport Council International, Geneva, 1999). [http://www.airports.org]
- [23] H. R. Bernard, P. D. Kilworth, M. J. Evans, C. McCarty, and G. A. Selley, Ethnology 1, 155 (1998).
- [24] T. J. Fararo and M. H. Sunshine, A Study of a Biased Friendship Net (Syracuse University Press, Syracuse NY, 1964).
- [25] J. G. White, E. Southgate, J. N. Thomson, and S. Brenner, Phil. Trans. R. Soc. London Ser. B 314, 1 (1986).
- [26] C. Koch and G. Laurent, Science 284, 96 (1999).
- [27] A. Scala, L. A. N. Amaral, and M. Barthélémy, (To be published.)
- [28] M. E. Bonney, in J. L. Moreno, Sociometry and the Science of Man (Beacon House, New York, 1956), p. 275.
- [29] J. L. Moreno, Sociometry and the Science of Man (Beacon House, New York, 1956).
- [30] H. E. Stanley, Introduction to phase transitions and critical phenomena (Oxford University Press, Oxford, 1971).
FIGURE 1
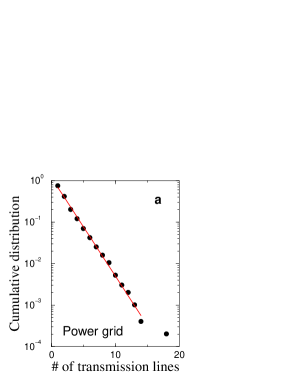
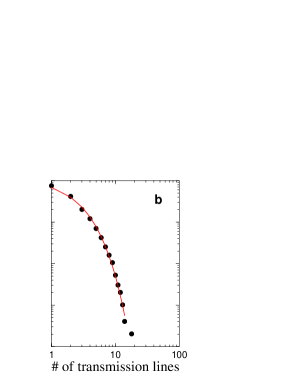
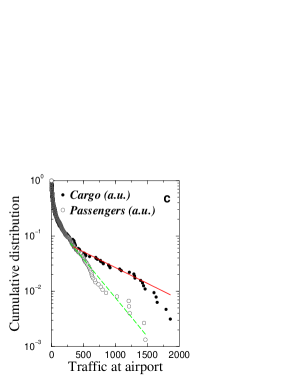
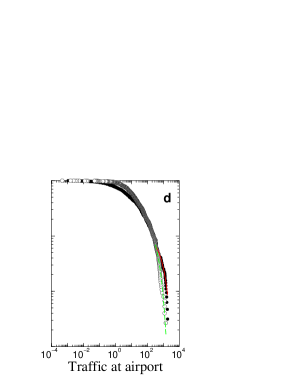
FIGURE 2
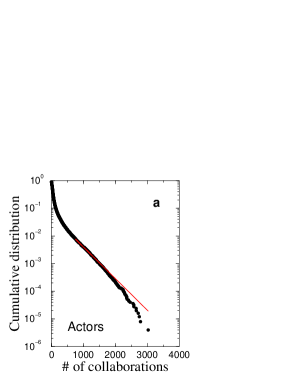
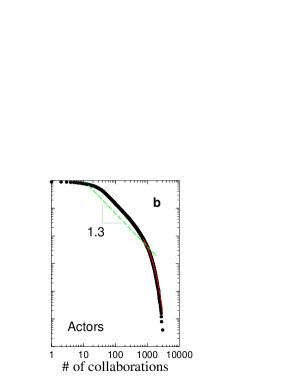
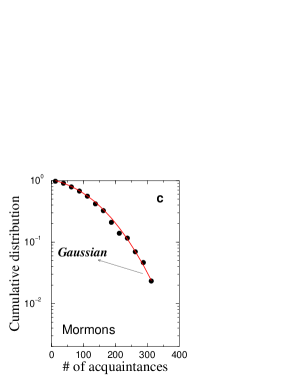
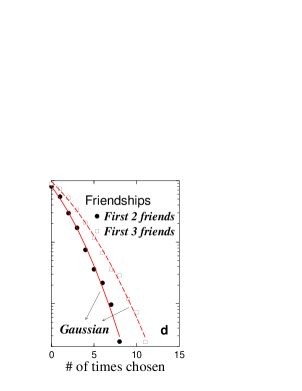
FIGURE 3
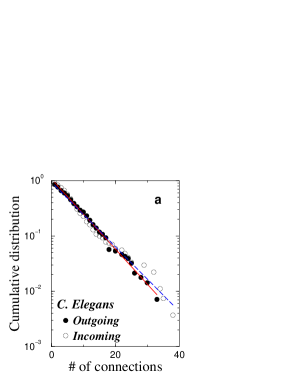
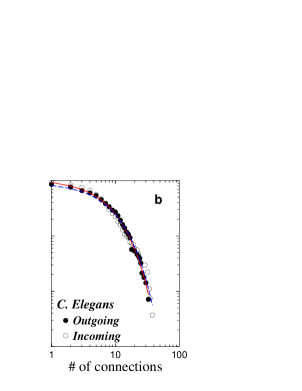
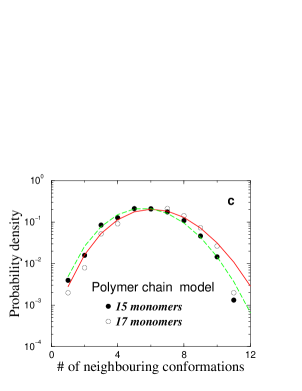
FIGURE 4