Submonolayer epitaxy with impurities
I Introduction
Recent progress in the fabrication of atomically smooth interfaces by Molecular Beam Epitaxy (MBE) has lead to an increasing appreciation of the dramatic, detrimental or beneficial, effects that small amounts of impurities may have on the morphology of growing films. Adsorbates acting as surfactants can stabilize layer-by-layer growth of metal [1, 2, 3, 4, 5, 6] and semiconductor [7, 8] surfaces. On the other hand, for the simple case of Pt(111) homoepitaxy it was recently shown [9] that minute coverages of CO strongly increase the step edge barriers for interlayer transport, thus enhancing three-dimensional mound growth.[10] The effect of additional surface species on growth and nucleation is of obvious importance also in more complex, technologically relevant deposition techniques such as chemical vapor deposition.[11] In either case the detailed atomistic kinetics and energetics of the interaction between adsorbate and deposited material influence the growth mode to a degree which makes it very difficult to formulate general rules for large classes of growth systems.
As a first step towards an improved understanding of the generic effects of impurities on epitaxial growth, in the present paper we introduce a minimal model which, we hope, is simple enough to extract some insights of fairly general validity, and yet possesses sufficient flexibility to include most physically relevant microscopic features. The model is based on the standard solid-on-solid description for the growth of a simple cubic crystal.[12, 13] The impurities are represented by a second particle species, which can be codeposited with the growing material or predeposited prior to growth. Impurities diffuse and interact attractively with the deposit atoms (adatoms), but they do not attract each other and hence do not nucleate islands. The details of the model are described in Section II. A brief account of some preliminary results was given in an earlier communication.[14]
Despite its simplicity, the model contains a large number of parameters: impurity and growth fluxes, substrate temperature, and energy barriers for half a dozen kinetic processes. To focus our efforts, we concentrate on modeling a situation in which the impurities decorate the island edges, forming a monatomic chain along the island perimeter. Preferential adsorption of impurities at step edges is suggested by bond counting arguments, and has often been invoked to explain the strong effect of submonolayer adsorbate coverages on growth behavior, e.g., through a change of the barrier for interlayer transport.[1, 9, 15]
It will be shown in Section III that the growth of decorated islands requires, in addition to a suitable choice of binding energies, the possibility of impurity-adatom exchange. Such a process, which is a two-dimensional analog of the exchange mechanism responsible for the floating of surfactants in multilayer growth,[6] was recently demonstrated to play a crucial role in the submonolayer homoepitaxy of Si(001) in the presence of hydrogen.[16]
In Section IV the influence of the adsorbates on the island density is investigated, both for codeposited and predeposited impurities. In the absence of impurities the scaling relation
| (1) |
between island density , deposition flux and adatom diffusion coefficient is well established theoretically,[17, 18, 19] numerically [19, 20, 21, 22, 23] and experimentally.[24] In two dimensions, rate equation analysis [17, 18, 19, 20, 21] yields the expression
| (2) |
for the exponent in terms of the size of the largest unstable cluster.
There are several conceivable mechanisms by which attractive impurities [25] could alter the relationship (1). First, impurities may act as nucleation centers, thus effectively decreasing and therefore ; in the extreme case of immobile adatom traps the limit of spontaneous nucleation with would be realized.[23, 26] Second, impurities decorating the island edges may induce energy barriers to attachment. Kandel [27] has shown that, provided these barriers are sufficiently strong, the exponent in (1) is increased such that (2) is replaced by . Both mechanisms imply an increase of the island density compared to the case of pure homoepitaxy.
Our simulations indicate that none of these two mechanisms are operative under the conditions used in our model: The addition of impurities is found to increase the island density in all cases, but the scaling of with the flux remains unaffected within the accuracy of the simulation. An analysis of the relevant microscopic processes [14] reveals that, within our model, even completely decorated island edges do not provide efficient barriers to attachment, and therefore the scenario of Kandel [27] does not apply.
In view of (1), an increase of the island density at fixed suggests that the main effect of the impurities is to reduce the mobility of adatoms. The reduction of the adatom mobility has been identified as the most important mechanism contributing to the surfactant action of Sb on Ag.[3, 4, 28] Decreasing reduces the island size and favors the growth of ramified, rather than compact islands. Both effects enhance interlayer transport, since the adatoms landing in the second layer have more opportunities to descend, and thus promote layer-by-layer growth. In our model the island size decreases but the island shapes remain compact, because the edge decoration facilitates edge diffusion (see Section III).
For an analytic description of the relation between impurity coverage, adatom mobility and island density, in Section V we develop a simple rate equation approach which provides a semi-quantitative explanation for many (though not all) features observed in the simulations. Some conclusions and open questions are formulated in Section VI.
II Model
The growth model employed in this work has been briefly described in an earlier paper.[14] It is a solid-on-solid model with two surface species and , where -particles correspond to the growing material, and -particles represent the impurities. The simulation starts on a flat substrate composed only of -atoms. The basic microscopic processes are deposition and migration; desorption is not allowed. Two deposition modes are considered: (i) simultaneous deposition (codeposition) of both species and (ii) predeposition of a certain impurity coverage prior to growth. In the case of codeposition the fluxes and of the two species may differ.
The migration of a surface atom is modeled as a nearest–neighbor hopping process with the rate , where Hz is an adatom vibration frequency, is the hopping barrier, is the substrate temperature and is Boltzmann’s constant. The hopping barrier is the sum of a term from the substrate and a contribution from each lateral nearest neighbor . Both contributions depend on local composition: For each term we have the four possibilities , , and . The hopping barrier of an atom (of type or ) is then
| (3) |
where is the hopping barrier for a free adatom on a substrate atom , is equal to one if a substrate atom is of type and zero otherwise, is the number of nearest-neighbor - pairs, and is the corresponding contribution to the barrier (symmetric in and ). Lateral interactions between impurity atoms are neglected ().
In the simulations reported in this paper we used eV, eV, eV, eV, and the substrate temperature K. The low values of and ensure that atoms deposited on top of an impurity instantaneously descend to the substrate. Growth and impurity fluxes were varied in the interval ranging from 0.00025 ML/s to 0.25 ML/s. The system sizes ranged from 300300 to 500500. The nearest-neighbor coupling between -atoms controls [22] the size of the critical nucleus . It may be stronger () or weaker () than the coupling to the impurities. In equilibrium at low temperatures, the former case leads to the formation of islands composed inside mainly of atoms with atoms bounded near the edges, while in the latter case it is energetically more favorable when atoms are inside the islands.
However, our simulations show that growth leads to intermixing of and atoms in both cases, and . Thus the energetic bias favoring segregation is not sufficient to obtain configurations with impurities mostly at island edges (decorated islands). To achieve this, we have to introduce an additional thermally activated process, which allows an atom approaching an island to exchange with an impurity covering the island edge. A similar process was introduced previously [16] in the context of homoepitaxy on Si(001) with predeposited hydrogen. In that work, an -atom was allowed to exchange with an impurity provided the -atom was not bonded to another -atom at a nearest-neighbor site. In our case this modification turned out not to be sufficient, since impurities were still found to be progressively trapped inside islands during growth. We therefore allow the exchange of an atom with an impurity also when it has a single bond to another atom in a nearest-neighbor position. Using this rule, which is analogous to the exchange process invoked in the case of three-dimensional growth with surfactants,[8, 29] we obtain well decorated islands with impurities floating on the island edges during growth (Fig. 1b, and c), see Section III.
In principle, the rate of the exchange process could depend on the number of nearest-neighbor bonds (zero or one) of the -atom. We observed that the difference of both rates is not crucial provided both processes are active. The rates of these processes are taken as , where are the corresponding activation barriers. For both processes there is a maximum activation barrier above which the decorated geometry is not observed. In the following, the barriers for both types of exchange are for simplicity set to be equal.
III Island morphology
In Fig. 1 we show examples of typical configurations with the same partial coverage of both species ML (i.e., the total coverage ML) obtained by codeposition of adatoms and impurities with fluxes ML/s. Figures 1a, 1b, 1c illustrate the effect of varying the relation between and for eV. Several features can be identified. First, the island density increases with . This can be explained by the observation (cf. Fig. 1c for eV) that for larger , free -atoms start to be captured by impurities and many small islands containing impurities and a few atoms appear on the surface in addition to already existing decorated islands. These small islands act as nucleation centers that lead to the increase of the island density. For large , almost all impurities will capture an adatom for a certain time. As we argue in Section V, this effect causes reduction of adatom mobility by the impurities.
Whereas the island density increases, the density of free impurities decreases with increasing due to (i) the stronger - bond favoring the binding of impurities at island edges and (ii) the increase of the island density that leads to smaller islands with more perimeter sites. (Notice that we do not obtain decorated islands for simultaneous deposition at very large fluxes or at very early stages of growth since there are not enough impurities available to cover all perimeter sites.)
The degree of edge decoration also strongly depends on the value of . Edge decoration is not observed for small eV, it is only partial for eV, and it becomes perfect for eV (cf. Figure 1). Hence, in order to get decorated islands, the barrier has to be larger than a minimal value. A simple detailed balance argument [14] shows that the fraction of uncovered edge sites is given by
| (4) |
and thus at K a barrier of eV is required. As we shall see in Section V, the condition also implies that the diffusion of -atoms is slowed down considerably by the impurities.
Another important parameter determining decoration of island edges is the exchange barrier that was in our simulations varied from 0.8 eV to 2 eV. For a small value of , impurities are driven toward island edges, whereas for large , the exchange process is not active and impurities are often incorporated inside the islands. The impurities were observed to be floating on the island edges for small , both for (Fig. 1b) and for (Fig. 1c). Fig. 1d shows a configuration for eV in the case . The surface morphology is similar to the one observed for (not shown), where quite a regular checkerboard
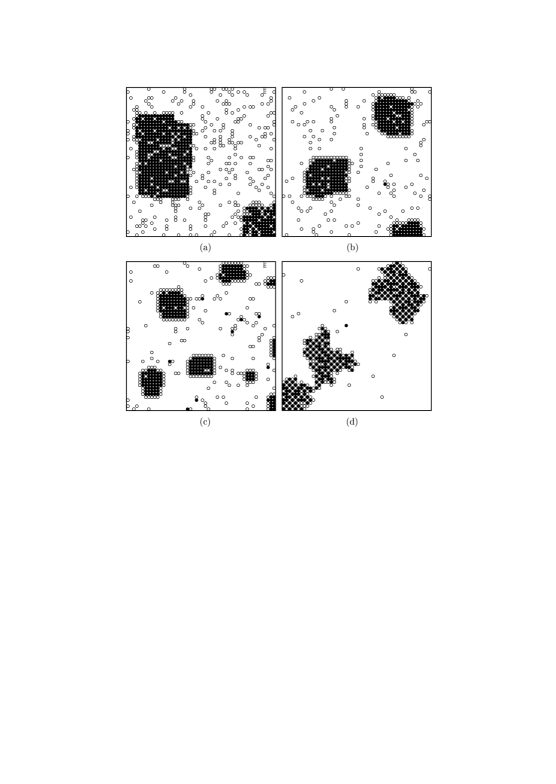
structure is produced with almost no free impurities on the surface. Thus in order to obtain decorated islands, has to be lower than a threshold value which in the present case is about 1.2 eV.
A further remarkable feature of the configurations displayed in Figure 1(b) and (c) is that the compact square island shape is maintained as the island density increases. In fact, careful inspection shows that the kink density on the well decorated edges is smaller than when the decoration is incomplete. This reflects the enhancement of edge diffusion by the impurities: The energy barrier for an adatom moving along the decorated step edge within the impurity layer is which, under the conditions of Figure 1(b),(c), is smaller than both the barrier for diffusion along an uncovered step and the barrier for edge diffusion on the outside of the impurity layer. Clearly this is true only if the exchange of singly bonded -atoms is allowed, which underlines the importance of this type of the exchange process.
IV Island density scaling
A Simultaneous growth
In the previous section, we described qualitatively the growth morphology for one fixed value of the deposition flux. Here we present results for the behavior of the island density as a function of flux and coverage , and discuss its dependence on the kinetic parameters. Results for each set of parameters were obtained by averaging over several independent simulation runs.
In the presence of impurities, islands are composed of both and atoms. We define the size of an island as the number of -atoms in a connected cluster of -atoms forming the island. This definition is appropriate for growth with impurities segregating on the edges of the islands. However, visual inspection of configurations showed that for , there exist islands containing several mutually disconnected clusters of -atoms. Hence, our definition cannot be applied straightforwardly for large . In the following, we restrict ourselves to situations where the intermixing inside the islands is negligible. Simulations for larger values of indicate that the flux dependence of the island density flattens (the exponent in (1) decreases), but due to the ambiguity in the definition of the island density in presence of intermixing, we did not attempt to assess the physical significance of this observation.
1 Flux dependence
Fig. 2 shows the island density as a function of the adatom flux for several coverages and different energy barriers and (inset). The energy barrier eV is fixed, and the impurities and adatoms are codeposited with the same flux . For comparison we also show data for homoepitaxial growth without impurities at two coverages ML and ML. We can see that for eV and eV, the island density is quite close to the corresponding value in homoepitaxy. With increasing interaction energy between adatoms and impurities, the island density dramatically increases, but the exponent in the power law relation (1) between flux and the island density remains nearly unchanged. For example, we find for , for , and for homoepitaxial growth, which means that the effective critical nucleus size is in this range of parameters. According to Kandel’s rate equation theory,[27] the scaling exponent should then become in the presence of strong barriers to attachment. In our model this is not observed, because the bonding of the adatoms to the impurity-covered edges keeps them near the edge long enough for an exchange to occur.[14, 30]
The inset of Fig. 2 shows that the island density is further increased if the exchange barrier is set to a larger value eV. The data for eV and indicate a slight decrease of the exponent .
Figure 3 shows results obtained by varying the ratio of impurity to adatom flux. In one set of simulations, using eV, the impurity flux was kept constant at ML/s, while the adatom flux was varied. For large fluxes , the island density


is seen to approach the data obtained for homoepitaxy, indicating that the impurities have no effect, while for small fluxes , the flux dependence is described by an effective power law with . An interpretation of this behavior will be given at the end of Section V B 2
In the second set of simulations shown in Figure 3, which were carried out using eV, both fluxes were varied keeping the ratio constant. This is seen to further increase the island density without changing the flux dependence. In this sense, an increase in the coverage of impurities (by increasing ) is equivalent to increasing their effectiveness through an increase of the bond energy . A quantitative formulation of this statement will be given in Section V.
2 Coverage dependence
A new feature in comparison with homoepitaxy is a stronger coverage dependence of the island density. This is seen in Fig. 2 for both weak ( eV) and strong ( eV) interaction with impurities, but it is more pronounced for strong interaction, in particular at larger fluxes. We followed the coverage dependence in more detail for fixed flux, and in addition to the island density we also measured the density of free adatoms . The results obtained at a medium flux ML/s are compared with homoepitaxy in Fig. 4. Both in impure growth and in homoepitaxy the island density shows an initial regime of rapid increase followed by a “saturation” regime in which it increases much more slowly with coverage. However, the residual coverage dependence in

the saturation regime is stronger in the presence of impurities, and furthermore the onset of the saturation regime is delayed as the interaction between adatoms and impurities increases. A quantitative description of this effect will be provided in Section V B 2.
The density of adatoms exhibits a completely different behavior as compared to homoepitaxy. We observe that for growth with impurities, the adatom density is comparable with the island density up to the coverage ML, whereas in homoepitaxy the adatom density rapidly decreases after reaching a maximum at the beginning of the saturation regime (cf. Section V A). Other surprising features are the power-law increase observed over almost two decades in the case of strongly interacting impurities, and the weak oscillations of the adatom density for coverages (cf. Fig. 4). We will return to the behavior of the adatom density in Section V B 2.
3 Next-nearest-neighbor interaction
A modification of the model in which the barrier for diffusion contains an additional contribution from each lateral next-nearest neighbor of the opposite type was also studied. This implies that a term is added to the right hand side of Eq. (3). Here is the number of next-nearest neighbors of the type opposite to the atom under consideration, and is the corresponding contribution to the activation barrier. We do not consider next-nearest-neighbor contributions from pairs of particles of the same type. For simplicity, the new parameter is set equal to .
Our motivation for introducing the additional term is a desire to study an improvement in the decoration of island edges by impurities, and the resulting decrease of the fraction of uncovered edge sites. The additional interaction also enhances the probability of nucleation around impurities because the number of sites at which an adatom can be captured is considerably higher. The configuration shown in Fig. 5a demonstrates that now we obtain almost perfect decoration also for eV. Fig. 5b illustrates the nucleation of small islands.
For eV, the island density is nearly the same as for homoepitaxy for all fluxes studied, and decoration is perfect provided there is sufficient amount of impurities available. This shows that also in the presence of next-nearest-neighbor interactions the decorated
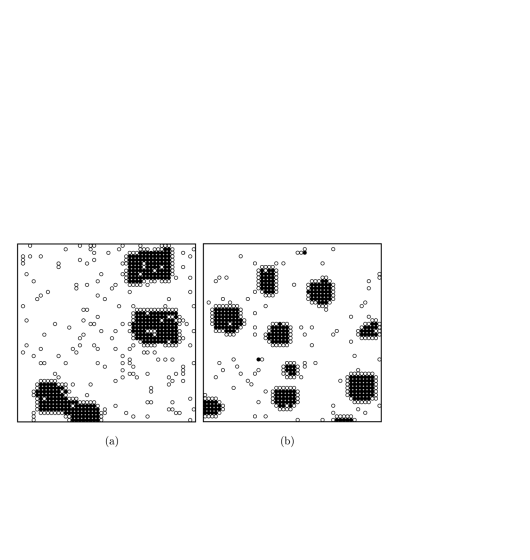
edges are unable to block efficiently the attachment of adatoms. For larger values of , the additional interaction causes an increase of the island density and a decrease of the scaling exponent . For example, the effective value for eV is and for eV it drops to . This suggests that the nucleation of small islands described above effectively lowers the size of the critical nucleus.
B Predeposition of impurities
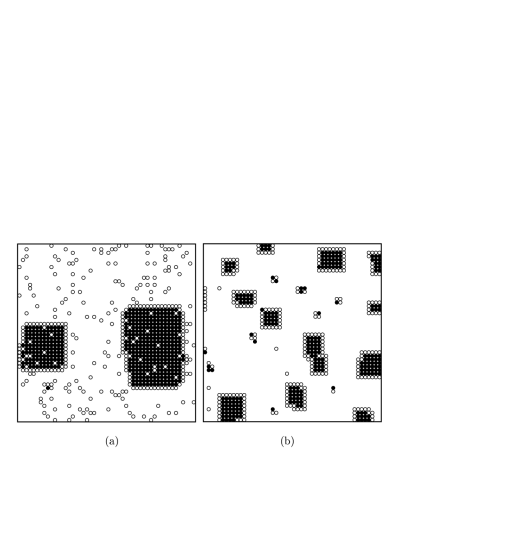
We performed simulations with predeposition of impurities for the same set of parameters as for codeposition. In order to obtain a morphology with island edges decorated by impurities, we need an appropriate value of . Complete decoration also requires a sufficient amount of impurities available on the surface. The data presented are for a predeposited coverage ML. Examples of morphologies for eV and eV are shown in Fig. 6 and look qualitatively similar to Figures 1 b and c.
The -dependence of the island density is compared with the results for codeposition in Fig. 7. The island densities in the predeposition regime are slightly higher than for codeposition. This is qualitatively plausible, since the predeposited impurities are present on the surface throughout the deposition process and hence their effect on growth accumulates over time. The corresponding curves are shifted by a factor independent of the flux. The slope remains the same as for codeposition. The difference from codeposition is that there is no appreciable


coverage dependence for larger than ML, except at larger fluxes in the case of strongly interacting impurities.
The detailed coverage dependence for a fixed flux is shown in Fig. 8. We see that the behavior of both the island density and the adatom density is qualitatively similar to homoepitaxy. The island density saturates and at the same time the adatom density starts to decrease. The impurities only cause a shift of the crossover to the saturation regime to a higher coverage, the shift being larger for stronger interaction between adatoms and impurities. We shall return to this effect in Section V B 1.
V Rate equation theory
In this section, we develop a simple rate equation approach to explain, at least qualitatively, the main impurity effects on the island density which were presented in Section IV. Our basic assumption is that the impurities affect the growth process only by slowing down the diffusion of adatoms. To obtain a simple analytic expression for the effective adatom diffusion coefficient in the presence of an impurity coverage , we further replace the (mobile) impurities by static traps with binding energy . Then standard results for diffusion in random media yield [31]
| (5) |
where is the diffusion coefficient of a single adatom on the clean substrate, and the abbreviation
| (6) |
has been introduced.
The first conclusion that can be drawn from Eq. (5) is that predeposited impurities, = const., significantly affect the adatom diffusion only if . In the case of codeposition and becomes time- or coverage-dependent. It is then useful to rewrite (5) in terms of the coverage of -atoms as
| (7) |
with the characteristic coverage
| (8) |
For coverages the impurities begin to significantly affect the adatom mobility. The expression (8) quantifies the statement made above in Section IV A 1 that an increase of the flux ratio in codeposition is equivalent to an increase of the - binding energy . For and K, we have for eV and for eV. In the following, these two sets of parameters will be referred to as the case of weak and strong impurities, respectively.
A Pure growth
We proceed by combining (5) with the simplest analytic model of nucleation, consisting of two coupled rate equations for the island density and the adatom density . In the absence of impurities, the equations for a critical island size read [17, 18, 20]
| (9) |
| (10) |
The main features of the solution of (9,10) with initial condition can be described as follows (see the article by Tang[20] for a lucid presentation): In the early time regime the adatom density increases linearly by deposition, , and accordingly the island density grows as
| (11) |
In the late time regime the adatoms are mainly captured by preexisting islands. This implies that and the island density grows more slowly, as
| (12) |
while the adatom density decreases as . The transition between the two regimes occurs at a coverage
| (13) |
Keeping the coverage fixed while increasing the flux therefore takes the system from the late time regime, where , into the early time regime with , with a maximum in the island density attained at a critical flux .
To generalize these estimates to the case , we replace the nucleation equation (10) by [17, 18]
| (14) |
Then the early time behavior becomes , while in the late time regime
| (15) |
in agreement with the expression (2) for the scaling exponent . The transition coverage is estimated by matching the two behaviors, which yields
| (16) |
For the coverage dependence of the densities of islands and adatoms observed in microscopic simulations is in accordance with the rate equation theory.[20, 21] In the reversible case , the simple rate equations are quantitatively inappropriate, though the key qualitative features – the existence of an early time regime of a rapid increase of the island density, followed by a “precoalescence saturation regime” with little change in – remain.[22]
B Impure growth
1 Predeposition
The effect of predeposited impurities is obtained simply by replacing by the constant expression (5) for in (15) and (16). Consequently the island density in the late time regime increases by a factor which is independent of flux or -coverage, and the onset of saturation is delayed by a factor . This is in qualitative agreement with the coverage dependence of densities of islands and adatoms displayed in Figure 8, which shows the same overall behavior as in the homoepitaxial case, only shifted to larger coverages and higher densities. Quantitatively, the numerically observed increase in the island density is consistent with the factor if the size of the critical nucleus is set to . On the other hand, if the critical nucleus size is assumed to be as suggested by the numerical value of , then the theory is seen to overestimate the increase in the island density and underestimate the delay of the onset of saturation.
As was mentioned in Section V A, the island density at fixed coverage shows a maximum at a critical flux , which is determined by setting the saturation coverage equal to . For predeposited impurities with this is given by
| (17) |
Further discussion of predeposition in relation to codeposition will be provided below.
2 Codeposition
In the case of codeposition the situation is richer due to the coverage dependence of . First, the cases and have to be distinguished. In the first case the impurities only affect the late time regime. For we can approximate (7) by . Inserting this into the nucleation equation (14) and setting we obtain the expression
| (18) |
which replaces (15) in the pure case. It can be seen that the scaling of with flux remains the same, i.e. the exponent is not affected. The impurities increase the island density by a factor which, in contrast to the case of predeposition, is coverage dependent. This is qualitatively consistent with the residual coverage dependence of the island density seen in Figure 2, which is nearly absent in the corresponding predeposition data in Figure 7. In quantitative terms, however, the coverage dependence in (18) is much stronger than what is observed in the simulations. The dependence of (18) on shows that increasing the ratio at constant and will also increase the island density, in accordance with the simulation data shown in Figure 3.
Noting that for codeposition , Eq. (18) can be rewritten as , which is identical to the expression for predeposition with . A more careful calculation shows that the island density for predeposition exceeds that for codeposition by a constant factor , if systems of the same impurity coverage are compared. This is qualitatively consistent with Figure 7, though the simulation data indicate that the factor is larger for weak impurities than for strong ones.
A surprising consequence of the rate equations with coverage-dependent diffusion is that the adatom density increases with coverage in the late time regime. This follows from balancing the deposition term on the right hand side of (9) against the island capture term , which yields
| (19) |
In fact, when the adatom density is a nonmonotonic function of coverage: It increases as for , decreases as for ,

and increases again according to (19) for . This is illustrated in Figure 9, which is reminiscent of the simulation data for the adatom density in Figure 4. However, in contrast to the simulations, the late time adatom density given by (19) is small compared to the island density (18), and neither the intermediate scaling regime nor the oscillations of seen in Figure 4 are reproduced by the rate equations. Here and in the following figures we show results obtained by numerical integration of the rate equations (9,10) for , with replaced by . This is sufficient for a qualitative comparison, and relieves us of the necessity to explicitly treat the growth dynamics of the intermediate unstable clusters.
Consider next the case . For coverages in the early time regime which satisfy , we set and obtain, using , the early time behavior . The onset of the saturation regime then occurs at a coverage
| (20) |
which exceeds the corresponding expression (16) for the pure system by a factor . Thus both predeposited and codeposited impurities delay the onset of the saturation regime.
The critical flux at which the island density attains a maximum is now given by

| (21) |
which is seen to become identical to the predeposition expression (17) by setting . A quantitative evaluation using the parameters of the simulations

shows that the critical flux is beyond the range of simulated fluxes for the case of weak impurities, while it should be observable for strong impurities. This is illustrated in Figure 10. It therefore appears natural to identify the saturation of the flux dependence of the island density found in the simulations (see Figures 2 and 7) with the maximum predicted by the rate equations, although it should be emphasized that the simulations show no clear evidence of a decrease of beyond the plateau.
Finally, we address the effect of changing the adatom flux while keeping the impurity flux constant. At fixed this implies a crossover from for to for . In the high flux regime the island density is unaffected by the impurities, while in the low flux regime becomes independent of , since . This is illustrated in Figure 11, which should be compared to Figure 3. The behavior is qualitatively similar, however instead of a plateau at low fluxes the MC simulations show a second scaling regime with a nonzero exponent .
3 The effect of edge decoration
In the formulation of the rate equations we have assumed that all deposited impurities contribute to the impurity coverage in the expression (5) for the effective diffusion coefficient, thus neglecting the fact that a certain fraction of impurities is bound at the island edges. This assumption is self-consistent only if the density of edge sites, as predicted by the rate equations, is small compared to the deposited coverage of impurities at all times.
For compact islands the density of edge sites is of the order of , where is the area of an island, and hence
| (22) |
In the saturation regime , thus . In the early time regime to leading order, and the density of edge sites is determined by the next-to-leading correction. Analysis of the rate equations shows that both for and for , which implies that the island size does not increase with coverage in this regime.
Using the estimates for , the importance of the impurities bound at the edges can be worked out for specific cases. Since evidently always, a sufficient condition for the irrelevance of edge decoration is that at all times. This is true for predeposited impurities up to a coverage , and for codeposition with . Among the situations treated earlier in this section, the only case where corrections due to edge decoration may be expected is deposition at fixed impurity flux in the transition region (see Figure 11). For fluxes the impurities were seen to be irrelevant even if the full impurity coverage contributes to slowing down the adatoms. Since the edge decoration decreases the impurity concentration on the terraces, it is likely that its only effect will be to shift the point where the island density becomes equal to its homoepitaxial value towards smaller deposition fluxes.
VI Conclusions
A brief glance at the results presented in this paper may lead to disappointment: No dramatic change of the exponent has been found contrary to expectations in any of the modifications of the simulation model.[30] However, upon closer inspection our work reveals several nontrivial features that should not be overlooked in the large amount of numerical data.
(i) We have established that a perfect decoration of island edges in our model requires a process of adatom exchange that is completely analogous to the exchange discussed for surfactant-mediated growth of semiconductors.[29] A feature worth remembering is the enhancement of diffusion of adatoms along island edges via the exchange process with impurities attached to these edges. This mechanism of smoothing on a one-dimensional substrate provides another perspective and possible interpretation of the smooth growth on a two-dimensional substrate in the presence of a surfactant. Smoothing of island shapes should be experimentally verifiable and may have practical implications.
Given the fact that size and shape of islands (including the number of kinks at island edges) in the submonolayer regime of growth determine the developing surface morphology (cf. most of the experimental papers cited below, and in particular Ref. [10]), a possibility to control both of them by adding impurities seems very attractive.
(ii) From a theoretical perspective, we have been able to obtain insight into (and even semi-quantitative agreement with) the simulation results, using rather simple rate equation theory. The surprising resistance to change of the exponent can be understood within this theory, as well as other features of the simulations, such as the strikingly different behavior of the adatom density during impure growth with codeposition as compared to the case of homoepitaxy.
Our research also leads to new questions. One would like to understand better the details of behavior observed, in particular the oscillations of the adatom density seen in simulations (Fig. 8). Another open question concerns “monovalent” impurities that can bond to island edges but do not bond to adatoms approaching these edges, and which therefore should bring about an efficient passivation of the island boundaries. Preliminary simulations suggest that this effect alone does not bring about any significant change in the value of the exponent .
Acknowledgements. JK acknowledges the kind hospitality of the Institute of Physics, Czech Academy of Sciences, Prague, while part of this paper was prepared. This work was supported by Volkswagenstiftung, by the COST project P3.130 and by DFG within SFB 237.
REFERENCES
- [1] H.A. van der Vegt, J.M.C. Thornton, H.M. van Pinxteren, M. Lohmeier and E. Vlieg, Phys. Rev. Lett. 68, 3335 (1992).
- [2] G. Rosenfeld, R. Servaty, C. Teichert, B. Poelsema and G. Comsa, Phys. Rev. Lett. 71, 895 (1993).
- [3] J. Vrijmoeth, H.A. van der Vegt, J.A. Meyer, E. Vlieg and R.J. Behm, Phys. Rev. Lett. 72, 3843 (1994).
- [4] V. Fiorentini, S. Oppo and M. Scheffler, Appl. Phys. A 60, 399 (1995).
- [5] W. Wulfhekel, N.N. Lipkin, J. Kliewer, G. Rosenfeld, L.C. Jorritsma, B. Poelsema and G. Comsa, Surf. Sci. 348, 227 (1996).
- [6] J.A. Meyer, H.A. van der Vegt, J. Vrijmoeth, E. Vlieg and R.J. Behm, Surf. Sci. 355, L375 (1996).
- [7] B. Voigtländer, A. Zinner, T. Weber and H.P. Bonzel, Phys. Rev. B 51, 7583 (1995).
- [8] D. Kandel and E. Kaxiras, The surfactant effect in semiconductor thin film growth, Solid State Physics (in press). cond-mat/9901177.
- [9] M. Kalff, G. Comsa and T. Michely, Phys. Rev. Lett. 81, 1255 (1998).
- [10] M. Kalff, P. Šmilauer, G. Comsa and Th. Michely, Surf. Sci. Lett. 426, L447 (1999).
- [11] L. Andersohn, Th. Berke, U. Köhler and B. Voigtländer, J. Vac. Sci. Technol. A 14, 312 (1996).
- [12] J.D. Weeks and G.H. Gilmer, Adv. Chem. Phys. 40, 157 (1979).
- [13] A.C. Levi and M. Kotrla, J. Phys. Cond. Matt. 9, 299 (1997).
- [14] M. Kotrla, J. Krug and P. Šmilauer, to appear in Surface Science.
- [15] I. Markov, Phys. Rev. B 50, 11271 (1994).
- [16] P. Šmilauer, K. Mizushima and D. D. Vvedensky, Phys. Rev. Lett. 81, 5600 (1998).
- [17] S. Stoyanov and D. Kashiev, in “Current Topics in Materials Science”, ed. by E. Kaldis (North Holland, Amsterdam 1981), p. 69.
- [18] J.A. Venables, G.D.T. Spiller and M. Hanbücken, Rep. Prog. Phys. 47, 399 (1984).
- [19] D.E. Wolf, in “Scale Invariance, Interfaces and Non-Equilibrium Dynamics”, ed. by A. Mc Kane, M. Droz, J. Vannimenus and D.E. Wolf (Plenum Press, New York 1995), p. 215.
- [20] L.-H. Tang, J. Physique I France 3, 935 (1993).
- [21] M.C. Bartelt and J.W. Evans, Surf. Sci. 298, 421 (1993).
- [22] C. Ratsch, A. Zangwill, P. Šmilauer and D.D. Vvedensky, Phys. Rev. Lett. 72, 3194 (1994).
- [23] J.G. Amar and F. Family, Phys. Rev. Lett. 74, 2066 (1995).
- [24] J.A. Stroscio and D.T. Pierce, Phys. Rev. B 49, 8522 (1994).
- [25] The effect of repulsive impurities has been considered in S. Liu, L. Bönig, J. Detch and H. Metiu, Phys. Rev. Lett. 74, 4495 (1995).
- [26] D.D. Chambliss and K.E. Johnson, Phys. Rev. B 50, 5012 (1994).
- [27] D. Kandel, Phys. Rev. Lett. 78, 499 (1997).
- [28] J.A. Meyer, J. Vrijmoeth, H.A. van der Vegt, E. Vlieg and R.J. Behm, Phys. Rev. B 51, 14790 (1995).
- [29] D. Kandel and E. Kaxiras, Phys. Rev. Lett. 75, 2742 (1995).
- [30] This of course does not mean that the increase of the exponent due to barriers to attachment of adatoms to islands cannot be observed. Indeed, such an increase has been observed in a recent paper: J. Mysliveček, T. Jarolímek, P. Šmilauer, B. Voigtländer, and M. Kästner, Phys. Rev. B 60, 13869 (1999).
- [31] J.W. Haus, K.W. Kehr and J.W. Lyklema, Phys. Rev. B 25, 2905 (1982).