[
Extensive infrared spectroscopic study of CuO: signatures of strong spin-phonon interaction and structural distortion
Abstract
Optical properties of single-crystal monoclinic CuO in the range 70 - 6000 cm-1 were studied at temperatures from 7 to 300 K. Normal reflection spectra were obtained from the (001) and (010) crystal faces thus giving for the first time separate data for the and phonon modes excited in the purely transverse way (TO modes). Mode parameters, including polarizations of the modes not determined by the crystal symmetry, were extracted by the dispersion analysis of reflectivity curves as a function of temperature. Spectra of all the components of the optical conductivity tensor were obtained using the Kramers-Kronig method recently extended to the case of the low-symmetry crystals. The number of strong phonon modes is in agreement with the factor-group analysis for the crystal structure, currently accepted for the CuO. However, several ”extra” modes of minor intensity are detected; some of them are observed in the whole studied temperature range, while existence of others becomes evident at low temperatures. Comparison of frequencies of ”extra” modes with the available phonon dispersion curves points to possible ”diagonal” doubling of the unit cell {a, b, c} {a+c, b, a-c} and formation of the superlattice. The previously reported softening of the mode ( 400 cm-1) with cooling at is found to be 10 % for the TO mode. The mode is very broad at high temperatures and strongly narrows in the AFM phase. We attribute this effect to strong resonance coupling of this mode to optical or acoustic bi-magnons and reconstruction of the magnetic excitations spectrum at the Néel point. A significant anisotropy of is observed: it was found to be 5.9 along the b-axis, 6.2 along the [101] chains and 7.8 the [10] chains. The ”transverse” effective charge is more or less isotropic; its value is about 2 electrons.
PACS numbers: 78.20.Bh, 78.20.Ci, 78.30-j, 71.27.+a, 71.45.Gm
]
I Introduction
Since 1986 the interest to cupric oxide CuO has been mostly governed by its close relation to the problem of high- superconductivity. In addition to the role of the parent compound of all the high- materials with CuO2 planes, it has a number of physical and chemical features common to several undoped antiferromagnetic (AFM) cuprates, (e.g. La2CuO4, YBa2Cu3O6): similar copper coordination and electronic state, Cu-O distances, values of localized magnetic moments, superexchange constants, low-dimensionality of magnetism etc.
CuO, however, is a quite interesting system in its own right. Although Cu2+ ions are expected to be in the state with one 3-hole per atom, this transition metal (TM) oxide is a strongly correlated insulator of the ”charge-transfer” type according to the theory of Zaanen, Sawatzky and Allen [1]; the holes are well localized forming local magnetic moments. CuO undergoes a 2-stage magnetic transition: at = 230 K an incommensurate magnetic structure is observed, while at = 213 K magnetic moments order parallel to the b-axis antiferromagnetically along the chains and ferromagnetically along the [101] chains [2]. From the analysis of the spin-wave velocity [2, 3] it was found that the exchange constant along the chains (60 - 80 meV) is several times larger than this value along any other direction. The anomalous temperature dependence of the magnetic susceptibility [4] points to low-dimensional, or, at least, highly anisotropic character of magnetic interactions and persistency of spin correlations at temperatures well above the Néel point [5, 6].
Another feature of the cupric oxide is the low-symmetry monoclinic lattice, which distinguishes it from the other TM monoxides, e.g. MnO, FeO, CoO and NiO with the rock-salt structure. It is a prominent manifestation of the Jahn-Teller effect: in the high-symmetry octahedral position characteristic to the cubic structure, the Cu2+ ion would have degenerate and orbitals, which is energetically unfavourable, and therefore tend to displace away from the symmetry position. This tendency is so strong that CuO has not just a distorted cubic lattice, but a completely different monoclinic tenorite structure.
Several groups [7, 8, 9, 10, 11, 12, 13] have reported results of infrared (IR) spectroscopic studies of powder as well as single-crystal specimens of CuO. The interpretation of infrared spectra was always embarrassed by the low crystal symmetry, especially for the case of polycrystalline samples. Kliche and Popovic [10] have measured infrared spectra of sintered powder samples as a function of temperature and for the first time assigned strong IR-active modes to the species and by comparison of frequencies with those in PdO. They also reported an additional broad mode at about 414 cm-1 the intensity of which increases drastically with cooling down below and suggested that it is a zone-boundary phonon mode which becomes IR-active because of IR absorption from AFM superstructure. It is evident now that it was a manifestation of the anomalous softening of the mode reported by Homes et al [13].
So far it was a serious problem to obtain single crystals of CuO suitable for quantitative infrared studies. Guha et al [11] has succeeded to measure infrared polarized spectra of single crystals of CuO at room temperature and account for low-symmetry effects in data analysis. They have measured reflectivity from the (10) natural face and modelled spectra by the dielectric function formulas adapted to monoclinic crystals [14]. However, due to inconvenient crystal orientation in their experiment mixed LO-TO modes were excited, the properties of which depend on the wave vector direction.
Homes et al [13] were the first to present single-crystal infrared spectra as a function of temperature. Again, however, only the (10) crystal surface was accessible for optical experiments, and mixed LO-TO modes were actually observed. An appreciable (about 5 %) sharp softening of the 440 cm-1 reststrahlen band for the E b upon cooling down was definetely registered at the Néel transition. Spectra were fitted with introduction of and phonon modes only. No new phonon structures at the magnetically ordered phase were reported indicating absence of a crystal superlattice below .
This statement sounds puzzling in a view of observation by Chen et al [15] of five new modes at low temperatures in the Raman spectra. Authors have assigned these modes to folded phonons; as a folding mechanism, a strong spin-phonon interaction was proposed. The most intense new mode 240 cm-1 hardens strongly at cooling down, which was attributed [15] to an additional lattice rigidity due to magnetization.
There is a serious inconsistency concerning structure and parameters of IR-active phonon modes, especially at high frequencies. For instance, the deviations in resonance frequency of these modes reported by different groups are too significant to be explained by experimental errors, isotope effect, crystal non-stoiochiometry etc. In our opinion, the explanation lies in the intermediate LO-TO nature of the observed modes and corresponding uncertainty of phonon parameters, especially for the high-frequency intense modes with large LO-TO splitting. Moreover, no infrared data so far were reported where the and modes were completely separated. Parameters of the modes were extracted at best from the single-crystal spectra for where the modes are also present.
In this paper we aimed to resolve this uncertainty by separate measurement of the characteristics of purely TO and modes. For monoclinic crystals the only option for observation of the TO modes is to measure normal reflectivity from the (010) face (the ac-plane). To study the TO modes any crystal plane containing the b-axis, e.g. (001) face, may suffice. We succeeded to obtain these crystal faces with a sufficiently large area, allowing to perform reliable measurements and quantitative analysis of the data as described below.
II Crystal structure and factor-group analysis
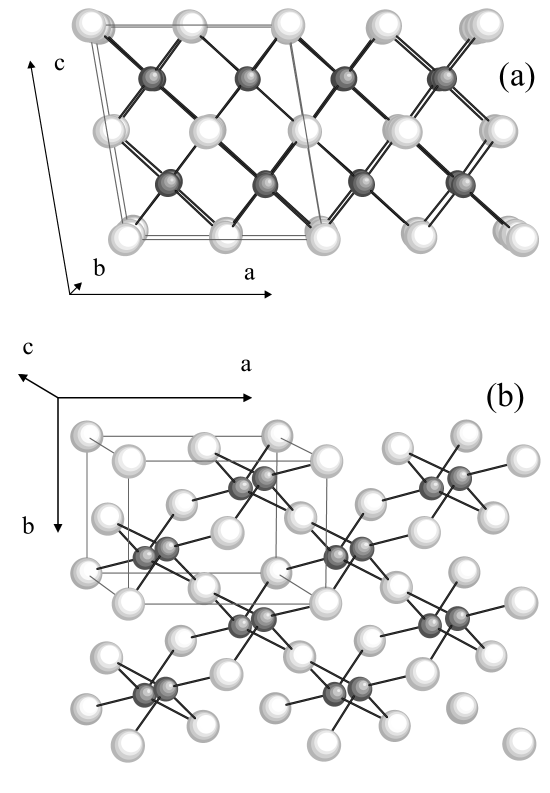
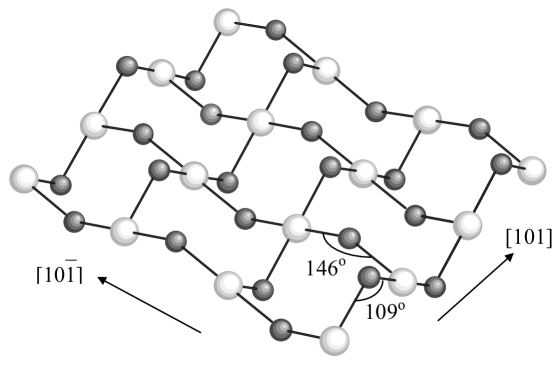
Cupric oxide CuO, unlike other TM monoxides, crystallizes in a low-symmetry monoclinic tenorite structure (Fig. 1). It is generally accepted, following Åsbrink and Norrby [16], that at room temperature (RT) the space group is C (C2/c); there are four CuO molecules in the unit cell with dimensions a = 4.6837 Å, b = 3.4226 Å, c = 5.1288 Å, = 99.54∘ and two CuO units in the primitive cell; the copper and oxygen occupy the Ci and C2 symmetry positions correspondingly. Each copper atom is situated in the center of the oxygen parallelogram. Each oxygen atom, in turn, has a distorted tetrahedral copper coordination. The adjacent CuO4 parallelograms form two sets of ribbons propagating along the [110] and the [10] directions. The structure can be also considered as being composed from two types of zig-zag Cu-O chains running along the [101] and the [10] directions (Fig. 2). The Cu-O-Cu angle is 146∘ in the [10] chains and 109∘ in the [101] chains.
For the C space group the factor-group (FG) analysis [17] gives the following set of the zone-center lattice modes: . Out of these, 3 modes () are Raman-active, 6 modes (3) are IR-active. The modes are polarized along the b-axis. The dipole moments of the modes lie within the ac-plane, but due to the low symmetry their directions are not exactly determined by the crystal structure.
More recently Åsbrink and Waskowska[18] have refined the CuO structure at 196 K and 300 K using the so called ”less significant reflections” in the X-ray data analysis and found that less symmetric space-group C (Cc) is also consistent with the X-ray diffraction data for both phases. They suggested that the C space-group might result from the time-averaging or site-averaging of non-equivalent (due to valence fluctuations) atom positions of lower symmetry. Some lattice distortions, especially changes of the Cu-O distances, were clearly detected when passing from RT to 196 K. In general, one can state, that the C space-group is a good approximation to the real structure of the cupric oxide, but some minor deviations from this do not contradict to the X-ray data.
III Experimental
A Sample preparation and characterization
Single crystals of CuO were obtained from a CuO - PbO - Bi2O3 melt. The details are described elsewhere [19]. After cooling down the crucible contained randomly oriented large single-crystal pieces of CuO along with inclusions of other phases. From this conglomerate the largest CuO single crystals were extracted and oriented using the X-ray diffraction. As usual, natural crystal faces were presumably of (110) and (10) orientation. This face orientation was used in previous papers where infrared reflectivity measurements were performed. However, for the reasons mentioned above, we aimed to obtain large enough the (001) (the ab-plane) and the (010) (the ac-plane) crystal faces. These two mutually perpendicular faces were cut on one selected single-crystal sample, which was used for measurement of all the reflectivity spectra presented in this paper. Cuts were polished with a fine 0.06 m Al2O3 powder. Microscopic analysis of the surface [19] has shown that the crystal is twinned. Fortunately, one twin orientation was almost completely dominating; the domains of the alternative twin orientation form narrow stripes covering less than 5 % of surface area. Such domination was also confirmed by the X-ray Laue snapshots, where no detectable reflections corresponding to the alternative twin orientation were observed. The structure of twins is such [20] that the b-axis direction is the same for different twin orientations; all twin reflections are within the ac-plane. So a minor (less than 5 %) contribution of other twin domains is possible for the (010) face reflectivity spectra. For the case of reflection from the (001) face, when E b, all twins contribute in the same way and twinning has no effect. The Lauegram has shown that (001) and (010) crystal faces were cut with accuracy of 1.8∘ and 2.1∘respectively. The electron Auger microscopy has shown the presence of only copper and oxygen atoms on the both crystal faces. The area of the (001) face suitable for quantitative optical measurements (i.e. containing no impurity inclusions, having the lowest fraction of the alternative twin orientation), was 3 mm2; that of the (010) face was 4 mm2.
B Reflectance measurement
Infrared reflectivity spectra were measured from 70 to 6000 cm-1 using a Bruker IFS 113v FT-IR spectrometer. The average angle of incidence was about 11∘. A set of different light sources, beamsplitters, polarizers and detectors were used to cover this frequency range. The mid-infrared (MIR) spectra from 400 to 6000 cm-1 were measured using a globar source, KBr beamsplitter, KRS-5 polarizer and DTGS and MCT detectors. The far-infrared (FIR) region 70 - 700 cm-1 was studied with the aid of the Hg lamp, a set of mylar beamsplitters, a polyethylene polarizer and the helium-cooled Si bolometer.
The polarizer was mounted in the optical path of the incident beam; no additional polarizers (analyzers) were put inbetween sample and detector. The transmission properties of the polarizers were measured independently and, when necessary, special care of the correction for the unwanted polarization leakage was taken. Polarizer rotation was performed using a computer-controlled mechanical rotator.
An original ”three-polarization” measurement technique [21] was used involving the measurement of three reflectivity spectra per crystal face for different polarizations of almost normally incident light: vertical (0∘), horizontal (90∘) and diagonal (45∘). In principle, the knowledge of these spectra should be enough to calculate the reflectivity for any other polarization direction. In particular, the relation + = + should work. We especially checked the validity of this relation and experimentally proved that it holds with a good accuracy.
The sample was mounted with a good thermal contact in a continuous-flow cryostat (Oxford Instruments) with an automatic temperature control. Spectra were measured at temperatures 300, 250, 240, 230, 220, 210, 200, 180, 150, 100 and 7 K, so that, special attention has been paid to the range in the vicinity of = 230 K and = 213 K. The temperature setting accuracy was about 1 K.
A reference for the absolute reflectivity was provided by in situ evaporation of a gold layer on the surface and consecutive repetition of the same set of measurements for every temperature. Such a procedure has compensated errors associated with not only non-ideality of the sample face but also the thermal deformation of the cryostat cold finger. To account for a possible drift of a single-beam intensity due to source and detector instability, every sample-channel measurement was accompanied by a measurement of the intensity of the light beam passed via the second channel without reflection from the sample.
IV Spectra treatment
A The dispersion analysis
Let us introduce the orthogonal system of coordinates {}: , , , so that there is a slight inclination ( 9.5∘) between axes z and c. Due to the monoclinic symmetry the whole 3D dielectric tensor is the composition of two components: the scalar along the b-axis and the 2D tensor within the ac-plane ( is expected without external magnetic field). The dispersion formulas are:
| (1) |
| (2) | |||||
| (5) |
where - the transverse frequency, - the plasma frequency, - the linewidth of the -th mode, - the angle between the dipole moment of the -th mode and the -axis (for the modes only), and are the high-frequency dielectric tensors. The b-axis complex reflectivity and the reflectance of the (001) plane for E b are expressed via the dielectric function:
| (6) |
The complex reflectivity tensor can be expressed via the dielectric tensor by the matrix formula, which is formally analogous to (6):
| (7) |
where is the unity tensor. The matrix square root naturally means, that the matrix is first reduced to the diagonal form by a proper rotation, the square root is then taken from each diagonal element, and finally it is rotated back to the initial coordinate system. The ”-1” exponent implies calculation of the inverse matrix.
The reflectance of the (010) plane depends on the direction of the incident light polarization :
| (8) |
The reflectances for values 0∘, 45∘and 90∘ of the angle between the electric field vector and the x-axis used in the ”three-polarization” measurement scheme[21] are expressed in terms of the components of :
| (9) | |||||
| (10) | |||||
| (11) | |||||
| (12) |
The phonon parameters can be obtained by fitting of the reflectance spectra using the written above formulas. To obtain the modes parameters the spectrum is fitted. The characteristics of the modes, including unknown angles , can be extracted by simultaneous fitting of three spectra , , from the (010) plane.
B The Kramers-Kronig analysis
For the case E b the Kramers-Kronig (KK) analysis can be performed in a usual way because one of the dielectric axes is parallel to this direction. Due to the low crystal symmetry, the directions of the two other principal dielectric axes in the ac-plane depend on the frequency, which precludes the straightforward application of the KK method to the ac-plane reflectance data. For this case we used a modified version of this technique, which allows to determine frequency dependence of all the components of the complex reflectivity tensor , provided that three reflectance spectra , and are measured in wide enough frequency range. The details of this KK method generalization are described in Ref.[22].
For a correct implementation of the KK integration, the reflectivity in the range 6000 - 37000 cm-1 was measured using the Woollam (VASE) ellipsometer system. At higher frequencies the asymptotics was assumed, as usual. At low frequencies the reflectivity was extrapolated by a constant value.
V Results and analysis
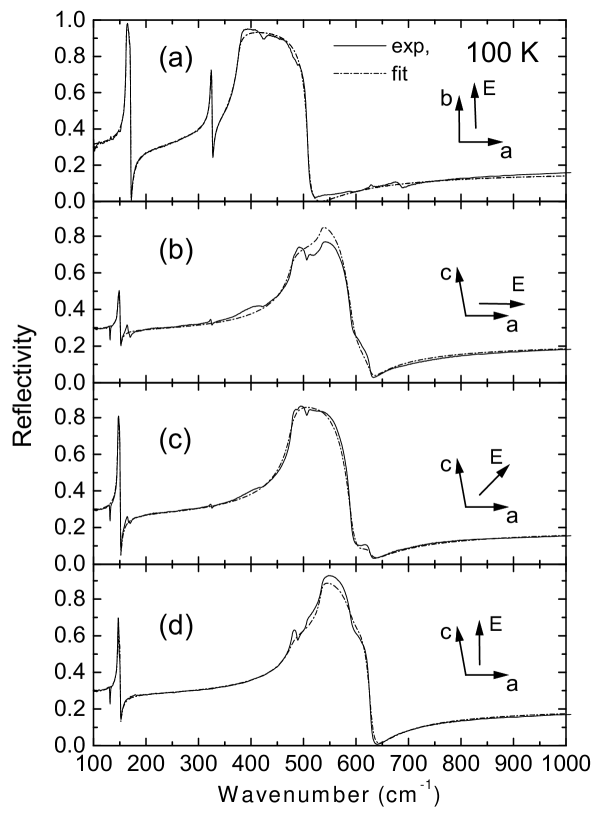
A E b
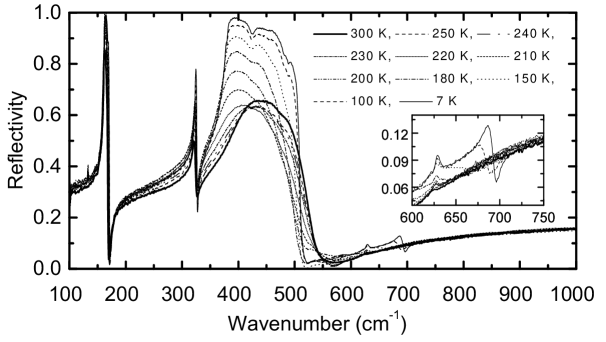
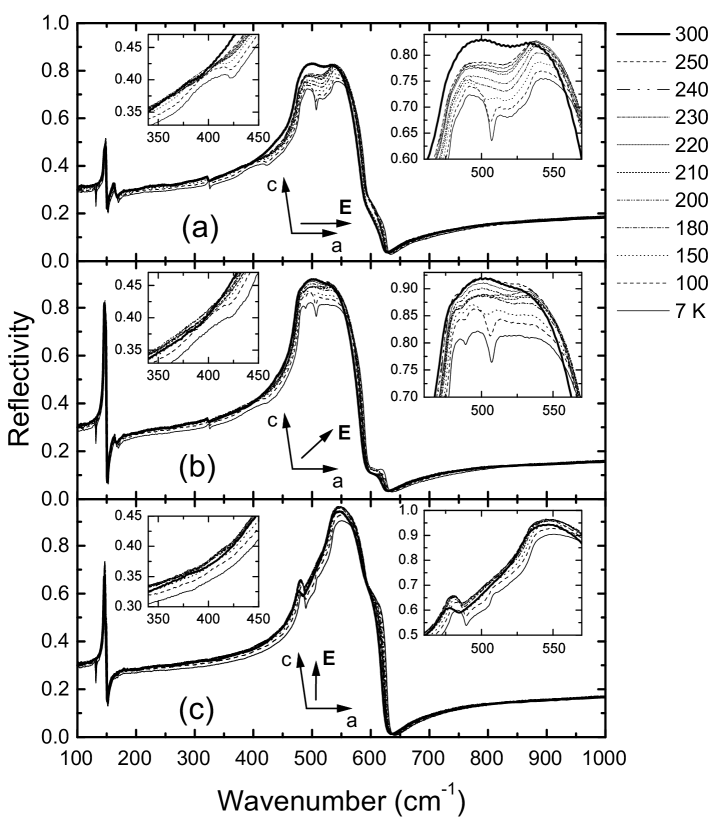
The reflectance spectra for the (001) plane, when E b, are shown at Fig. 3. In this configuration only the TO modes should be active. Exactly three strong modes are observed: ( 160 cm-1), ( 320 cm-1) and ( 400 cm-1), which confirms the FG-analysis predictions for the established for CuO crystal structure. The most drastic temperature changes take place in the range 350 - 550 cm-1, where the reststrahlen band corresponding to very intense lattice mode is situated. The reflectivity maximum elevates from 65 % to almost 100 %; its gravity center moves to lower frequencies upon cooling down the sample. It indicates, that this mode experiences strong softening and narrowing as a temperature is decreased.
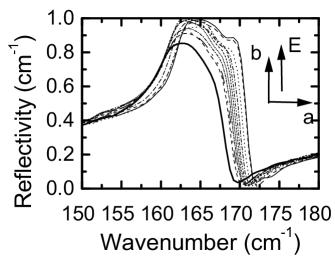
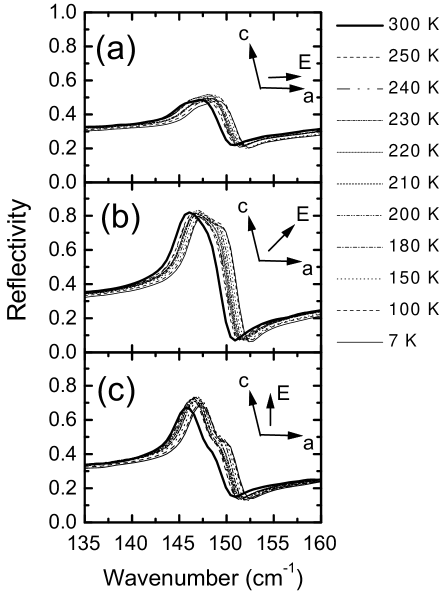
In addition to three strong modes, at least five ”extra” structures in these reflectivity spectra are detectable ”by eye” (Fig. 3). The first structure is a dip at 425 cm-1 just on the top of the reststrahlen band, which becomes visually evident below 210 K. The second is a 485 cm-1 structure also on the top of the same reststrahlen band seen at 100 K and 7 K. The third feature is a 630 cm-1 peak (see inset), which is very small (but observable) at 300 K, and becomes significant at low temperatures. The fourth structure is high-frequency mode 690 cm-1 (see inset), which is very obvious at 7 K (690 cm-1) and 100 K (680 cm-1), still detectable at 150 K ( 650 cm-1) and not seen at higher temperatures, probably, because of strong broadening. The fifth structure is seen at 165 - 170 cm-1 at the top of the reststrahlen band of the mode (Fig. 4(a)). It is better observable at low temperatures; but even at room temperature the form of the reststrahlen band differs from a single-mode shape.
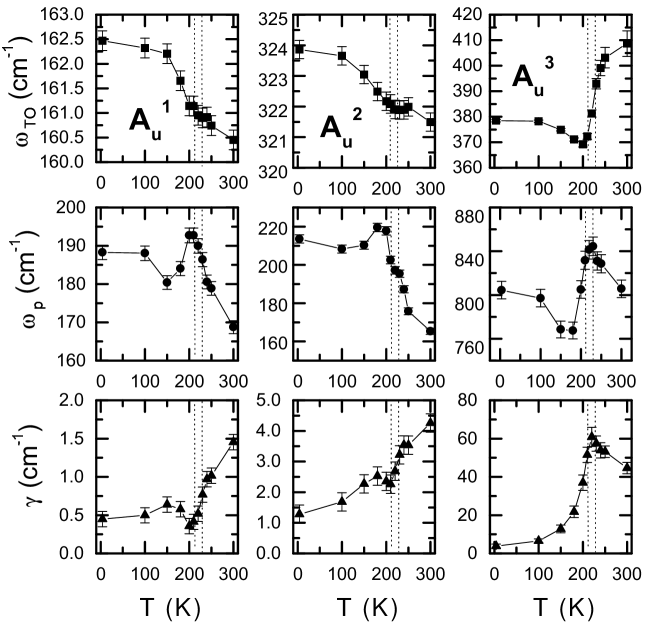
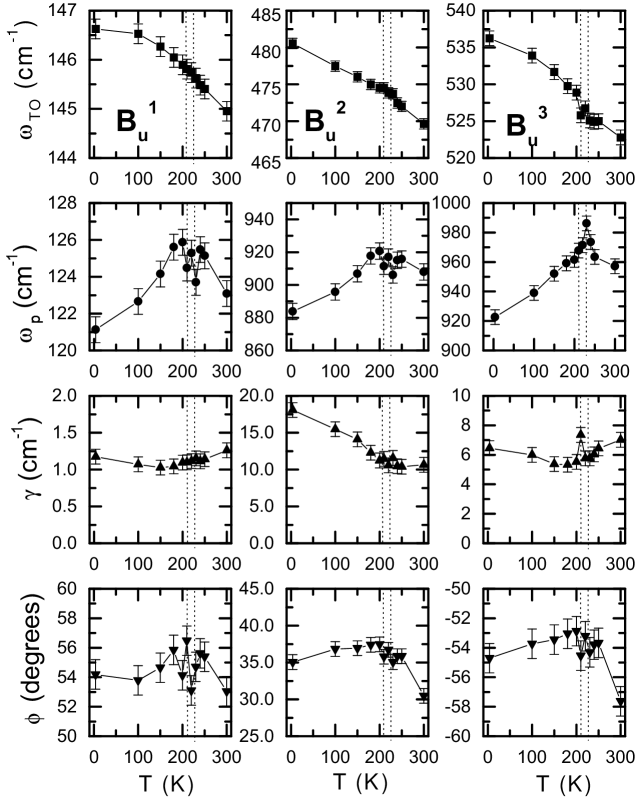
The observations ”by eye” should be accompanied by numerical analysis. The dispersion analysis of spectra was performed in two stages. On the first stage, in order to determine the characteristics of the principal modes, we have fitted the reflectivity curves with introduction of 3 modes only. The experimental and fitting curves are compared at Fig. 5(a) for the = 100 K. The fit quality is good enough; the deviations are observed only in the range of additional modes. A relative weakness of additional structures ensures small errors in determination of main mode parameters. The parameters of 3 principal phonon modes obtained by such a fitting as a function of temperature are shown at Fig. 6.
From Fig. 6 a conclusion can be drawn immediately that the and modes behave in a quite similar way, while the highest-frequency mode is significantly different. The and modes are steadily hardening with cooling ( 1 %), with some increasing of the slope below . In contrast, the mode slightly softens with cooling down to the , then undergoes a drastic sharp softening ( 10 %) in the vicinity of the transition temperature and then hardens with further cooling from down to the helium temperature. The and modes are relatively narrow at 300 K and exhibit further narrowing with cooling with some dip at the transition temperature. On the contrary, the mode is very broad at 300 K, and broadens more with approaching the . Its linewidth has a pronounced maximum inbetween and . In the AFM phase it quickly narrows with cooling down.
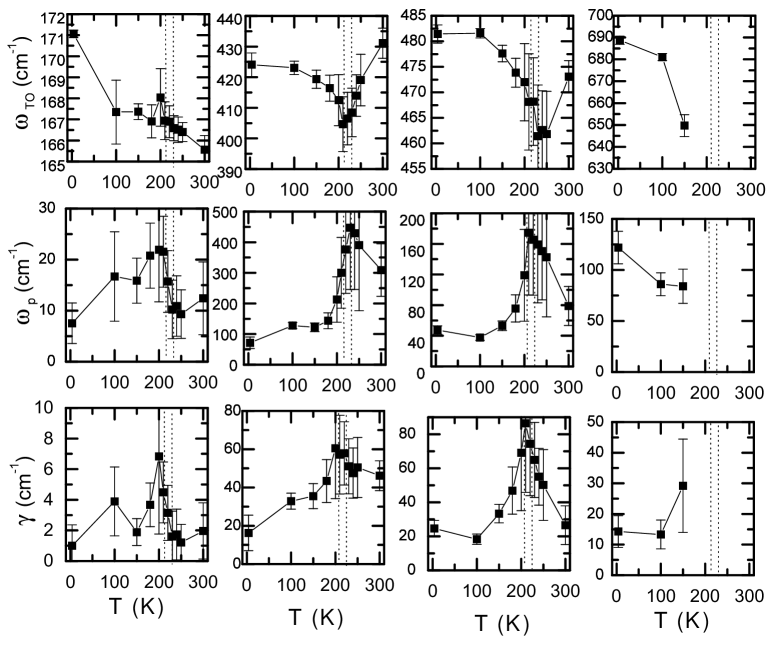
On the second stage, in order to determine or, at least, estimate parameters of the mentioned ”extra” modes, additional fitting of spectra with introduction of both principal and ”extra” modes has been performed (see Fig. 7). It was possible to fit the structures at 167 cm-1, 425 cm-1, 485 cm-1 and 690 cm-1. The 630 cm-1 peak cannot be fitted by the usual lorentian term. The first fit was performed at 7 K, when additional structures are mostly sharp. Other spectra were fitted in sequence 100 K, 150 K, …, 300 K. At each step the oscillator parameters, corresponding to the previous temperature served as initial approximation for the least-squares fitting. Parameter confidence limits were always calculated by the ”covariant matrix” method (see error bars at Fig. 7), which takes into account possible correlation of parameters. In this way it was possible to extend curves of modes 167 cm-1, 425 cm-1 and 480 cm-1 up to room temperature; the 690 cm-1 mode was fitted only for 150 K, because at higher temperatures fitting could not give reasonable values of parameters for this mode. The errors in determination of additional modes are relatively larger than those for the principal ones, which is natural, in view of their small intensity. In general, errors are smaller at lower temperatures.
The temperature dependence of TO frequency additional mode 167 cm-1 is more or less typical for phonons (the value of 171 cm-1 at 7 K is an artefact of the dispersion analysis with no physical meaning). On the contrary, the 425 cm-1 and 485 cm-1 modes demonstrate a puzzling temperature dependence, similar to that of the mode 400 cm-1. First of all, there is no indication of disappearance of these modes above the AFM transition, although they are not clearly seen ”by eye”. Nevertheless, the transition strongly affects parameter values of these modes. Both modes strongly soften above and strongly harden below . The modes are narrowing below (which facilitates their visual observation), and are very broad at higher temperatures with a strong maximum at the transition point. One can content only by a qualitative conclusions, because the temperature dependencies of these modes are masked by large error bars. It can be explained by some correlation between parameters of these modes with ones of the mode. It is a typical problem for several broad closely located modes. Therefore, it is unreasonable to attribute physical meaning to increasing of the plasma frequency of these modes above 200 K: their plasma frequencies are just subtracted from the plasma frequency of the mode without significant influence on the fit quality. For the 690 cm-1 mode the dispersion analysis results confirm visual observations: anomalously strong hardening at cooling and strong broadening with heating. The latter, probably, precludes satisfactory fitting of this mode at higher temperatures.
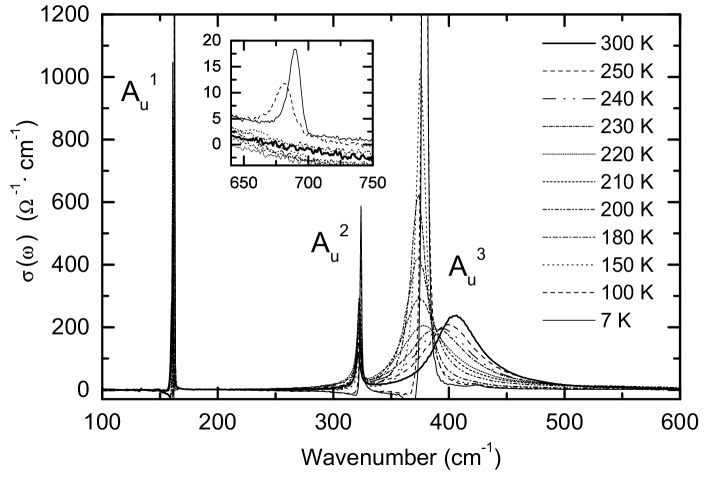
The curves of the b-axis optical conductivity , obtained by the KK transform of the reflectivity spectra for each temperature, are shown at Fig. 8. The conductivity is very illustrative to show a remarkable difference between the and narrow modes and the mode exhibiting a puzzling temperature transformation. The sharpness of the and modes and the absence of the modes contribution to this spectrum confirms a good sample quality and its proper orientation. Some deformations of the lineshapes for = 100 K and 7 K (in particular, a small negative value of conductivity just below the mode frequencies) are most likely the results of uncertainties of the KK method, which is very sensitive to experimental errors in the regions where the reflectivity approaches 0 or 1. We shall not attribute any physical meaning to this effect.
B E ac
The reflectance spectra from the (010) plane for three polarizations of the incident light (, and ) are shown at Fig. 9. The TO modes are expected to appear in these spectra. The narrow mode ( 145 cm-1) is clearly observed in all polarizations. Its intensity depends, of course, on the light polarization, i.e. the angle between the electric field vector and the mode dipole moment. Strong reststrahlen bands are seen in the 450 - 600 cm-1 range. The shape and the center position of the band is polarization-dependent, which is consistent with a suggestion that it is actually formed by at least two high frequency intense modes. In the (E a) and spectra one can observe some minor contribution from the (162 cm-1) and (323 cm-1) modes. The possible reason is some misorientation of the sample. A spike at about 130 cm-1 is of apparatus origin and should be ignored.
As is in the case E b, some extra structures are seen. The first is a broad band in the range 380 - 425 cm-1. It is especially pronounced for E a, less evident for intermediate polarization and absent for E a (see the left insets in Fig. 9). A dip at 425 cm-1, indoubtedly correlates with the dip at the same frequency at reflectance for E b. The second is a pronounced structure consisting of a peak at 480 cm-1 and a dip at 485 cm-1 in the spectrum, existing at all temperatures. In spite of proximity of this frequency to additional structure at Fig. 3, a completely different temperature dependence makes one to separate these modes. The third structure is a dip at 507 cm-1 on the top of the reststrahlen band of and (see the right insets in Fig. 9). This frequency is very close to the LO frequency of the mode, therefore it is most likely the mode which is seen in this spectrum for the same reason as the and modes are. The fourth structure is seen in the vicinity of the mode (Fig. 10). The shape of this mode is such that it is worth to suggest, that it is actually composed of two different modes (see, especially, Fig. 10(c).
For each temperature a fitting procedure with introduction of 3 oscillators, corresponding to principal modes has been performed. The phonon polarization angles were adjusted along with other phonon parameters. Spectra , and were fitted at the same time. In the spirit of the FG-analysis prediciton, three lattice modes were introduced for spectra fitting: one low-frequency, and two high-frequency modes. The fit quality for T = 100 K is seen on the Fig. 5(b)-(d). One can see that the 145 cm-1 mode as well as the general shape of the reststrahlen band at 450 - 600 cm-1 are satisfactorily reproduced, confirming a suggestion that only 3 strong phonon modes are present. A bump at about 620 cm-1 is fitted without invoking of additional Lorentzians: it results from the non-collinearity of the mode and the incident radiation polarizations.
The temperature dependence of the phonon parameters is presented at Fig. 11. Unlike the case of the modes, there is no significant difference in the temperature dependence of parameters of the low- and high-frequency modes. All modes are monotonically hardening with cooling down, with some positive kink at for the mode and negative kink for the mode. The plasma frequencies of all modes have slight maximum at the transition temperature. Two high frequency modes are much more intense than the mode. The linewidth of all the modes doesn’t decrease with cooling down. Instead, it increases at low temperatures. One should be careful in a straightforward interpretation of this result, because the lineshape is not described perfectly, especially one of the high-frequency modes. The true linewidth is better seen from the optical conductivity graph (see below). The oscillator polarization angles do not significantly change with frequency. The maximum angle change is 4 - 5∘, while the change of the relative angle between different oscillators polarization is less than 2 ∘. One can state that within experimental errors oscillators angles almost doesn’t change.
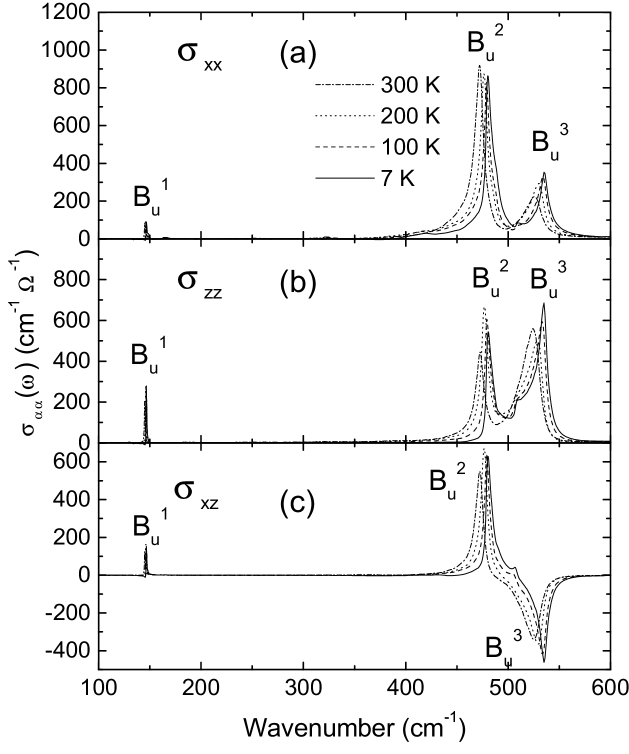
To investigate the true shape of the principal phonon modes and additional structures, the KK analysis of the ac-plane data for the mentioned set of temperatures was implemented in the extended form [22]. At Fig. 12 all the components of the optical conductivity tensor are plotted for selected temperatures. Note that the off-diagonal component may have any sign unlike the diagonal components and which must be positive.
The polarization angle of the mode is 35∘, which is close to the direction of the [101] chains. The mode is almost orthogonal to the mode: the angle is -55∘, which is close to the [10] chains direction. Therefore, with some approximation one can state, that the and modes are stretches of the [101] and [10] chains correspondingly, which is in agreement with several lattice dynamical calculations[10, 11, 12, 23, 24]. Note, that such orthogonality is not determined by the crystal symmetry. The polarization angles of both modes are almost temperature-independent.
VI Discussion
A Comparison with previous results
A comparison of our data with previosly reported results of IR studies of CuO cannot be direct, because we measured spectra, where the and modes are separated and excited in purely transverse regime. All the quantitative and even qualitative deviations with previous data (see below) can be ascribed to a different way of spectra measurement and analysis.
At the Table I the phonon frequencies at room temperature previously obtained by means of infrared spectroscopy [10, 11, 12, 13] as well as neutron scattering [23] are collected. It is seen that the most serious discrepancy between reported values of phonon frequencies takes place for modes , and , which are very intense and manifest the largest LO-TO frequency splitting. Pure TO mode should have the lowest possible frequency, which is in nice agreement with the current result: our reported frequencies are smaller than those reported in other IR spectroscopy papers. One should mention a much better agreement between our data and the results of neutron scattering experiments[23], where characteristics of pure TO modes were determined as well.
The softening of the mode was reported by Homes et al [13], who observed a sudden drop of the phonon frequency at the Néel transition from 450 to 430 cm-1, i.e. 5 %. Our data qualitatively confirm this interesting result. We observe even stronger effect: the TO frequency drops from 410 to 370 cm-1 ( 10 %), which is twice as large as was reported (Fig. 6).
Ref. [13], was thus far the only paper, to our knowledge, where IR spectra of single-crystal CuO at low temperatures were studied. Authors didn’t report any new IR-active modes below the Néel temperature; it was implied, that no additional lines are present at higher temperatures either. However, an absence of extra IR-active modes is quite strange, if one compares it with an observation of at least 5 ”unexpected” lines in the Raman spectra[15]. Conversely, according to our data, several ”extra” modes are present in IR spectra in the whole 7 - 300 K frequency range. We believe, that better orientation of the wave vector and polarization of the incident radiation may facilitate observation and analysis of minor IR-active modes.
B The mode anomaly
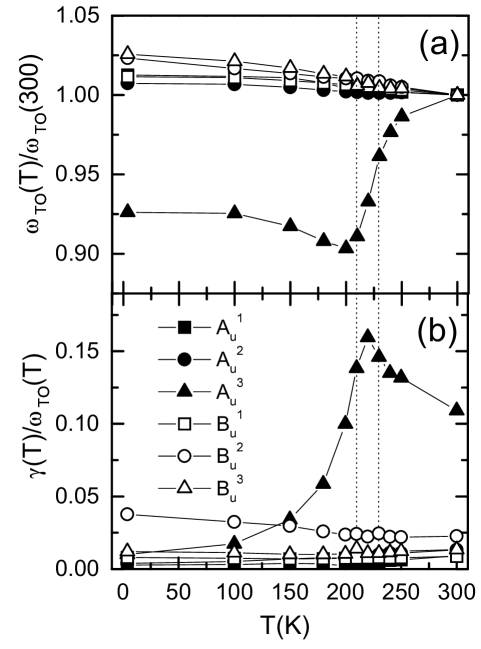
The mode among other principal IR-active modes behaves in the most anomalous way. It is demonstrated at Fig. 13, where relative RT-normalized TO frequencies and relative linewidths of all 6 principal modes are plotted together on the same graph. A close relation between magnetic ordering transition at 213 - 230 K and temperature transformations of this mode is without any doubt.
At 300 K and, especially, at the transition temperature the mode is anomalously broad (12 - 15 %), which indicates, that it is strongly coupled to some system quasiparticles. The most probable candidates are the low-energy magnetic excitations. If one propose, that there is a strong coupling between spin excitations and the lattice mode, the temperature transformations of the mode can be explained by reconstruction of the magnon spectrum upon cooling down below the Néel temperature. It is well established[3, 4, 6], that spin correlations in the AFM [10] chains are present well above the Néel temperature. At high temperatures one can consider the magnetic interaction to be of quasi 1D character. In the 1D Heisenberg AFM chains with S=1/2 and exchange there is a continuum of triplet excitations with lower and upper boundary curves[25, 26] and . A large linewidth of the mode can be explained by its interaction with continuum of magnetic excitations. Below the Néel point an exchange interaction in another directions gives rise to long-range magnetic ordering and a continuum of spin excitations should collapse to the magnon dispersion curves, which, in turn, results in narrowing of the phonon mode.
The reason for an exceptionally strong interaction of the mode with spin excitations one should look for in analysis of its eigenvector. Several lattice dynamical calculations were performed [10, 11, 12, 23, 24] which yielded the lattice mode eigenvectors. According to results of all the calculations this mode is characterized by the largest displacement of the oxygen atoms along the b-axis. It results also in a large dipole moment of this mode. As a consequence, the Cu-O-Cu chain angle experiences the largest variation, when the mode is excited. The copper spins are coupled via the superexchange interaction, which is very sensitive to the Cu-O-Cu angle. In the [10] chains the angle is equal to 146∘ (Fig. 2), which is close to the 180∘ superexchange. It gives a negative exchange constant and AFM interaction. However, the 90∘ superexchange is expected to be positive[27] (an indirect confirmation is the ferromagnetic exchange along the [101] chain with angle equal to 109∘), and there exists some intermediate angle, where the superexchange is changing sign. Therefore, the motion of atoms, corresponding to excitation of the mode can significantly vary the value of the superexchange coupling constant. A strong chain bending probably could alternate the exchange sign.
Due to energy and momentum conservation a zone-center phonon can couple to a pair of magnons (bi-magnon) having opposite wave-vectors and one-half frequency of the phonon. Another option is interaction with a single zone-center optical magnon of the same energy. The magnon dispersion curves has been studied by inelastic neutron scattering [3, 6]. One acoustic and one optical branch were observed; the energy of optical magnon at the point is 5.6 THz (187 cm-1), which is very close to one-half of the mode frequency (370 - 380 cm-1 at low temperatures), while no optical magnons near 370 - 410 cm-1 were observed. Therefore, the ”bi-magnon” or, in particular ”optical bi-magnon” scenario of resonant phonon-magnon coupling is the most probable. A more detailed theory of this effect has to be fabricated.
C Other signatures of spin-phonon interaction
The anomalous properties of the mode is not the only manifestation of the spin-phonon interaction in CuO (although the most prominent one). Other modes also demonstrate some anomalies, most likely related to the magnetic ordering.
One type of anomalies is unusually strong hardening of some ”extra” modes below . The most outstanding example is reported in this work hardening of the 690 cm-1 mode from 650 cm-1 at 150 K to 690 cm-1 at 7 K and strong hardening of the the Raman-active 240 cm-1 mode found by Chen et al [15]. To our mind, these effects are related. We would follow the idea of explanation given in Ref. [15]. The phenomenon can be viewed as a non-resonant spin-phonon interaction, when spin products in the Heisenberg Hamiltonian can be approximated by their effective averages. In this case the temperature dependence of the phonon frequency is expressed by:
| (13) |
The coefficients are characteristics of spin-phonon interaction; in principle, they may have any sign, depending on the eigenvector of the particular phonon mode. The mode strong hardening is supposedly due to the second ”spin” term: magnetic ordering gives additional lattice rigidity.
The same phenomenon is possibly responsible for another anomaly, namely, the change of slope of the principal phonon modes at the Néel point (see Figs. 6 and 11). It is seen that for the modes , and the slope is higher in the AFM phase, while for the mode the slope is higher at ; for the mode it doesn’t change at all. Such a differences can be explained by different values and signs of coefficients .
D ”Extra” zone-center modes and zone folding
Activation of additional phonon modes in infrared and Raman spectra is usually a signature of unit cell multiplication and zone folding. Such activation is in effect in CuO. As is stated above, several ”extra” IR-active modes are observed. In the Raman spectra 5 new modes were detected at low temperatures [15]. Authors related their frequencies to the phonon dispersion curves obtained by inelastic neutron scattering [23] at the zone boundary point. In Ref. [15] this point was referred to as . We follow the original notation and designate it by X (see Fig. 4 in Ref. [23]).
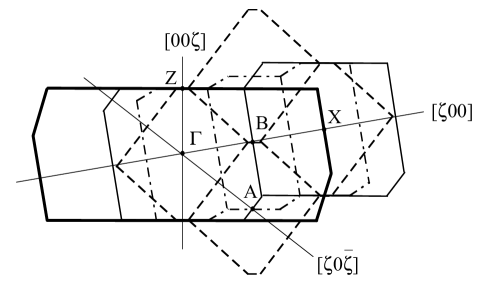
At Fig. 14 the Brillouin zones corresponding to several schemes of the unit cell multiplication are drawn (a projection to the ac-plane). In these schemes different symmetry points fold to the zone center. It is easy to prove, that folding of the X-point to the zone center is equivalent to disappearance of the non-trivial translation (a+b)/2, or base-centering of the space-group. In other words, activation of the phonons from the X point requires that the unit cell should become the primitive one.
In the Table II ”extra” IR active and Raman-active mode frequencies are collected. Each mode frequency is related to close phonon energy (if any) in symmetry points X(1, 0, 0), A(1/2, 0, -1/2), B(1/2, 0, 0) or C(0, 1/2, 0) at 300 K. To make comparison more reliable, the ”extra” modes frequencies are taken at temperature as close as possible to 300 K. One can see, that many modes (all Raman-active and several IR-active ones) have close analogs at the X point. At the same time, other IR-active modes (147 cm-1, 165 cm-1, 475 cm-1, 480 cm-1) could be phonons from the A point, or, in some cases, from the B or C points. The 690 cm-1 mode is a special case: due to strong hardening of this mode with cooling and failure to observe it at high temperatures, the comparison to the 300 K dispersion data is impossible. In addition, the mode energy is higher than the upper limit of the reported frequency region in the neutron scattering experiments (20 THz, or 667 cm-1). The phonon dispersion curves at low temperatures in broader energy interval are desirable.
Although some ”extra” modes have analogs in the B or C points, folding of the A and X points to the zone center (the A + X folding scheme) is the simplest option to explain appearance of all ”extra” modes. It corresponds to the ”diagonal” doubling of the unit cell {a, b, c} {a+c, b, a-c} (see Fig. 14). This scenario looks attractive, because new crystal axes correspond to principal anisotropy directions for several physical properties (exchange constants, sound velocity, principal dielectric axes etc.), and the unit cell is the same as the magnetic unit cell in the AFM phase [2].
In the framework of this scenario the principal mode, the 485 cm-1 and the 425 cm-1 ”extra” modes should be the phonon modes from the points , A and X correspondingly belonging to the same dispersion branch, according to ”rigid-ion” modelling of dispersion curves by Reichardt et al [23]. It is in a good agreement with some similarity of temperature dependences of parameters of these modes (see Figs. 6 and 7).
In summary, we propose, that in reality the crystal structure is more complicated, than was considered before; it is the case, to our mind, already at room temperature, because most of ”extra” IR-active modes are present in the whole temperature range. On the base of the fact that IR-active and Raman-active modes have different frequencies one can suggest that the crystal space-group is still centro-symmetric, although the copper atoms are not necessarily located in the position. However, the alternative space-group for the CuO, proposed by Asbrink and Waskowska, is not centro-symmetric (C); the solution of this mismatch is unclear.
One of the central issues is the mechanism of the unit cell multiplication and formation of superstructures. There exist a variety of examples of such effect, when ”extra” IR and/or Raman modes are emerging, which are undoubtedly the zone-boundary folded phonons. In the extensively studied compounds CuGeO3 and -NaV2O5 the unit cell doubles as a result of spin-phonon interaction, and new IR modes are observed [28, 29]. Another example present compounds with a charge disproportionation, out of those the BaBiO3 is probably the most famous one. In this system the bismuth is disproportionated according to scheme: 2 Bi4+ Bi3+ + Bi5+, and atoms in different valence states form superstructure, which is a reason for ”extra” quite strong IR line[30]. One cannot exclude a collective Jahn-Teller effect as an engine of superlattice formation. The question about particular type of spin-charge-lattice ordering in CuO is open. It could be closely connected with formation of inhomogeneity phases in cuprates.
E High-frequency dielectric function
The reflectivity and the dielectric function in the mid-infrared range well above the maximum phonon energy ( 0.08 eV) but below the optical gap ( 1.3 eV) are determined by the electronic polarizability. We observe significant difference between values of mid-infrared reflectivity for different polarizations. It results in an appreciable anisotropy of the high-frequency dielectric tensor. The temperature dependence of the mid-IR reflectivity is small, therefore, we discuss only room-temperature data. All the components of the can be found from the dispersion analysis of spectra, see formulas (1), (2).
The smallest value of is observed along the b-axis: ; it is apparently one of the prinicipal values of the dielectric tensor. The diagonalization of the tensor gives directions and values of maximal and minimal levels of within the (ac)-plane. The maximal value is observed along the direction, corresponding to the angle , the minimal value is along the orthogonal direction for . One can see that direction is very close to direction of the [10] chains () while almost exactly corresponds to . In other words, the high-frequency dielectric constant within the (ac)-plane is maximal along the [10] direction, and minimal along the [101] direction. Authors [31] have measured the high-frequency dielectric function of polycrystalline sample by the ellipsometric method. Their reported value is in a good agreement with the average quantity obtained here.
F Effective charges
Another important value derived from infrared spectra is an effective ionic charge. There are several definitions of the effective charge. We would mention the Born, or ”transverse” charge , the Szigeti charge and the Scott charge [32]. The ”transverse” charges can be calculated using the sum-rule:
| (14) |
where is the primitive cell volume, the sum in the left side is over IR-active modes, the sum in the right side is over all atoms in the primitive cell. For the binary compound this relation in combination with the electric neutrality condition directly yields the ”transverse” charge of both atoms. In CuO due to anisotropy the transverse charge slightly differs for different directions. The values along the [010] (b-axis) the and the directions at room temperature are 1.92, 2.04 and 2.10 correspondingly (the are taken from the Figs. 6, 11).
The Scott charge and Szigeti charges are related to the ”transverse” charge:
| (15) |
The value of divided to the nominal valence is often considered as the degree of ionicity [32]. For the CuO it appears to be about 40 %. The Szigeti charge is useful in the context of the polarized point ions model [33]. In literature all these charges are used, so that it is reasonable to report all of them.
In the Table III oxygen effective charges for the CuO along with other related copper oxides (Cu2O, La2CuO4, Nd2CuO4 and YBa2Cu3O6) are collected. It is seen that charge values in CuO reasonably agree to the corresponding values in other relevant oxides.
VII Conclusions
We have measured far- and mid-infrared reflectivity spectra of monoclinic CuO from the (010) and (001) crystal faces in wide temperature range. We obtained for the first time characteristics of pure TO and modes separately. Our data finally confirm that there are 3 + 3 intense modes, in accordance with prediction of the FG-analysis for the space-group.
We report existence of several ”extra” less intense IR-active modes in CuO. Analysis of the phonon dispersion curves leads to the conclusion that each ”extra” IR-active as well as reported earlier [15] Raman-active mode could be folded phonon from either X (1, 0, 0) or A (1/2, 0, 1/2) symmetry points. Such folding is compatible with the ”diagonal” doubling of the unit cell with the new basis {a+c, b, a-c}. So the space-group in reality is lower than that was considered, but still centro-symmetric.
The 690 cm-1 ”extra” IR-active mode exhibits anomalous hardening, similar to behaviour of the 240 cm-1 Raman mode; the reason could be in additional rigidity of lattice due to magnetization, a special manifestation of the spin-phonon interaction. Another effect, which can be explained in a similar way, is a slope change of the phonon frequencies vs. temperature at the Néel point.
The anomalous softening and narrowing of the mode 410 cm-1 we explain by its strong resonance coupling to the optical or acoustic bi-magnons. Reconstruction of magnetic excitations spectrum at the AFM transition strongly affects the phonon characteristics.
In summary, the CuO demonstrates a variety of anomalous properties, which show complex interplay of spin, charge, and phonon subsystems already in the simplest copper(II) oxide. A further insight into physics of CuO may contribute to elaboration of non-contradictory picture of antiferromagnetism and superconductivity in the high- cuprates.
Acknowledgements.
This investigation was supported by the Netherlands Foundation for Fundamental Research on Matter (FOM) with financial aid from the Netherlandse Organisatie voor Wetenschappelijk Onderzoek (NWO). The activity of A.B.K., E.A.T. and A.A.B. was also supported by the Russian Foundation for Basic Research (RFBR), grant No 99-02-17752. A lot of thanks we address to H. Bron and F. van der Horst (University of Groningen) for invaluable help in samples characterization.REFERENCES
- [1] J.Zaanen, G.A.Sawatzky and J.W.Allen, Phys. Rev. Lett., 55, 418 (1985).
- [2] B.X.Yang, T.R.Thurston, J.M.Tranquada and G.Shirane, Phys. Rev. B 39, 4343 (1989).
- [3] M.Ain, W.Reichardt, B.Hennion, G.Pepy and B.M.Wanklyn, Physica C 162-164, 1279 (1989).
- [4] M.O’Keeffe and F.S.Stone, J.Phys.Chem.Solids 23, 261 (1961).
- [5] U.Kobler and T.Chattopadhyay, Z. Phys. B 82, 383 (1991).
- [6] T.Chattopadhyay, G.J.McIntyre, C.Vettier, P.J.Brown and J.B.Forsyth, Physica B 180, 420 (1992).
- [7] Z.V.Popovic, C.Thomsen, M.Cardona, R.Liu, G.Stanistic, R.Kremer and W.Konig, Solid State Commun. 66, 965 (1988).
- [8] J.Hanuza, J.Klamut, R.Horyn and B.Jezowska-Trzebiatowska, J. Mol. Struct. 193, 57 (1989).
- [9] L.Degiorgi, E.Kaldis and P.Wachter, Physica C 153-155, 657 (1988).
- [10] G.Kliche and Z.V.Popovic, Phys. Rev. B 42, 10060 (1990).
- [11] S.Guha, D.Peebles and J.T.Wieting, Bull. Mater. Sci 14, 539 (1991); S.Guha, D.Peebles, T.J.Wieting, Phys. Rev. B 43, 13092 (1991).
- [12] S.N.Narang, V.B.Kartha, N.D.Patel, Physica C, 204, 2 (1992).
- [13] C.C.Homes, M.Ziaei, B.P.Clayman, J.C.Irwin and J.P.Franck, Phys. Rev. B 51, 3140 (1995)..
- [14] M.V.Belousov and V.F.Pavinich, Opt. Spectrosc. 45, 771 (1978); M.V.Belousov and V.F.Pavinich, Opt. Spectrosc. 45, 881 (1978); V.F.Pavinich and V.A.Bochtarev, Opt. Spectrosc. 65, 640 (1988).
- [15] X.K.Chen, J.C.Irwin and J.P.Franck, Phys. Rev. B 52, R13130, (1995).
- [16] S.Asbrink and L.-J.Norrby, Acta. Crystallogr. B 26, 8 (1970).
- [17] D.L.Rousseau, R.P.Baumann and S.P.S.Porto, J.Raman Spectrosc.10, 253 (1981).
- [18] S.Asbrink and A.Waskowska, J.Phys.: Condens. Matter 3, 8173 (1991).
- [19] A.A.Bush et al, to be published.
- [20] G.N.Kryukova, V.I.Zaikovskii, V.A.Sadykov, S.F.Tikhov, V.V.Popovskii and N.N.Bulgakov, J. Sol.State Chem. 73, 191 (1988).
- [21] A.B.Kuz’menko, E.A.Tishchenko and V.G.Orlov, J. Phys.: Condens. Matter, 8, 6199 (1996).
- [22] A.B.Kuz’menko, E.A.Tishchenko and A.S.Krechetov, Opt. Spectrosc., 84, 402 (1998).
- [23] W.Reichardt. F.Gompf, M.Ain and B.M.Wanklyn, Z. Phys. B 81, 19 (1990).
- [24] J.C.Irwin, T.Wei and J.Franck, J.Phys.: Condens. Matter 3, 299 (1991).
- [25] J.des Cloizeaux, and J.J.Pearson, Phys.Rev. 128, 2131 (1962).
- [26] T.Yamada, Progr. Phys. Jpn. 41, 880 (1969).
- [27] J.Goodenough, Magnetism and Chemical Bond, John Wiley & Sons, New York, (1963).
- [28] A.Damascelli, D. van der Marel, F.Parmigiani, G.Dhalenne and A.Revcolevschi, Phys. Rev. B 56, R4863 (1997).
- [29] M.N.Popova, A.B.Sushkov, A.N.Vasil’ev, M.Isobe, and Y.Ueda, JETP Lett. 65, 743 (1997).
- [30] S.Uchida, S.Tajima, A.Masaki, S.Sugai, K.Kitazawa and S.Tanaka, J. Phys. Soc. Jpn. 54, 4395 (1985).
- [31] T.Ito, H.Yamaguchi, T.Masumi and S.Adachi, J.Phys.Soc.Japan. 67, 3304 (1998).
- [32] F. Gervais, Sol. State. Comm., 18, 191 (1976).
- [33] B.Szigeti, Proc. Roy. Soc., A258, 377 (1960).
- [34] C.Noguet, C.Schwab, C.Sennett, M.Sieskind and C.Viel, J. Physique 26, 317 (1965).
- [35] F.Gervais, P.Echegut, J.M.Bassat and P.Odier, Phys. Rev. B, 37, 9364 (1988).
- [36] N.V.Abrosimov, A.V.Bazhenov, Sov. Phys.: Solid State, 33, p.258 (1991).
- [37] A.V.Bazhenov, V.B.Timofeev, Supercond.: Phys., Chem., Technol., 3, p.s27 (1990).
| Mode | Kliche | Guha | Naranga | Homes | Reichardtb | This |
|---|---|---|---|---|---|---|
| et al [10] | et al [11] | et al [12] | et al [13] | et al [23] | work | |
| 161 | 168 | 163 | 166.5 | 160 | 160.5 | |
| 321 | 325 | 324 | 323.7 | 326 | 321.5 | |
| 478 | 465 | 444 | 450.0 | 423 | 409.0 | |
| 147 | 150 | 147 | 147.6 | 142 | 144.9 | |
| 530 | 510 | 515 | 516.0 | 480 | 468.0 | |
| 590 | 570 | 586 | 566.0 | 520 | 522.5 |
| IR/Raman[15] data | Inelastic neutron scattering data [23] | |||||
| Acti- | Frequ- | X | A | B | C | |
| vity | ency | (1,0,0) | (0.5,0,0.5) | (0.5,0,0) | (0,0.5,0) | |
| IR | 690 | ? | ? | ? | ? | |
| IR | 630 | 630 | - | 633 | - | |
| Raman | 507 | 513 | - | - | - | |
| IR (E b) | 480 | - | 485 | 473 | 487 | |
| IR (E ac) | 475 | - | 485 | 473 | 487 | |
| IR | 430 | 437 | - | - | - | |
| Raman | 331 | 330 | - | - | - | |
| Raman | 240 | 243 | - | - | - | |
| Raman | 218 | 220 | 223 | - | - | |
| Raman | 175 | 177 | - | - | - | |
| IR | 165 | - | 167 | - | - | |
| IR | 147 | - | 143 | - | 150 | |
| Compound | ||||
|---|---|---|---|---|
| CuO ( ) | 5.9 | 0.76 | 0.81 | 1.96 |
| CuO ( ) | 6.2 | 0.75 | 0.82 | 2.06 |
| CuO ( ) | 7.8 | 0.64 | 0.76 | 2.12 |
| Cu2O [34] | 6.5 | 0.68 | 0.75 | 1.91 |
| La2CuO4 () [35] | 4.1 | 1.0 | 1.0 | 2.0 |
| Nd2CuO4 () [36] | 4.2 | 1.1 | 1.1 | 2.2 |
| YBa2Cu3O6 () [37] | 4.5 | 0.8 | 0.8 | 1.7 |