†
Josephson plasma resonance in (BEDT-TTF)2Cu(NCS)2
Abstract
A cavity perturbation technique is used to study the microwave response of the organic superconductor (BEDT-TTF)2Cu(NCS)2. Observation of a Josephson plasma resonance, below Tc (10 K), enables investigation of the vortex structure within the mixed state of this highly anisotropic, typeII, superconductor. Contrary to previous assumptions, frequency dependent studies (28 153 GHz) indicate that the squared plasma frequency () depends exponentially on the magnetic field strength. Such behavior has been predicted for a weakly pinned quasi-two-dimensional vortex lattice Bulaevskii et al. Phys. Rev. Lett. 74, 801 (1995), but has not so far been observed experimentally. Our data also suggests a transition in the vortex structure near the irreversibility line not previously reported for an organic superconductor using this technique.
pacs:
PACS numbers: 71.18.+y, 71.27.+a, 74.25.NfIt is widely acknowledged in the layered highTc superconductors (HTSs) and, more recently, in the layered organic superconductors (OSs), that Josephson coupling is responsible for interlayer transport of superconducting pairs [2, 3, 4, 5, 6]. Magneto-optical experiments have been carried out by many groups, and for a wide range of materials, e.g. Bi2Sr2CaCu2O8+δ (BSCCO) [2, 4] YBa2Cu3O6-y (YBCO) [4], as well as several OSs [5, 6]. In each case, these experiments have demonstrated that a Josephson plasma resonance (JPR) is observed in the inter-layer conductivity, and that this resonance may be used as an extremely sensitive tool for probing the vortex structure/dynamics.
(BEDT-TTF)2Cu(NCS)2 (BEDT-TTF denotes bis-ethylenedithio-tetrathiafulvalene, or ET for short) is one in a series of highly anisotropic OSs, characterized by a layered structure. The conducting layers consist of a checkerboard pattern of face-to-face ET dimers, with nearest neighbor dimer pairs oriented perpendicularly [7]. These donor sheets exhibit near isotropic 2D conductivity within the bc plane. The insulating layers form from weakly bonded arrays of shaped Cu(NCS)2 anions. The anisotropy parameter in the normal state, given by the ratio of the in-plane to out-of-plane conductivities , is . In the superconducting state, the anisotropy parameter is given by , where and are the London penetration depths for AC currents induced parallel () and perpendicular () to the conducting layers respectively [8]. Such a large anisotropy makes this OS a prime candidate to study Josephson coupling, and changes in this coupling upon the introduction of supercurrent vortices into the sample through the application of an external magnetic field.
In highly anisotropic superconductors, it is expected that the plasma mode for the low conductivity direction () lies below the superconducting gap i.e. . Below the critical temperature Tc, this plasma mode dominates the a-axis microwave response with frequency, , which depends on the maximum inter-layer (or Josephson) current Jm(B,T), through the expression
| where (1) |
Jm = J(r),
is the crystal inter-layer spacing, is the high frequency permittivity, is the flux quantum, is the gauge-invariant phase difference between layers and + 1 at a point r = x,y in the bc (high conductivity) plane, and and denote thermal and disorder averages. Jo(T) = (T) is the maximum inter-layer Josephson current density at zero field (BDC = 0), and is the inter-layer London penetration depth [9, 10].
An important property of the Josephson coupling is the influence of an externally applied magnetic field on the collective plasma oscillation frequency . When the applied DC magnetic field is parallel to the least conducting axis, a mixed state is created in which the field penetrates the sample in quantized flux tubes, generating supercurrent vortices in the superconducting layers. depends explicitly on the vortex structure within this mixed state and is, thus, responsible for the field dependence of the resonance frequency [9]. If the flux tubes form straight lines along the a-axis, = 1, and maximum Josephson coupling occurs. However, in the presence of disorder, e.g. as a result of crystal defects which create vortex pinning sites, or through thermal fluctuations, the flux tubes will deviate from straight lines. This suppresses the maximum Josephson current. It is when AC currents are excited between the layers, at a frequency which corresponds to the natural frequency of the plasma oscillation (), that a sharp resonance is observed. Consequently, this resonance frequency provides a direct measurement of the maximum inter-layer current density, which in turn can be used to probe vortex structure in the mixed state.
We have carried out experiments on several (ET)2Cu(NCS)2 single crystals. The dimensions of each crystal were approximately mm3, with the low conductivity axis the shortest of the three. We found that all samples gave qualitatively similar results. Microwave impedance measurements were carried out using a cavity perturbation technique described elsewhere [11]. We used the TE01 modes of cylindrical copper cavities ( = 1, 2, 3, etc.), and the TE112 mode of a rectangular copper cavity. The use of a range of cavities enabled wide frequency coverage from GHz. Typical loaded Quality factors for these cavities for a given measurement were approximately to . The samples were placed in one of two configurations within the cavity, which correspond to two different microwave field configurations [11]. The first position induces strictly in-plane currents, with the AC microwave magnetic field perpendicular to the layers (HAC bc). The second configuration, with HAC bc, generates both in-plane and inter-layer Josephson currents; for a discussion of the electrodynamics of organic superconductors, see ref [12]. Both cavity positions were such that the DC magnetic field (BDC) was perpendicular to the conducting planes, i.e. BDC a. Temperature control was achieved using a small resistive heater attached mechanically to the cavity, and a Cernox thermometer. For inter-layer measurements, DC magnetic fields were generated using an 8 T superconducting solenoid. The in-plane measurements were conducted in the 33 T resistive magnets at the National High Magnetic Field Laboratory in Tallahassee, FL. In both cases, field sweeps were made at a rate of approximately 1 T per minute.
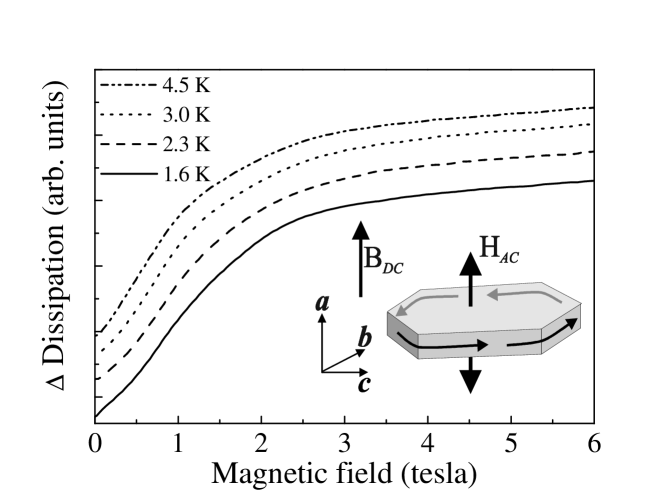
Figure 1 shows dissipation due to in-plane currents, plotted versus magnetic field, for temperatures in the range 1.6 to 4.5 K; the frequency is 44.4 GHz and the traces are offset for clarity. As expected for this configuration, the dissipation ( surface resistance) increases monotonically with increasing DC field. Indeed, the surface resistance approximately follows a B behavior, consistent with flux-flow type dissipation [13]. It is interesting to note the lack of (or extremely weak) temperature dependence in the various traces in Fig. 1 [14]. This is unexpected given that Hc2 ( T at 2 K) varies by at least 0.5 T over the equivalent temperature range. At present, the origin of this behavior is not known and will form the basis for future investigations. The main point to note from the in-plane measurements is the lack of any resonant features (see Fig. 2 below). These findings are in stark contrast to recent studies by Schrama et al. [15], where it is claimed that an observed resonance is attributable to the in-plane response.
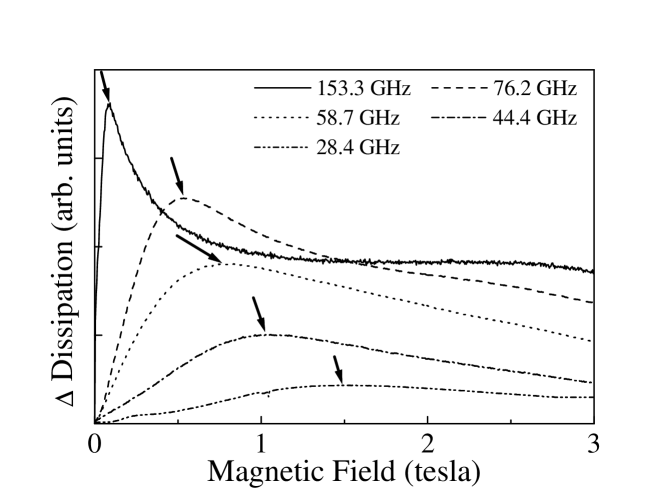
The second configuration, in which a mixture of in-plane and inter-layer currents are exited (i.e. H bc), gives very different results from those shown in Fig. 1. Fig. 2 plots dissipation versus magnetic field for several frequencies in the range GHz; the temperature is 2.0 K in each case. A pronounced resonant feature can now be seen (indicated by arrows), which becomes sharper and moves to lower magnetic field upon increasing the frequency. Due to the absence of this resonance in the purely in-plane response (Fig. 1), we conclude that this resonance is related to dissipation within the sample caused by inter-layer currents dissipation , and that insufficient care was taken to separate these contributions in the work of Schrama et al. [15, 16]. The anti-cyclotronic nature of the resonances shown in Fig. 2 has been well documented in the HTSs [17], and has also been observed in previous work on this OS [5], though only two frequencies were used. The wider frequency range employed here clearly confirms the anti-cyclotronic trend.
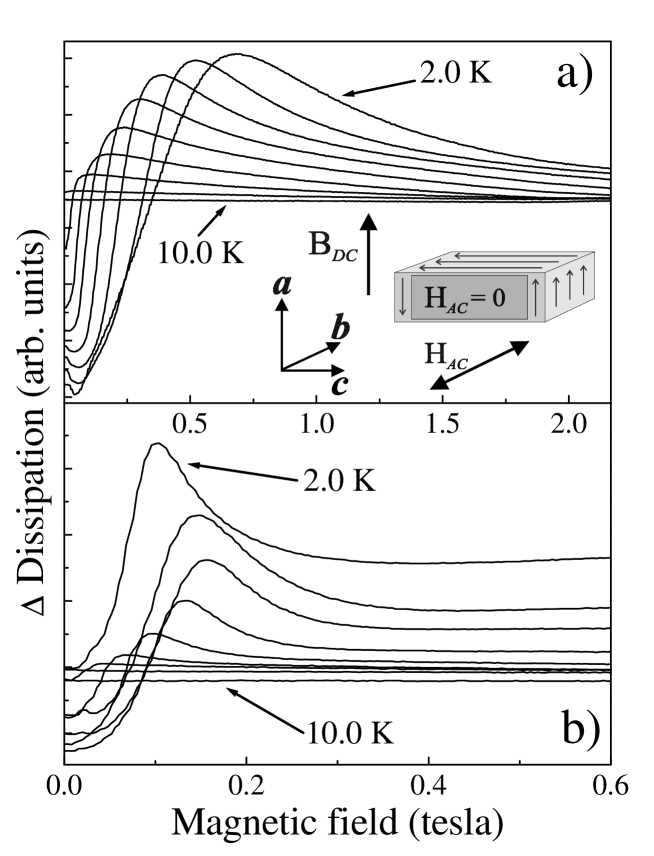
Figures 3a and b show the temperature dependence of the resonance for = 76 and 111 GHz, respectively. Note that, as the temperature increases toward the superconducting to normal transition (Tc 10 K), the resonances vanish. This observation would seem to indicate that it is the superconducting carriers that are responsible for the sharp dissipative peak. This fact, along with the anti-cyclotronic nature of the resonance, and the AC current polarization dependence of the effect (i.e. resonances are not observed for H bc), leads us to conclude that the resonance indeed corresponds to a Josephson plasma mode. Note, no apparent hysteresis was observed for the up and down sweeps of the magnetic field in this material, hence only up sweeps are plotted for clarity.
Looking more closely at the 76 GHz data in Fig. 3a, we see that the resonance peak position decreases monotonically with respect to increasing temperature. This behavior is consistent with previous observations in this OS [5]. However, we see an entirely different temperature dependence in the tail of the resonance the structure in the low field tail ( 0.1 T) shows an initial increase in field with increasing temperature, reaching a maximum, then decreasing back to zero field as Tc is approached. This so-called ”cusp” behavior has been observed in some HTSs [17], but never in any of the OSs.
For the 111 GHz data in Fig. 3b, we see a similar resonance structure, but now the cusp behavior can be seen in the position of the resonance rather than its tail. The phenomenon responsible for the cusp has not changed, however, the JPR has been pushed to lower field by working at higher frequencies, thereby moving the resonance position into the cusp regime.
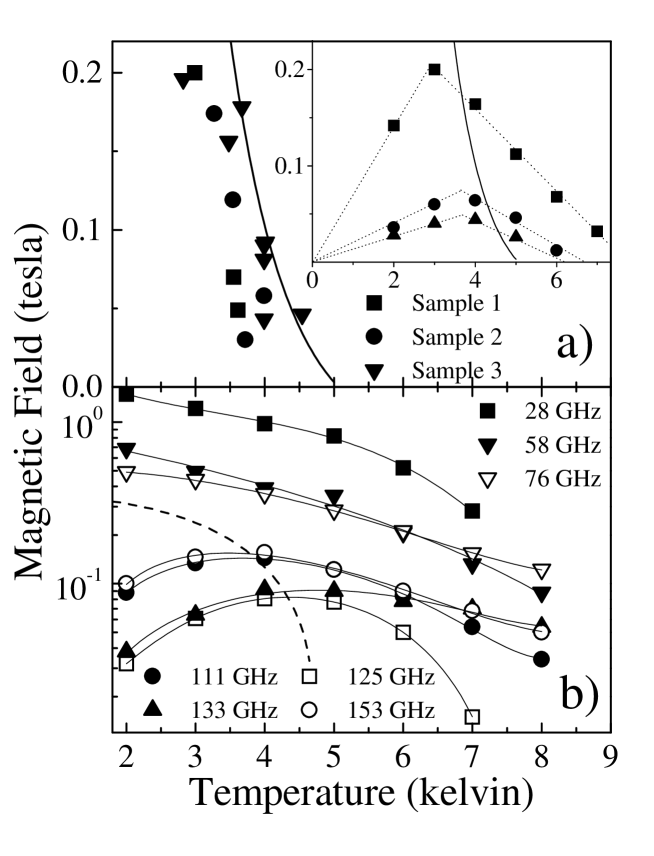
Measurements spanning a broad frequency range, as shown in Fig. 4, indicate that the cusp behavior is confined to a relatively narrow field and temperature domain. In fact, comparison of the cusp position with published magnetization data [18, 19] show that it falls along, or very near to, the irreversibility line. Due to the change in nature of the temperature dependence of the JPR at the cusp position, we conclude that there is a transformation in the vortex structure at (or near) the irreversibility line.
It is well known that a dimensional crossover phenomenon between a three-dimensional flux-line-lattice and a quasi-two-dimensional (Q2D) pancake vortex lattice occurs at approximately 10 mT in (ET)2Cu(NCS)2 [20, 21]. Thus, it is assumed that, over a large portion of the superconducting phase diagram probed in this work (and shown in Fig. 4), there is strong disorder in the pancake positions as viewed along the a-axis (least conducting direction). At the same time, however, long range order may be present within the superconducting layers (i.e. a Q2D vortex lattice) below some characteristic melting temperature [Tm(B)]. We propose two possible explanations for the cusp phenomenon, both of which involve transitions in the vortex structure, and both of which account qualitatively for the observed B,T-dependence of the plasma frequency.
One possible explanation for the cusp phenomenon involves a 2D solid to liquid melting transition [22, 23]. This occurs when thermal (or quantum) fluctuations in the positions of the vortices become comparable to the inter-vortex separation, i.e. either when the flux density exceeds a critical value Bm(T), or when the temperature exceeds a critical value Tm(B). Below Bm(T) and Tm(B), in the Q2D pancake vortex lattice phase, random defects will tend to pin each Q2D solid in such a way that there is little correlation between the locations of vortices in adjacent layers, i.e. will be small, and inter-layer Josephson tunneling will be suppressed. Upon increasing the temperature slightly, thermal fluctuations will tend to cause the vortices in each layer to deviate from their mean positions. Provided that these displacements are small compared to the distance between adjacent vortices, the effect of increasing temperature will actually result in an increase in the inter-layer tunneling probability and, hence, an increase in the maximum inter-layer Josephson current. Eventually, upon further increasing the temperature, the vortex lattice melts. In the liquid phase, increased thermal fluctuations (i.e. increasing temperature) will tend to suppress inter-layer tunneling and, hence, the maximum inter-layer Josephson current. Thus, completely opposite temperature dependences of the JPR frequencies are expected in the Q2D solid and liquid phases (see Eq. 1), i.e. exactly as observed experimentally.
Another possible explanation for the cusp phenomenon involves a depinning transition [24, 25] whereby, upon increasing the temperature, thermal fluctuations exceed some critical depinning threshold. As this threshold is approached, one can think of a ”pinned” Q2D vortex lattice performing larger and larger collective displacements from equilibrium, until eventually it becomes completely ”depinned,” or mobile. In this sense, lattice melting and depinning represent qualitatively similar phenomena indeed, under certain conditions, lattice melting and depinning may occur together [25]. However, the physical origin of each transition is very different: in the case of melting, thermal fluctuations overcome the inter-vortex interactions which maintain long range Q2D order; in the case of depinning, thermal fluctuations suppress the influence of random defects, and long range Q2D ordering of the vortices persists. For both cases, one should expect opposing temperature dependences for above and below the respective transitions, since it is pinning that is responsible for the suppression of interlayer tunneling at low temperatures, while the effects of this pinning are absent, or at least greatly diminished (see below), in the high temperature liquid or depinned states.
We can now relate the observed magnetic field and temperature dependence of the resonances to the above discussion. Application of a magnetic field tends to reduce the JPR frequency (B,T) (see discussion below). Thus, for a fixed frequency measurement, a resonance is observed when (B,T) matches the measurement frequency. Consequently, any trend that increases (B,T) will shift the observed resonance to higher magnetic fields, since a stronger field is required to reduce (B,T) so that it matches the measurement frequency. The converse is true for trends which decrease (B,T). Thus, in the pinned Q2D solid phase, increasing temperature will tend to shift the resonance to higher field while, in the liquid or depinned Q2D solid phase, one expects the resonance to move to lower fields upon increasing the temperature. This is precisely the behavior observed in Fig. 4b, where the cusp marks the change in temperature dependence of the resonance.
Next, we consider the frequency dependence of the resonance (at constant temperature). It has previously been assumed for this substance that the frequency of the resonance () obeys a power-law field dependence of the form
|
= AB(T/Tc),
(2) |
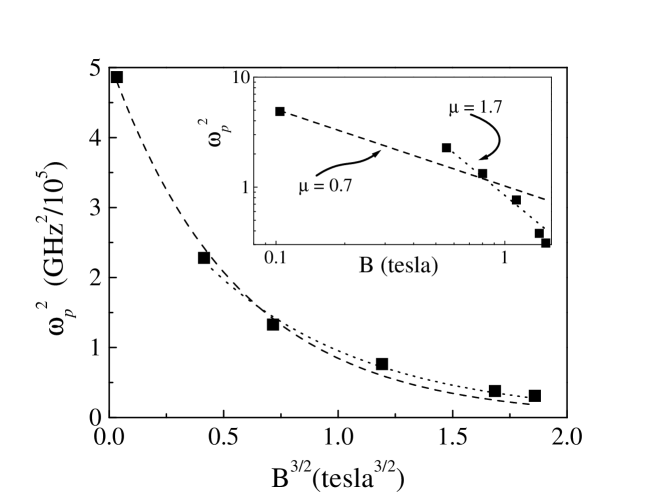
where A is a constant. The inset to Fig. 5 shows two fits to a power-law for T = 2.0 K: the dashed line is a fit to data covering a wide field range; the dotted line is a fit to data above the melting/depinning transition only. The former fit gives a value for the exponent of , which is consistent with previous work where only two data points were available [5]. The latter fit gives a value for the exponent of . Overall, the power-law does not appear to be a good fit, even when restricted to data above the melting/depinning transition, i.e. closer inspection of the inset to Fig. 5 shows that the exponent increases with increasing field. We also note that an exponent is unphysical based on the various theories which predict a power-law field dependence of the squared plasma frequency [10, 26]; of order unity corresponds to little or no correlation between vortices in adjacent layers, while indicates some degree of ordering of the vortices along lines parallel to the a-axis. In the limiting case of a vortex liquid, has been predicted [26], and close to unity has been observed experimentally in BSCCO [2, 3].
In the main panel of Fig. 5, we show two further fits to the data using a week pinning theory developed by Bulaevskii et al. [9], where a decaying exponential field dependence of (B,T) is predicted; the dashed and dotted curves correspond to the same field ranges as the power-law fits discussed above. In this case,
| where (3) |
BD is a de-coupling field, above which inter-layer phase coherent tunneling ceases [27]; is the anisotropy parameter; Ep is a pinning parameter; and is the in-plane penetration depth [10]. Clearly, the above expression yields superior fits to the data over both field ranges (there is only a difference in the fitting parameters obtained from the dashed and dotted curves).
At the present time it is not clear why the Bulaevskii theory, which was developed for a weakly pinned vortex solid, fits our data so well. In particular, since most of the data in Fig. 5 were obtained above the melting/depinning transition, one might expect a 1/B dependence of , as predicted for a vortex liquid phase [26]. One possible conclusion is that quasi-long range 2D order persists in this high temperature regime, and that pinning continues to play a role. Further detailed frequency dependent studies will be required to resolve this issue.
It is interesting to note that, if one adopts the weak pinning theory, it is possible to extract certain sample parameters for comparison with published results. Using = 25, = 100200, and =1 m [8], we find the zero field maximum interlayer current density, Jo = A cm-2. From this, we are able to deduce the interlayer penetration depth, = 90 m, which is on the order of previous measurements [8]. Further, we find a value for the decoupling field, BD = 0.7 T, from which we can extract the pinning parameter Ep = to J2m-4. This range of values is three orders of magnitude lower than the BSCCO measurements discussed in ref. [28]. This is not surprising, since it is well established that the ET salts are considerably cleaner systems than the HTSs, thus having far fewer pinning sites. Moreover, for the weak pinning limit, it has been noted that the in-plane critical current depends on the pinning parameter given above [28]:
|
Jab = (/3)(Ep/3)1/2.
(4) |
Using the range of values above for Ep, we find the critical in-plane current density to be in the range, Jab = A cm-2 to A cm-2, consistent with values obtain by other methods [5]. Thus our measurements have proven consistent with previous work, and seem to agree excellently with the weak pinning theory of Bulaevskii et al. [9].
Finally, we have noted a slight sample dependence in our measurements, as well as some variance compared to other published results [5, 15]. The most notable differences can be found in the resonance field positions for a given frequency and temperature, as is clearly seen in Fig. 4, where several of the curves corresponding to different frequencies lie on top of each other and even cross in one case. This sample dependence is, perhaps, not surprising given the dependence of (B,T) on the pinning parameter, Ep, which is liable to depend on sample quality. However, we also see an apparent scatter in the cusp positions in Fig. 3. At this stage, it is unclear whether this scatter is real, i.e. attributable to sample quality, or whether it is associated with uncertainties introduced during data analysis. Establishing whether there is a sample dependence in the cusp positions could help resolve the nature of the proposed transition in the vortex structure/dynamics; a first order melting transition should not be influenced by sample quality, whereas one would expect a depinning transition to exhibit pronounced sample dependence (see refs. [6, 29], for recent results on the -phase ET salts).
In conclusion, Josephson plasma resonance measurements have provided a wealth of information regarding the superconducting properties of the organic charge transfer salt (ET)2Cu(NCS)2. Due to the extremely clean nature of this material, it is apparent that the power-law field dependence of the squared plasma frequency, as observed in several HighTc compounds, is inapplicable in the present case. Instead, we are able to fit our data with a weak pinning theory, from which we obtain excellent agreement with several well known material parameters, e.g. the inter-layer penetration depth, and the in-plane critical current. This novel technique also allows us to detect subtle changes in the Q2D vortex structure/dynamics. In particular, we see a cusp in the temperature dependence of the plasma frequency (B,T) which may be due to either vortex lattice melting or depinning. Further examination of this cusp should lead to a better understanding of the observed transition, and to the properties of vortex matter in general.
This work was supported by the Petroleum Research Fund (33727-G3) and the Office of Naval Research (N00014-98-1-0538). CPM and JTK acknowledge support through the NSF REU program (NSF-DMR 9820388).
REFERENCES
- [1] email: hill@physics.montana.edu
- [2] Y. Matsuda, M. B. Gaifullin, K. Kumagai, K. Kadowaki, and Y. Mochiku, Phys. Rev. Lett. 75, 4512 (1995).
- [3] Y. Matsuda, M. B. Gaifullin, K. Kumagai, K. Kosugi, K. Hirata, Phys. Rev. Lett. 78, 1972 (1997).
- [4] H. Shibata and T. Yamada, Phys. Rev. B 54, 7500 (1996).
- [5] T. Shibauchi, M. Sato, A. Mashio, T. Tamegai, H. Mori, S. Tajima, and S. Tanaka, Phys. Rev B 55, R11 977 (1997).
- [6] T. Shibauchi, M. Sato, S. Ooi, and T. Tamegai, Phys. Rev B 57, R5622 (1998).
- [7] T. Ishiguro, K. Yamaji, and G. Saito, Organic Superconductors (Springer-Verlag, Berlin, 1998).
- [8] P.A. Mansky, P.M. Chaikin, and R.C. Haddon, Phys. Rev. B 50, 15929 (1994).
- [9] L. N. Bulaevskii, M. P.Maley, and M. Tachiki, Phys. Rev, Lett. 74, 801 (1995).
- [10] L.N. Bulaevskii, V.L. Pokrovsky, and M.P. Maley, Phys. Rev. Lett. 76, 1719 (1996).
- [11] M. Mola, S. Hill, M. Gross, and P. Goy, Rev. Sci. Inst. 71, 186 (2000), and references therein; also cond-mat/9907310.
- [12] S. Hill, cond-mat/0003246 (March 2000); and submitted to Phys. Rev. B.
- [13] M.W. Coffey and J.R. Clem, Phys. Rev. Lett. 67, 386 (1991).
- [14] We used the amplitudes of Shubnikov-de Haas (surface resistance) oscillations, observed at higher magnetic fields (up to 30 T), as an independent means of monitoring the sample temperature, see e.g. S. Hill, S. Uji, P. S. Sandhu, M. Chaparalla, J. S. Brooks and L. Seger, Synth. Met. 86, 1955 (1997).
- [15] J. M. Schrama, E. Rzepniewski, R. S. Edwards, J. Singleton, A. Ardavan, M. Kurmoo, and P. Day, Phys. Rev. Lett. 83, 3041 (1999).
- [16] S. Hill, M. Mola, N. Harrison, and J. Wosnitza, accepted for publication in Phys. Rev. Lett.
- [17] O.K.C. Tsui, N. P. Ong, Y. Matsuda, Y. F. Yan, and J. B. Peterson, Phys. Rev. Lett. 73, 724 (1994).
- [18] M. Lang, F. Steglich, N. Toyota, and T. Sasaki, Phys. Rev. B 49, 15227 (1994).
- [19] T. Sasaki, W. Biberacher, K. Neumaier, W. Hehn, K. Andres, and T. Fukase, Phys. Rev. B 57, 10889 (1998).
- [20] T. Nishizaki, T. Sasaki, T. Fukase, and N. Kobayashi, Phys. Rev. B 54, R3760 (1996).
- [21] S. J. Blundell, S.L. Lee, F. L. Pratt, C. M. Aegerter, Th. Jestadt, B. W. Lovett, C. Ager, T. Sasaki, V. N. Laukhin, E. Laukhina, E. M. Forgan, and W. Hayes, Synth. Met. 103, 1925 (1999); and references therein.
- [22] A. Houghton, R.A. Pelcovits, and A. Sudb, Phys. Rev. B 40, 6763 (1989).
- [23] L. Fruchter, A. Aburto, and C. Pham-Phu, Phys. Rev. B 56, 2936 (1997).
- [24] N. Ltke-Entrup, B. Placais, P. Mathieu, Y. Simon, Phys. Rev. Lett. 79, 2538 (1997).
- [25] V. I Marconi, D. Domnguez, Phys. Rev. Lett. 82, 4922 (1999).
- [26] A. E. Koshelev, L. N. Bulaevskii, M. P. Maley, Phys. Rev. Lett. 81, 902 (1998).
- [27] We note that the decoupling field is quite different from the dimensional crossover field, which represents the point at which ordering of vortices changes over from a 3D line lattice to a Q2D pancake vortex lattice. The former transition represents the magnetic field range above which inter-layer transport ceases to be dissipationless.
- [28] C.J. van der Beek, P. H. Kes, M. P. Maley, M. J. V. Menken, and A. A. Menovsky, Physica C 195, 307 (1992).
- [29] M. Inada, T. Sasaki, T. Nishizaki, N. Kobayashi, S. Yamada, and T. Fukase, J. Low Temp. Phys. 117, 1423 (1999).
Figure captions
Fig. 1. Field dependent dissipation ( surface resistance) due to in-plane currents, at various temperatures, and for /2 = 44.4 GHz (offset for clarity). As expected for flux flow type dissipation, the surface resistance varies approximately as B1/2 for BHc2. This configuration shows no resonant behavior and little temperature dependence. The inset depicts the geometry of the crystal, the orientations of the applied DC and AC magnetic fields, and the AC current paths around the edges of the sample.
Fig. 2. Magnetic field sweeps, at various frequencies, with HAC bc; the temperature is 2.0 K in each case. Notice the sharp resonance feature, indicated by arrows, which is attributable to inter-layer Josephson currents. Note that the resonance field position, Bo, decreases with an increasing frequency, i.e. anti-cyclotronic behavior.
Fig. 3. Temperature dependence of the Josephson plasma mode for a) /2 = 76 GHz and b) /2 = 111 GHz. Notice that in a), the resonance peak position decreases monotonically as a function of temperature; however, the structure in the tail of this resonance exhibits a ”cusp” behavior. In contrast, due to the anti-cyclotronic behavior of the JPR, the resonance in b) has moved to lower field, and we now see a cusp behavior in the resonance position. The inset depicts the geometry of the crystal, the orientations of the applied DC and AC magnetic fields, and the AC current paths across the surfaces of the sample.
Fig. 4. a) Plot of the cusp positions in field, versus temperature, for several samples and frequencies; the inset plots several representative series of resonance fields (for a single sample and a range of frequencies) versus temperature, and the method used to determine the location of the cusp, i.e. the crossing points of the extrapolated fits (dashed lines) to the low and high temperature behavior. The cusp positions in the main panel of a) are scattered around the irreversibility line (solid line). b) Resonance field Bo vs. temperature for measurements spanning a wide frequency range (28-153 GHz), and for several samples. The higher frequencies exhibit a cusp behavior, while lower frequencies show a monotonic temperature dependence. The dashed line indicates the approximate position of irreversibility line, and the solid lines are guides to the eye.
Fig. 5. When is plotted against B3/2, an exponential decay is observed. This behavior is predicted for a weakly pinned vortex lattice [9]. The dashed line is a fit to all of the data points, while the dotted line represents a fit to data above the melting/depinning transition. Inset: we have tried to fit the data with a power-law, as has been observed in the HTSs, and previously claimed in this material [3]. However, this is clearly not a good fit when a wide field/frequency interval is sampled. The dashed line represents a fit to all of the data, giving an exponent , while the dotted line is a fit to data above the melting/depinning transition, giving .