Concentration-Pressure phase diagram for rich Zr PZT ceramics
Abstract
This work reports on the systematic high pressure Raman studies in the PbZr1-xTixO3 () ceramics performed at room temperature. The pressure dependence of the Raman spectra reveals the stable phases of the material under pressure variation. The results allowed us to propose a concentration-pressure phase diagram for rich Zr PZT system up to pressures of 5.0 GPa.
pacs:
Pacs numbers: 77.84.Dy, 77.84.-s, 77.80.BhLead Zirconate titanate, PbZr1-xTixO3 is widely known for their technological importance in the field of electronic, sensors, and non-volatile ferroelectric memory devices. Due this, PZT system at different forms (ceramics, single crystals and thin films) is one of the most studied ferroelectric material for over 50 years by several experimental techniques such as X-ray and neutron diffraction[1, 2, 3, 4], electric measurements[5, 6], and Raman spectroscopy[7, 8, 9, 10, 11, 12, 13, 14]. Their dielectric, piroelectric, and ferroelectric properties are strongly dependent both on the structural phase and on the preparation method[14]. Depending on the value PZT exhibits at atmospheric pressure and room temperature different phases as follows[15]. For 0 0.05, PZT presents an orthorhombic antiferroelectric structure belonging to the C space group. For varying from 0.05 to 0.37 (0.37 to 0.48) PZT presents rhombohedral ferroelectric low temperature phase FR(LT) (rhombohedral ferroelectric high temperature phase FR(HT)) belonging to the space group C (C). The composition around x = 0.48 defines a region known as morphotropic phase boundary (MPB) which divides the rhombohedral from the tetragonal phases. From x = 0.48 to x = 1.0 the PZT exhibits a tetragonal structure belonging to the space group C. Recently, new features on the MPB region were reported[16, 17, 18]. Noheda et al.[17, 18] using high-resolution synchroton X-ray powder diffraction and dielectric measurements, a new monoclinic ferroelectric phase belonging to the C space group was discovered at low temperatures.
There are several number of theoretical and experimental efforts in order to determine the thermodynamically stable phase of PZT when pressure varies. Cerdeira et al[19] have studied the behavior of PbTiO3 single crystal up to 80 kbar. The pressure dependence of the lowest E(TO) soft mode frequency obeys the Curie-Weiss law which predict that PbTiO3 undergoes a structural phase transition from a ferroelectric tetragonal to a cubic paraelectric phase at pressure of about 90 kbar. Bauerle et. al [20] have studied PbTi0.10Zr0.90O3 ceramics by Raman spectroscopy with pressures up to 6.85 GPa. They showed that the material undergoes a phase transition at 0.57 GPa from the initial room temperature-atmospheric pressure (FR(LT)) to a high-temperature rhombohedral phase. Between 0.8 and 0.91 GPa, PbTi0.10Zr0.90O3 goes to the orthorhombic antiferroelectric phase and between 3.97 and 4.2 GPa a new phase is reached, with a symmetry higher than that of the antiferroelectric phase.
Recently, by means of dielectric, X-ray and Raman measurements, Furuta et al.[21, 22] showed that a PbZrO3 polycrystalline fine-powder sample undergoes a rich phase transition sequence up to 30 GPa: from the antiferroelectric phase to an orthorhombic phase I’ at 2.3 GPa, from an orthorhombic phase I’ to an orthorhombic phase I” at 17.5 GPa, and finally from an orthorhombic phase I” to a monoclinic phase at 23 GPa. More recently, Souza Filho et al.[23] have studied the PbZr0.94Ti0.06O3, which besides presenting at room temperature the same phase that of PbZr0.90Ti0.10O3[20], it presents a sequence of phase transitions very different from the latter. This fact points out to the richness of the PZT concentration-pressure phase diagram.
In spite of the variety of studies of PZT under temperature variation by several techniques, there is a limited number of Raman studies performed on the PZT system under pressure variation. The micro-Raman spectroscopy, which is quite useful to investigate a localized area in the probed sample with a spatial resolution of the order of m, is one of the most powerful technique to investigate phase transition in condensed matter under pressure variation. The purpose of this work is to investigate through micro-Raman spectroscopy the structural properties of PbZr1-xTixO3 ceramics under high hydrostatic pressure. A careful analysis of the Raman spectra of samples with six different value yielded information concerning the different stable phases of PbZr1-xTixO3 under pressure variation. Based on previous Raman and X-ray investigations in PbZr1-xTixO3 and PbZrO3 we propose a concentration-pressure phase diagram for rich Zr PZT system up to pressures of 5.0 GPa for .
The preparation of our samples is described elsewhere[23]. Raman microprobe spectroscopy experiments were performed at room temperature in the backscattering geometry using the 514.5 nm radiation line of a Ar-ion laser for excitation. The backscattered light was analyzed using a Jobin Yvon Triplemate 64000. A - cooled Charge Coupled Device (CCD) detector was used to detect the Raman signal. The spectrometer slits were set for a 2 cm-1 spectral resolution. An Olympus microscope lens and an objective with a numerical aperture NA were employed to focus the laser beam at the polished sample surface. The laser power impinging on the samples surface was of the order of 10 mW. The pressure transmitting fluid used was 4:1 methanol-ethanol and pressure calibration was achieved with the well known pressure shift of the ruby luminescence lines.
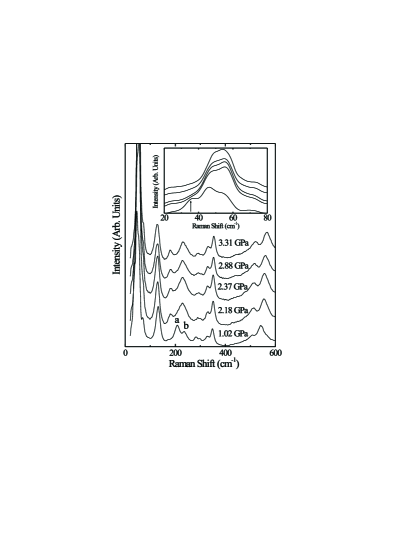
Orthorhombic Antiferroelectric Phase - PbZr1-xTixO3 with - Figure 1 shows the unpolarized Raman spectra for PbZr0.98Ti0.02O3. At room temperature and room pressure, this composition has an orthorhombic structure belonging to the space group C as PbZrO3[24]. Below 150 cm-1 (spectral region depicted in the insert of Fig. 1) six modes at frequencies of 35, 44, 50, 55, 70, and 132 are observed. This spectral region contains the external modes related to Pb- lattice modes[25]. In the high frequency region, cm-1 some internal modes related to certain polyatomic groups of the material appears in the Raman spectra. In the 0.0 GPa spectrum, bands at 204, 232 (Zr-O bending), 285, 330, and 344 ( torsions), 501, and 532 cm-1 (Zr-O stretching) are also observed. The assignments of these bands were made based on the works in PbZrO3 single crystals[24].
To understand the pressure dependence of Raman spectra for PbZr0.98Ti0.02O3, let us remember the main results obtained by Furuta et. al.[22] in PbZrO3 polycrystalline up to pressure of 5.0 GPa. These authors showed that the left-hand side mode of doublet located at about 210 cm-1 disappears at pressures higher then 2.3 GPa and that the right side mode increases in intensity. This spectral discontinuity is attributed to the orthorhombic(I) antiferroelectric phase orthorhombic(I’) phase transition already determined by means of high-pressure X-ray diffraction measurements. For PbZr0.98Ti0.02O3 the doublet mode is characterized by bands at 207 (labeled with a in the Fig. 1) and 232 cm-1 (labeled with b in the Fig. 1). Upon increasing pressures, the spectral features for the doublet is the same that was found in PbZrO3. This spectral discontinuity observed for PbZr0.98Ti0.02O3 around 2.18 GPa indicates the orthorhombic(I) antiferroelectric phase orthorhombic(I’) phase transition. Moreover, the transition can be clearly identified by drastic changes in the lattice mode region (insert in Fig. 1), in particular through the observation of a band (marked with an arrow) that disappears in the spectra of high pressure phase.
For pressures above 2.18 GPa and up to 4.0 GPa , the Raman spectra remain the same which could suggest that the material did not undergoes additional structural phase transitions as occur for the PbZrO3[21, 22]. The Raman spectra of PbZr are qualitatively similar to those of PbZr. The only difference is that the pressure where the phase transition orthorhombic phase (I) orthorhombic phase (I’) occurs is 2.4 for the PbZr.
Rhombohedral Ferroelectric Phase - PbZr1-xTixO3 with - This set of samples presents at room temperature and atmospheric pressure a rhombohedral structure belonging to the C space group[15]. First, let us describe the pressure dependence of Raman spectra for PbZr and PbZr. The former was the subject of our recent work[23] where we have shown that undergoes two different phase transitions up to 3.7 as follow: rhombohedral(LT)orthorhombic(I) orthorhombic(I′). These phase transitions and the presssure dependence of Raman active modes were described in details elsewhere[23]. It should be pointed that composition PbZr have exactly the same pressure dependence and the transitions rhombohedral(LT) orthorhombic(I) orthorhombic(I′) occur at 0.5 and 3.4 GPa, respectively.
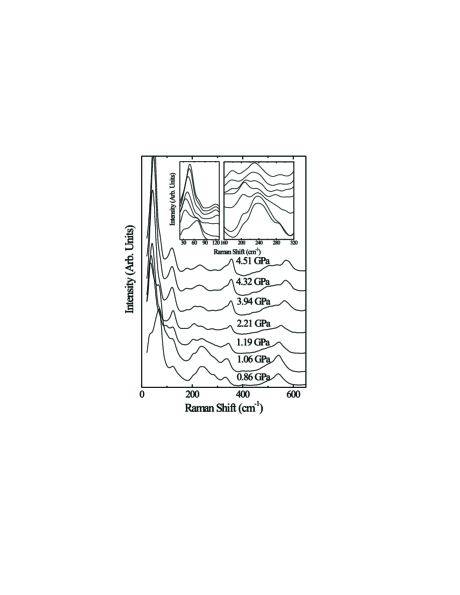
Figure 2 shows the Raman spectra for PbZr0.90Ti0.10O3 recorded at different pressures. Baerle et. al. [20] have reported for PbZr0.90Ti0.10O3 composition the following sequence of pressure-induced phase transitions: rhombohedral(LT) rhombohedral (HT) orthorhombic(I) higher symmetry phase (probably cubic). Our results agree in part with those reported in Ref. 20: in the pressure range of 0.0 - 1.0 GPa, we found the same sequence of phase transitions. Unfortunately, Barele et al. [20] did not report the spectral region above 200 . By observing the double bands (labeled with a and b) of the spectra in the insert of Figure 2, it is clear that the stable phase above 4.2 GPa for PbZr0.90Ti0.10O3 is the orthorhombic phase I’ as already depicted in this paper and in the works of Refs. 22 and 23. Thus, the transition observed in PbZr0.90Ti0.10O3 [20] at 3.9 GPa is from an antiferroelectric orthorhombic phase to the orthorhombic I’ instead of antiferroelectric orthorhombic to a paraelectric cubic phase as proposed by Baerle et al. [20].
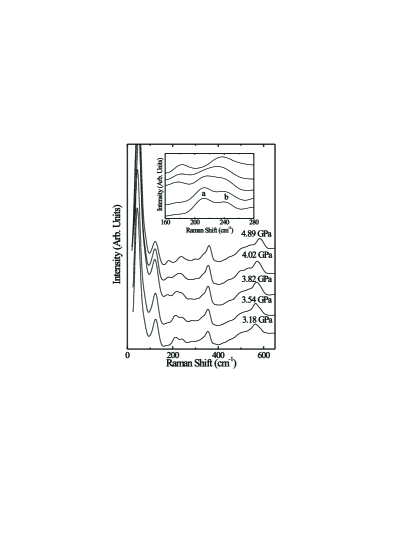
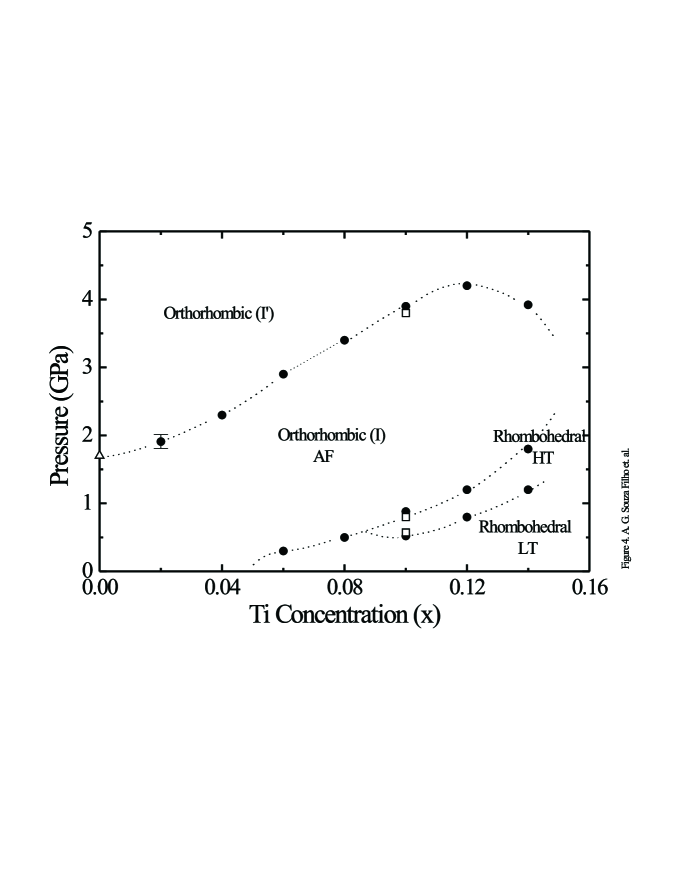
For the compositions PbZr0.86Ti0.14O3 (see Fig. 3) and PbZr0.88Ti0.12O3 it was observed the almost the same qualitative features that was found for PbZr0.90Ti0.10O3. It was found an increase in the rhombohedral(LT) rhombohedral(HT) orthorhombic(I) phase transition pressures and surprisingly a decreasing in the orthorhombic(I) orthorhombic(I’) transition pressure. Finally, the results of all compositions investigated in this work can be summarized in the equilibrium phase diagram (concentration-pressure) for Zr rich PZT ceramics depicted in Fig. 4.
In conclusion, we have performed a systematic high-pressure Raman study on several PbZr1-xTixO3 samples in order to reveal the effects of the pressure on the stable phases of Zr rich PZT ceramics. We detected the existence of a triple point which limit the antiferroelectric, rhombohedral low temperature phase, and rhombohedral high temperature phase for Ti concentration around 0.09. Also, it should be pointed out the possibility of the existence of another triple point in the phase diagram that would be determined by the extension limit of antiferroelectric phase.
Acknowledgments - A.G.S.F. acknowledges the fellowship received from Fundação Cearense de Amparo à Pesquisa (FUNCAP). P.T.C.F. acknowledges FUNCAP for grant n 017/96 PD. Financial support from CNPq, FAPESP and FINEP, Brazilian funding agencies, is also grateful acknowledged.
REFERENCES
- [1] A. Pignolet, L. Wang, M. Proctor, F. Levy, and P.E. Schmid, J. Appl. Phys. 74, 6625 (1993) .
- [2] H. Zhang, S. Leppavuori, and P. Karjalainen, J. Appl. Phys. 77, 2691 (1995).
- [3] H. Fujishita and S. Katano, J. Phys. Soc. Jpn. 66, 3484 (1997).
- [4] D. L. Corker, A. M. Glazer, R. W. Whatmore, A. Stallard, and F. Fauth, J. Phys.:Condens. Matter. 10, 6251 (1998).
- [5] Z. Ujma, J. Handerek, H. Hassan, G.E. Kugel, and M. Pawelezyk, J. Phys: Condens. Matter. 7, 895 (1995).
- [6] J. Handerek and Z. Ujma, J. Phys: Condens. Matter. 7, 1721 (1995).
- [7] I. El-Harrad, P. Becker, C. Carbatos-Nedelec, J. Handerek, Z. Ujma and D. Dimytrov, J. Appl. Phys. 78, 5581 (1995) .
- [8] D. Baurele, Y. Yacoby, and W. Ricther, Solid State Commun. 14, 1137 (1974) .
- [9] D.C. Agrawal, S.B. Majumder, Y.N. Mohapatra, S. Sathaiah, H.D. Bist, R.S. Katiyar, E. Ching-Prado,and A. Reynes, J. Raman Spectrosc. 24, 459 (1993) .
- [10] K. Rolender, G. E. Kugel, M.D. Fontana, J. Handerek, S. Lahlon and C. Carbatos-Nedelec, J. Phys: Condens. Matter. 1, 2257 (1989).
- [11] G. Burns, and B.A. Scott, Phys. Rev Lett. 25, 167 (1970).
- [12] G. Burns, and B.A. Scott, Phys. Rev Lett. 25, 1191 (1970).
- [13] M. Jinfang, Z. Guangtian, C. Qiliang, L. Jianping, W. Xiaohui, and Z. Muyu, J. Phys. Chem. Solids 55, 427 (1994).
- [14] J. F. Meng, R. S. Katiyar, G. T. Zou, and X. H. Wang, phys. stat. sol. (a) 164, 851 (1997).
- [15] B. Jaffe, W.R. Cook, and H. Jaffe, in Piezoelectric Ceramic, Academic Press, New York, 1971.
- [16] A. G. Souza Filho, K. C. V. Lima, A. P. Ayala, I. Guedes, P. T. C. Freire, J. Mendes Filho, E. B. Araujo, and J. A. Eiras, (http://xxx.lanl.gov/abs/cond-mat/9907286)
- [17] B. Noheda, D. E. Cox, G. Shirane, J. A. Gonzalo, S.E. Park and L. E. Cross, Appl. Phys. Lett. 74, 2059 (1999).
- [18] B. Noheda, J.A. Gonzalo, A. Caballero, C. Moure, D.E. Cox, G. Shirane. To be published in Ferroelectrics. (http://xxx.lanl.gov/abs/cond-mat/9907286)
- [19] F. Cerdeira, W. B. Holzappel, and J. D. Bauerle, Phys. Rev. B 11, 1188 (1975).
- [20] D. Baerle, W.B. Holzapel, A. Pinczuk and Y. Yacoby, phys. stat. sol. (a) 83, 99 (1977).
- [21] Y. Kobayashi, S. Endo, L.C. Ming, K. Deguchi, T. Ashida and H. Fujishita, J. Phys. Chem. Solids 60, 57 (1999).
- [22] H. Furuta, S. Endo, L.C. Ming and H. Fujishita, J. Phys. Chem. Solids 60, 65 (1999).
- [23] A. G. Souza Filho, P. T. C. Freire, J. M. Sasaki, I. Guedes, J. Mendes Filho, F. E. A. Melo, E. B. Araújo and J. A. Eiras, Solid State Commun. 112, 383 (1999).
- [24] A.E. Pasto, and R.E. Condrate, J. Am. Ceram. Soc. 56, 436 (1973).
- [25] C. Carabatos-Nedelec, I. El Harrad, J. Handerek, F. Brehat, and B. Wyncke, Ferroelectrics 125, 483 (1992).