THERMODYNAMIC AND SPECTROSCOPIC PROPERTIES AND
LOW TEMPERATURE THERMOCHROMISM
OF CHROMIUM
TRIS–ACETYLACETONATE
Abstract
Two narrow anomalies with peaks at and and a wide diffuse anomaly within the range have been found in a low temperature heat capacity of chromium tris–acetylacetonate . Besides, the reversible change in color has been discovered when cooling the crystals to liquid nitrogen temperature (thermochromism). To clear up the nature of these effects the static magnetic susceptibility was measured within the temperature range , the ESR–spectra on the ion and the transmission spectra in visible region were recorded at and , the Raman spectra were measured within the range . It has been ascertained that the reversible effect of thermochromism is observed in most of –diketonates of the transition metals. Some tentative considerations concerning the origin of discovered effects are put forward.
1 Introduction
The chromium tris–acetylacetonate (or ) belongs to the –diketonate complexes of transition metals crystallizing in the molecular type lattices. The –diketonates of metals are widely used in practice (to separate metals, to apply metal coatings, as catalysts etc.). The field of their application is extending with time, which encourages their further comprehensive investigations. The compounds were actively studied in thermodynamical [1–3] and crystallochemical [4] aspects. In the recent years they have became the subject of theoretical inquiry [5, 6].
When investigating the properties of –diketonates we have found some interesting effects in these compounds, before unknown. In this work two of such effects have been detected in the properties of : 1) anomalies in low temperature heat capacity; 2) a reversible change in color of crystals when cooling them to liquid nitrogen temperature (thermochromism).
2 Experimental
The samples synthesized for this investigation are crystalline powder with the average size of crystallites 0.3–0.5 mm. At the room temperature they are dark violet. The samples were defined by the methods of chemical analysis, IR–spectroscopy, derivatography and X–ray phase analysis.
The heat capacity of has been measured by the adiabatic method within the range using the installation described in Refs [7, 8]. The anomalous component was extracted by subtracting the regular heat capacity obtained by means of technique described in [9, 10]. Three anomaly were found in the heat capacity: the small peak at , the anomaly with maximum at , and the broad anomaly within the range (see Fig. 1).
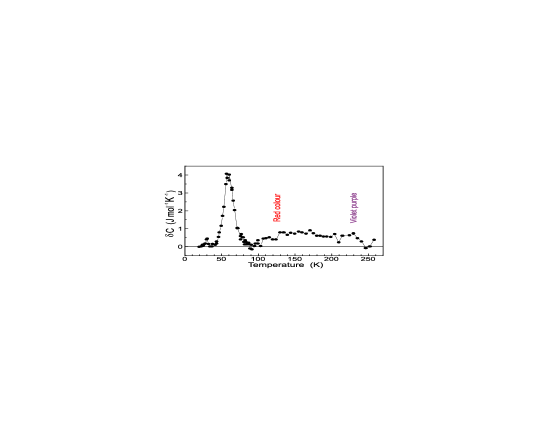
The anomalies in maxima are correspondingly 0.9 %, 3.2 % and 0.3 % of a regular heat capacity. The corresponding contributions to the entropy are: mol (), mol () and mol (the broad anomaly).
To understand the nature of found anomalies we have measured the static magnetic susceptibility, the Raman spectra, the ESR–spectra on the ion , the transmission spectra in visible region and have followed the change in color with temperature.
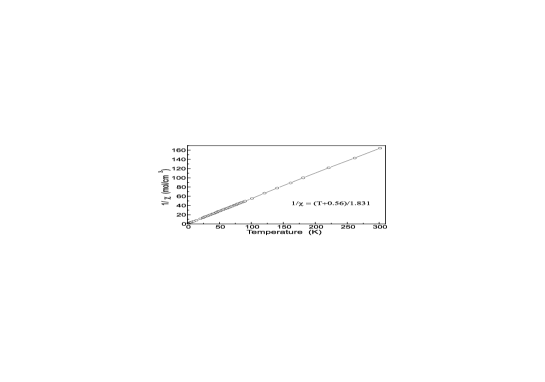
The static magnetic susceptibility of was measured by MPMS–5s SQUID–magnitometer (of Quantum Design) within the temperature range (Fig. 2). The obtained data showed the experimental points to fit in well with the Curie–Weiss low. No pronounced magnetic anomalies were observed. But at the attentive consideration one could see a weak deviation of experimental points from the Curie–Weiss low within the temperature range .
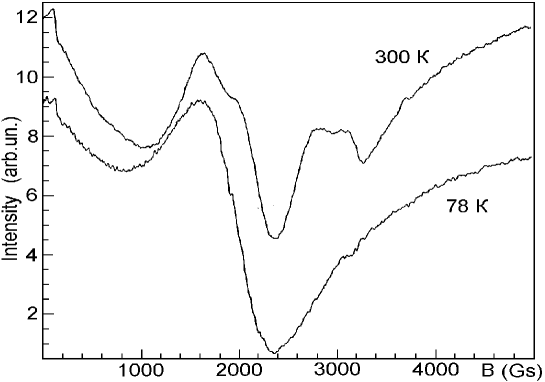
The ESR–spectra on the ion in single crystals were recorded using Varian spectrometer at the frequency GHz and at the temperatures and (Fig. 3). The ground orbital state of ion in the octahedral surrounding of is singlet; —factor of configuration of ion is close to [11]. The large anisotropy of ESR–spectra has been observed which results from large shifts of spectra due to the large second order corrections to the parameters of fine structure when the initial split is comparable with Zeeman interaction. The decrease of temperature from to results in the broadening of lines without any change of their positions, for some lines such a broadening results in their total disappearance.
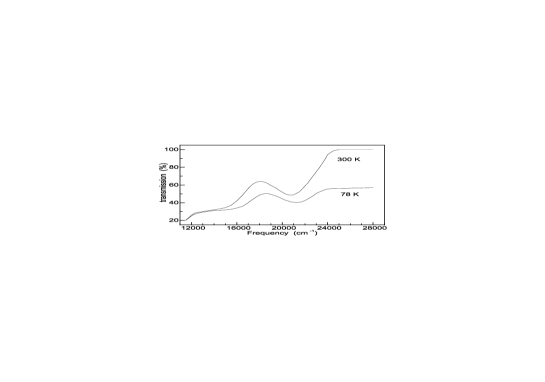
The transmission spectra of within the frequency range cm-1 have been obtained at room and nitrogen temperatures using the two–ray spectrophotometer Specord of type ( Fig. 4). The sample was prepared of powder placed between two quartz plates and then heated up to melting temperature (). After cooling the solid continuous layer of mm thick was formed.
Comparing the spectra obtained in the green region ( cm-1) at room and nitrogen temperatures one can see the shift of the transmission band maximum to the violet side by cm-1. This shift exceeds the expected shift resulting from the temperature expansion of crystal lattice.
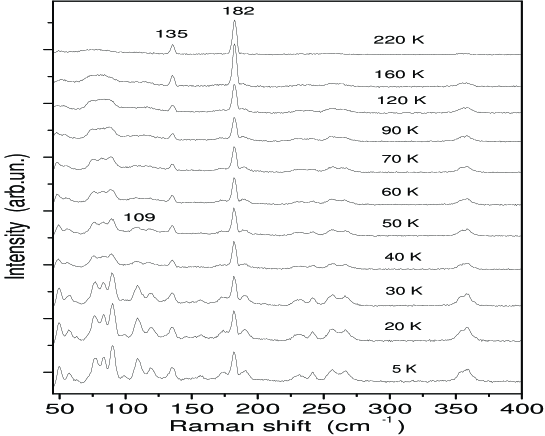
The Raman spectra of (Fig. 5) were recorded with a Triplemate, SPEX spectrometer equipped with a O–SMA, –diode array. The nm, mW line of an –laser was used for the spectral excitation. For the low temperature measurements the sample was fixed on a cold finger of the helium cryostat (APD Cryogenic Inc). The measurements were carried out within the temperature range . The temperature was established within the accuracy of .
The frequency interval cm-1 is the range of crystal lattice vibrations. The interval cm-1 is the borderline range of the lattice and molecular vibrations. The higher frequencies are rated as molecular ones. The band within the range cm-1 being wide at splits up into the separate components when the temperature decreases. The detail analysis showed that the frequencies of these components depend on the temperature, but their relative intensity does’nt depend on it. When the temperature reaches the new band at cm-1 appears which was absent at higher temperature.
It was discovered in this work that the sample dark–violet at the room temperature becomes red when immersed into liquid nitrogen (thermochromism). This change in color is reversible. In order to follow the change in color with temperature, a special experiment was carried out. The sample placed on a copper substrate was immersed in the bath with liquid nitrogen. Temperature of the substrate and sample was measured by copper–constantan thermocouple, the color of the sample was estimated by eye. When the temperature slowly increased, the red color had remained within the range . The color of the sample varied smoothly within the range , at it had turned dark violet and then it stayed as such at the further increase of temperature up to room one.
An additional experiment with 36 compounds showed that the reversible effects of thermochromism was observed for most of –diketonates of transition metals, when cooling them with the liquid nitrogen. Most of tried 36 compounds grew light when the temperature decreased. The most pronounced changes in color were observed for cobalt (III), copper (II) and chromium (III) compounds. The compound , being dark green at room temperature, became violet. The compound –copper(II) acetylacetonate – hexafluoroacetylacetonate, being green at room temperature, became blue. The change in color of has been described above.
3 Discussion
The nature of discovered anomalies in heat capacity is still unknown.
For the moment we have no additional information about the anomaly at .
The –like anomaly at might display some long range ordering in the substance. Its temperature is close to temperature , where the total entropy of crystal has the maximal temperature derivative. The collective long range ordering in solids is often having been detected at that temperature , where the derivative of the total entropy in temperature is maximal (see, for example, superconducting effect in HTSC or the ordering of another nature in Refs. [12]–[15]).
The magnetic susceptibility data show that the anomalies in the heat capacity do not result from any magnetic phase transitions. Then, one can suppose the anomaly to result from the change in the structure of the crystal or of the molecule. But in Raman spectra no significant change indicative of structural transformation in the crystal (of phase transition) was observed. That’s why the crystal is’nt thought to be arranged as a whole. In this case one may expect a rearrangement or an ordering of the loosely bound atoms or separate structural fragments: molecules , ligands or groups and .
The analysis of the internal vibrations of the molecule in Raman spectra has shown no change in structure of molecule with temperature. The absence of magnetic anomalies testifies that the symmetry of ion crystal surrounding does not change substantially within the temperature range under investigation. This means that the change in geometry of molecule is hardly probable in the vicinity of chromium ion. One should rather expect some change connected with the dynamics of the methyl groups.
The torsional vibrations of methyl groups were identified in Raman spectra of –and – –diketonates [16]. They were detected below in the frequency region cm-1. One may suppose that just as in Ref. [16] the new band cm-1 appeared in Raman spectra of below (Fig.5) results from the scattering on the torsional vibrations of the methyl groups. Only these vibrations can show an observed temperature behavior of the line intensity in Raman spectra.
According to Bose–Einstein distribution the function entering in the general expression for the heat capacity and characterizing the statistical weight of vibrational modes is
The maximal change of statistical weight of vibrational mode occurs at the temperature . Then the maximal change of the statistical weight of the torsion vibrations cm-1 () falls at . It is interesting to note that this value is close to the temperature of the anomaly in heat capacity ().
This –like anomaly (Fig.1) might display some long range ordering all over the crystal below . The torsional vibrations of the methyl groups observed in Raman spectra at low temperatures arise at the same temperature . The assumed long range ordering might be attributed just to the dynamics of the methyl groups.
Within the temperature range 110–240 K the diffuse anomaly in heat capacity takes place. Within the same temperature range (120–210 K) the smooth change in the sample color has been detected. When temperature decreases from to the ESR spectra exhibit the broadening of lines without any change of their energetic position (Fig.3). Such a broadening might be explained by the appearance of additional indirect anisotropic interaction which results from the decrease of the mobility of separate fragments of molecule with temperature. This broadening is observed within the same temperature range where the diffuse anomaly in heat capacity and the smooth change in the sample color take place. The magnetic susceptibility shows the weak deviation of experimental points from the Curie–Weiss low within the same temperature range .
One can suppose that ions responsible for the paramagnetic behavior of crystals might be slightly affected by the change of some fragments of molecule with temperature. The change of energetic state of these fragments might result in the small perturbation of the crystal field. The last results in redistribution of electron density, shift of the transmission spectra and change in color of crystals when temperature varies from liquid nitrogen to room one.
4 Conclusion
In the present study some effects have been discovered in the low temperature properties of chromium tris–acetylacetonate , which have not been observed before: the effect of thermochromism and three anomalies in heat capacity.
Anomalies in heat capacity generally display some transformations in a substance.
There are no considerations as regards the anomaly at .
As for the –anomaly, the assumption has been put forward that it might display some long range ordering taken place in the – subsystem at this temperature. The rise of torsional vibrations of – methyl groups at the same temperature was the basis for this assumption.
Besides, it was detected that the wide diffuse anomaly in the temperature range was accompanied with some features in ESR– and transmission spectra, with weak deviation of the magnetic susceptibility from the Curie–Weiss low, and change in color of the sample in the same temperature range. All these features were assumed to be attributed to a change with temperature of some fragments of the molecule which are still to be recognized.
To verify our tentative insight into the nature of discovered effects the complex investigation of –diketonates of other transition metals with different ligands should be carried out.
Acknowledgements
The authors thank A.A.Rastorguev for helpful discussions of essential aspects of this work.
This work is supported by RFBR (grant No 99–03–33370).
References
- [1] I.K. Igumenov, Yu.V. Chumachenko, S.V. Zemskov. in: Problemy chimii i primeneniya –diketonatov metallov. Nauka. Moskwa, 1982, s.100 (in russian).
- [2] T.P.Melia, R.Merrifield. J.Chem.Soc.A (1968) 2819.
- [3] T.P.Melia, R.Merrifield. J.Inorg.Nucl.Chem. 32 (1970) 2573.
- [4] L.M.Shkol’nikova, M.A.Poray-Koshits. Itogi nauki i techniki. Ser. Kristallochimiya. Nauka. Moskwa. 1981 (in russian).
- [5] E.A.Mazurenko, A.I.Gerasimchuck, G.N.Bublick. Ukrainsky chimich. zhurnal, 57 (1991) 1011 (in russian).
- [6] R.V.Belosludov, I.K.Igumenov, V.R.Belosludov, V.P.Shpakov. Mol. Physics, 82 (1994) 51.
- [7] V.N.Naumov, V.V.Nogteva. Pribory i technika experimenta, N 5 (1985) 186 (in russian).
- [8] G.I.Frolova, L.E.Reznik, and I.E.Paukov. J. Chem. Thermodynamics. 21 (1989) 25.
- [9] V.N.Naumov, G.I.Frolova, T.Atake. Thermochimica Acta, 299 (1997) 101.
- [10] V.N.Naumov, A.B.Tagaev. Preprint 90–08, Inst. Inorganic Chemistry, Novosibirsk, 1990, s.40.
- [11] A.Abragam, B.Bleaney. Electron paramagnetic resonance of the transition ions. Moskwa, 1973, s. 652.
- [12] G.A.Berezovsky, I.E.Paukov. Zhurnal fizicheskoy chimii, 48 (1974) 2138.
- [13] E.E.Anders, A.I.Zvyagin, S.V.Starzev, L.S.Shestachenko. Fizika nizkich temperatur, 9 (1983) 1983.
- [14] G.S.Knapp. J.Less Common Metals 62 (1978) 127.
- [15] H.Kawaji, T.Atake and Y.Saito. J.Phys.Chem.Sol. 50 (1989) 215.
- [16] B.A.Kolesov, I.K.Igumenov. Spectrochimica Acta A 40 (1984) 233.