Wave Chaotic Eigenfunctions in the Time-Reversal Symmetry-Breaking Crossover Regime
Abstract
We present experimental results on eigenfunctions of a wave chaotic system in the continuous crossover regime between time-reversal symmetric and time-reversal symmetry-broken states. The statistical properties of the eigenfunctions of a two-dimensional microwave resonator are analyzed as a function of an experimentally determined time-reversal symmetry breaking parameter. We test four theories of one-point eigenfunction statistics and introduce a new theory relating the one-point and two-point statistical properties in the crossover regime. We also find a universal correlation between the one-point and two-point statistical parameters for the crossover eigenfunctions.
pacs:
PACS numbers: 05.45.Mz, 03.65.Sq, 11.30.Er, 84.40.AzMany complex quantum systems whose underlying classical behavior is chaotic can be described by treating their Hamiltonian matrix elements as random numbers which fluctuate around zero with a Gaussian distribution. There are universal statistical properties of the eigenvalues and eigenfunctions of these random matrices which depend only on the symmetries of the Hamiltonian. For instance, random matrix theory has been shown to be consistent with the statistical properties of nuclei,[1] molecules,[2] and two-dimensional quantum dots.[3, 4, 5, 6] In the case of two-dimensional quantum mechanical systems with classically chaotic dynamics, there is a direct relation between the statistics of measured conductance values through quantum dots in the Coulomb blockade limit and the statistics of amplitudes of chaotic electron waves in confined systems.[3, 4, 5, 6]
When time-reversal symmetry is present, wave chaotic systems have statistical properties described by a Gaussian Orthogonal Ensemble (GOE) of random matrices.[7] As a magnetic field is applied, time-reversal symmetry (TRS) is lost in these systems, and the statistical properties are described by a Gaussian Unitary Ensemble (GUE) of random matrices. However, it is found in the semiclassical regime that the evolution between these types of symmetry is continuous and that a broad crossover of intermediate statistics exists.[8, 9, 10, 11] It has been proposed that careful measurements of this crossover behavior provides a demanding test of the random matrix hypothesis,[12] and we perform such a test in this paper. Prior experimental evidence for the existence of a crossover regime comes from statistical properties of eigenvalue spacings, which showed indications of a progression from GOE to GUE statistics as a function of time-reversal symmetry breaking (TRSB) parameter.[8, 13, 14]
Here we address the evolution of eigenfunctions of semiclassical wave chaotic systems from the TRS to the TRSB limits. A considerable theoretical literature has developed proposing detailed descriptions of eigenvector statistics in the crossover regime, although little experimental data is available to test these theories. These theories only treat the evolution of the one-point statistical property of eigenfunction distribution, P(2), which quantifies the degree of probability density, 2, fluctuations in the eigenfunctions.[4, 15, 16, 17] No eigenfunction imaging experiment has explicitly demonstrated the crossover of eigenfunction statistics from GOE to GUE symmetry, to our knowledge. In addition, no work has addressed the question of which of the theories of one-point eigenvector distribution function best describes the crossover regime and no work has addressed the crossover properties of the two-point correlation functions. Hence this work forms an important testing ground for theories of wave chaotic systems and quantum dots based on random matrix theory, supersymmetry, and semiclassical techniques.
The experimental arrangement used to create and measure the wave chaotic eigenfunctions has been described previously.[14, 18, 19] Briefly, a two-dimensional microwave cavity with walls defining a non-integrable infinite square well potential is used to simulate the solutions to the two-dimensional Schrödinger equation in the semi-classical limit.[20] The cavity is a symmetry-reduced bow-tie with dimensions shown in Fig. 1(a).[19] A magnetized microwave ferrite incorporated into the cavity is used to break TRS. We image the probability density 2 by measuring the electric fields in the standing wave pattern of the resonator and using the analogy between the Helmholtz and Schrödinger equations in two dimensions.[18] Previous results have established that GOE[21] and GUE statistical properties of both eigenvalues[14, 22] and eigenfunctions[18] are seen in the limit of zero and large non-reciprocal phase shift in the magnetized ferrite,[14] respectively.
We have found that the non-reciprocal property of the ferrite, hence the degree of TRSB, is a function of frequency of the eigenmode in a relatively narrow range of frequency.[18] This fortuitous property creates a series of eigenmodes of similar energy spanning the GOE to GUE crossover regime. Making use of this property, we identified a crossover of spectral rigidity statistics from the GOE to GUE limits in earlier experimental work.[14] In this paper we systematically examine the crossover eigenfunctions, and for the first time quantify the degree of TRSB with an experimentally determined parameter.
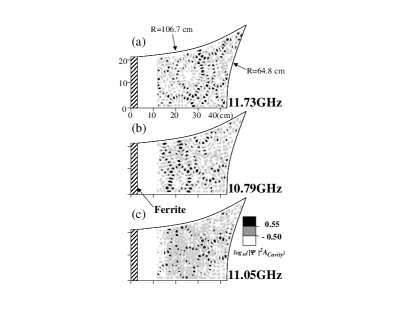
Figure 1 shows three eigenmodes 2 of the microwave resonator with different degrees of TRS, but of similar energy. Figure 1(a) shows a GOE-limit eigenmode, Fig. 1(c) shows a GUE-limit eigenmode, while Fig. 1(b) shows a mode of intermediate statistics. The probability amplitude is plotted as log10() and presented in three shades to accentuate the differences between the GOE and GUE characteristics of the eigenfunctions. Note that the GOE mode is distinguished by the tall sharp fluctuations of 2 (dark areas), and the abundance of low 2 regions (white areas) between the spikes.[23] The GUE mode on the other hand has smaller fluctuations of 2 and the peaks are more spread out, showing an abundance of intermediate value 2 regions (gray areas).[23] These qualitative observations are substantiated by more rigorous statistical analysis[18] presented below. The crossover eigenfunction (Fig. 1(b)) is a mixture of co-existing regions showing GOE-like and GUE-like properties. Although we see no obvious signs of scarring[24, 25] in any of the eigenfunctions, it may make a contribution to the statistical measures of crossover behavior presented below.[26]
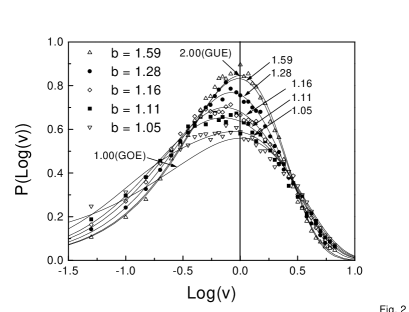
As mentioned above, the distribution of 2 values is a simple means of identifying the symmetry of the corresponding Hamiltonian. In the GOE limit one finds the Porter-Thomas distribution function of eigenfunction values,[27] PGOE() = (1/, where = , and is the area of the cavity. In the GUE limit the distribution function is simply PGUE() = .[27, 28] To enhance the subtle differences between these two distribution functions, we plot P(log10()) versus log10() in Fig. 2.[15] Note that PGUE(log10()) peaks at a higher value and falls off more quickly, while PGOE(log10()) has a shorter and broader distribution. From this it is clear that GOE eigenfunctions have more large (black in Fig. 1) and small (white) 2 fluctuations, consistent with our qualitative observations of Fig. 1. Also shown in Fig. 2 are distribution functions of eigenmodes in the crossover regime. Each data set is an average of 5 eigenfunctions of similar degree of TRSB (as discussed below). There is a smooth variation of the distribution of eigenfunction fluctuations as TRS is broken.[29] The exact form of this variation is not predicted by theory.
We have found four theories for the GOE GUE crossover probability density distribution function Pcrossover(); that due to Brickmann, et al. (Pβ(), ),[15] Zyczkowski and Lenz (Pb(), ),[16] Sommers and Iida (Pε(), ),[17] and Fal’ko and Efetov (PX(), ).[4] The subscript denotes the symmetry-breaking parameter used by the authors. In each case, the lower limit of the TRSB parameter (, , , ) corresponds to GOE statistics, and the upper limit to GUE statistics. All of the theories agree in these two limiting cases, but they disagree for intermediate parameter values in the crossover regime.[17] For instance Pβ() , a generalized chi-square distribution suggested by Brickmann, et al.,[15] shows a maximum of the distribution function Pβ() at = 1 for all values of , whereas the other theories show a peak in Pb,ε,X() which occurs for 1 in the crossover regime (see e.g. the solid lines in Fig. 2 for Pb()).
It should be noted that none of the theories for the crossover behavior is precisely aplicable to this experiment. The theory of Brickmann, et al. proposed an interpolation of the chi-square distribution with no microscopic justification. Zyczkowski and Lenz performed a more detailed calculation in which two chi-square distributions were convolved together because it was assumed that the real and imaginary parts of the random matrix elements were independently fluctuating. Sommers and Iida addressed the issue of properly treating the fluctuations of the matrix elements, but had to perform an energy averaging to arrive at the final distribution function. The work of Fal’ko and Efetov uses a model appropriate for disordered systems and was not explicitly derived for ballistic billiard systems such as ours. (However the results here suggest that the theory is also applicable to such systems.) Despite the fact that none of these theories exactly corresponds to the experimental situation, they are remarkably accurate in their description of the data.
The probability distribution functions P() for 64 experimental eigenmodes have been fit to the four theories of crossover statistics. It is found that the Zyczkowski and Lenz theory produces the best fits for these eigenfunctions, although the difference in fit quality for the other theories is not statistically significant. Figure 2 shows averaged distribution functions for groups of 5 eigenfunctions with similar values of the Zyczkowski and Lenz crossover parameter , as well as best fits to the averaged Pb(). Notice that significant changes in P() already occur for a small deviation of from 1, consistent with Fal’ko and Efetov’s prediction that a small amount of magnetic flux quickly moves the system away from GOE statistics.[4] Also note that the peak of the experimental distribution function occurs at 1 for crossover eigenfunctions, demonstrating that the generalized distribution is not a correct description of the crossover data.
These theories, as well as random matrix theory,[12] do not predict how the crossover parameters evolves with non-reciprocal phase shift in the ferrite, and do not even relate their crossover parameters to those of other theories. Therefore we proceed empirically and define a simple experimental measure of the degree of TRSB. We have noticed a strong asymmetry of the forward (S) and reverse (S) complex transmission coefficients of the microwave cavity for TRSB eigenmodes,[19] and correlated this asymmetry with the degree of TRSB derived from statistical analysis of the associated eigenfunctions. We define the experimental time-reversal asymmetry parameter , where the integrals are carried out over one resonant peak (between neighboring minima in ) in the frequency domain. This parameter is easily evaluated, does not require an image of the eigenmode,[30] and (as shown below) can be considered a measure of the “magnetic flux” through the cavity causing TRSB.
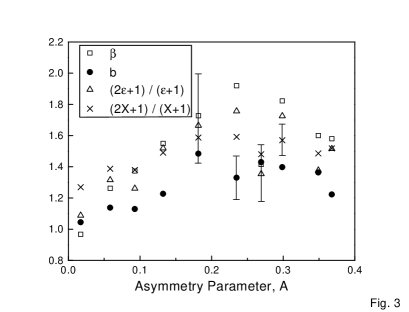
We find that the one-point correlation function parameters (, , , ) are strongly correlated with our experimental measure of TRSB, . Figure 3 shows the four distribution function crossover parameters , , (, plotted vs. , for groups of similar eigenfunctions. Note that the parameters and have been mapped to the interval (1,2) in an ad hoc way, simply for comparison with the other statistical parameters. We see that all four statistical parameters describe a smooth and universal transition from GOE to GUE statistics as the asymmetry of the transmission characteristic, , increases.[31] Note that there is initially a linear increase of the crossover parameters with A, suggesting that they all give a measure of the “magnetic flux” producing the GOE GUE crossover. The reduction of the parameter values beyond = 0.25 is likely due to difficulties in properly calculating A for the highly distorted microwave resonance curves encountered in the GUE limit.
One can also employ two-point statistical correlation functions to quantify the crossover from TRS to TRSB behavior of the eigenfunctions. It has been shown that ,[32] where is the wavenumber of the eigenmode, is the zero-order Bessel function, and = 2 for GOE and = 1 for GUE eigenfunctions.[18, 28] Eigenfunctions with a smaller value of show a more “smeared out” appearance (Fig. 1(c)). We find that the value of changes smoothly between 2 and 1 for the experimental crossover eigenfunctions.
To investigate the self-consistency of these results, we have examined the relationship between the one-point correlation function parameters (, , , ) and the two-point parameter (determined by fitting ), as shown in Fig. 4. Again we notice that there is a universal behavior of the one-point crossover parameters in their dependence on .[31] This demonstrates that the crossover behavior is shared by both single point and two-point statistical properties of the eigenfunctions, in agreement with the prediction of the supersymmetric nonlinear model.[4, 5]
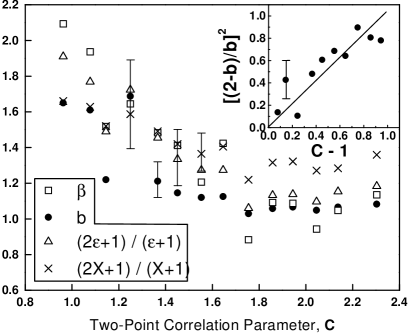
To develop a relationship between one-point and two-point eigenfunction properties, consider a superposition of plane waves,[32] , with fixed wavenumber, , but with random directions and amplitudes. Writing , GOE corresponds to and zero (to make real), while GUE corresponds to random in . Allowing general in the crossover regime leads to the two-point result for given above with , and to the one point result of Zyczkowski and Lenz, Pb(v), with . To test this prediction, we plot versus as an inset to Fig. 4. The data points fit to a straight line of slope close to 1, demonstrating remarkable agreement between the one-point and two-point statistical parameters in the crossover regime.
To summarize, we have established both GOE (TRS) and GUE (TRSB) properties of wave chaotic eigenfunctions and shown that there is a continuum of eigenfunctions with intermediate statistics between the two time-reversal symmetry states. We have found that three of the four theories of one-point eigenfunction statistics P() in the crossover regime adequately describe our data. We have introduced a simple experimental quantity which measures the degree of TRSB, and shown that the statistical properties of the eigenfunctions evolve smoothly with an increase of this parameter. Finally we demonstrate that the one-point and two-point correlation functions describe the smooth crossover in a consistent and universal manner, and that a single TRSB parameter must describe the crossover behavior.
We wish to acknowledge assistance from Paul So and Karol Zyczkowski. This work has been supported by an NSF NYI grant # DMR-9258183, Mitre Corp., and by the Maryland Center for Superconductivity Research.
REFERENCES
- [1] R. U. Haq, A. Pandey, and O. Bohigas, Phys. Rev. Lett. 48, 1086 (1982).
- [2] T. H. Zimmermann, et al., Phys. Rev. Lett. 61, 3, (1988).
- [3] R. A. Jalaberet, A. D. Stone, and Y. Alhassid, Phys. Rev. Lett. 68, 3468 (1992).
- [4] V. I. Fal’ko and K. B. Efetov, Phys. Rev. B 50, 11267 (1994).
- [5] V. I. Fal’ko and K. B. Efetov, Phys. Rev. Lett. 77, 912 (1996).
- [6] A. M. Chang, et al., Phys. Rev. Lett. 76, 1695 (1996).
- [7] An exception to this statement is discussed by F. Leyvraz, C. Schmit, T. H. Seligman, J. Phys. A 29, L575 (1996).
- [8] M. V. Berry and M. Robnik, J. Phys. A 19, 649 (1986).
- [9] A. D. Stone, Phys. Rev. B 39, 10 736 (1989).
- [10] N. Dupuis and G. Montambaux, Phys. Rev. B 43, 14390 (1991), and references therein.
- [11] G. Lenz and K. Zyczkowski, J. Phys. A 25, 5539 (1992).
- [12] O. Bohigas, et al., Nonlinearity 8, 203 (1995).
- [13] J. B. French, et al., Annals of Physics 181, 198 (1988).
- [14] P. So, et al., Phys. Rev. Lett. 74, 2662 (1995).
- [15] J. Brickmann, Y. M. Engel, R. D. Levine, Chem. Phys. Lett. 137, 441 (1987).
- [16] K. Zyczkowski and G. Lenz, Z. Phys. B 82, 299 (1991).
- [17] H.-J. Sommers and S. Iida, Phys. Rev. E 49, R2513 (1994).
- [18] D. H. Wu, et al., Phys. Rev. Lett. 81, 2890 (1998).
- [19] A. Gokirmak, et al., Rev. Sci. Instrum. 69, 3410 (1998).
- [20] H. -J. Stöckmann and J. Stein, Phys. Rev. Lett. 64, 2215 (1990).
- [21] V. N. Prigodin, et al., Phys. Rev. Lett. 75, 2392 (1995).
- [22] U. Stoffregen, et al., Phys. Rev. Lett. 74, 2666 (1995).
- [23] The leftmost 4 inches of the cavity is not imaged due to the interference of the scanning magnet with the ferrite. See reference [19].
- [24] E. J. Heller, Phys. Rev. Lett. 53, 1515 (1984); L. Kaplan and E. J. Heller, Phys. Rev. E 59, 6609 (1999).
- [25] T. M. Antonsen, et al., Phys. Rev. E 51, 111 (1995).
- [26] L. Kaplan, Phys. Rev. Lett. 80, 2582 (1998).
- [27] C. E. Porter and R. G. Thomas, Phys. Rev. 104, 483 (1956).
- [28] V. N. Prigodin, Phys. Rev. Lett. 74, 1566 (1995).
- [29] Additional information supporting the smoothness of the crossover comes from the variance of the distribution P(): = 2/, where crosses over smoothly between the GOE ( = 1) and GUE ( = 2) limits, subject to the statistical limitations of the data,[18] as predicted in ref. [11].
- [30] We have also evaluated a more comprehensive asymmetry parameter B = , which makes use of a pair of entire eigenfunction images. We find that the quantities A and B are strongly correlated.
- [31] Note that the failure of the data points to reach the full GOE and GUE limits in Figs. 3, 4 is due to the finite experimental resolution for the probability amplitude: .[18]
- [32] M. V. Berry, in Chaotic Behavior of Deterministic Systems, edited by G. Iooss, R. H. G. Helleman, and R. Stora (North-Holland, Amsterdam, 1991), p. 171.