Transitions to Line-Defect Turbulence in Complex Oscillatory Media
Abstract
The transition from complex-periodic to chaotic behavior is investigated in oscillatory media supporting spiral waves. We find turbulent regimes characterized by the spontaneous nucleation, proliferation and erratic motion of synchronization defect lines which separate domains of different oscillation phases. The line defect dynamics is controlled by the competition between diffusion, which reduces line length and curvature, and phase-gradient-induced growth. The onset of each type of defect-line turbulence is identified with a non-equilibrium phase transition characterized by non-trivial critical exponents.
pacs:
82.20.Wt, 05.40.+j, 05.60.+w, 51.10.+yTwo-dimensional reactive media with oscillatory dynamics support a variety of spatio-temporal patterns including spiral waves. In the vicinity of the Hopf bifurcation, spiral waves are described by the complex Ginzburg-Landau equation (CGLE) [1, 2]. Spiral waves can also exist if the local dynamics is complex-periodic or even chaotic [3, 4]. While the basic features of such regimes are akin to those of the CGLE, a complete description of complex oscillatory media cannot be given in terms of the CGLE. For example, these media may undergo bifurcations where the period of the orbit doubles at almost every point in space [4, 5]. The rotational symmetry of spiral waves is then broken by the presence of synchronization defect lines where the phase of the local orbit changes by multiples of . These defect lines have been observed in a super-excitable system [6] and in experiments on the Belousov-Zhabotinsky reaction [7].
In this Letter, we study the fate of the synchronization defect lines as the system parameters are tuned to approach the domain where spiral waves have chaotic local dynamics. We show the existence of a new type of spatiotemporal chaos where the global temporal periodicity of the medium is broken by the spontaneous nucleation, proliferation and erratic motion of the defect lines separating domains of different oscillation phases. We describe the basic mechanisms governing the dynamics of the defect lines and provide evidence that the onset of each type of defect-line turbulence is a non-equilibrium phase transition with non-trivial critical exponents. We also study inhomogeneous media without spirals where line motion has a different nature and different scaling laws due to the absence of overall phase gradients.
We study reaction-diffusion (RD) systems where the local kinetics is described by , a vector of nonlinear functions of the local concentrations . For simplicity, we assume that all species have the same diffusion coefficient . While our considerations should apply to any RD system exhibiting a period doubling cascade to chaos, the calculations described here [8] were carried out on the Rössler model [9] where . We investigate the behavior of the system as increases, with other parameters fixed at and .
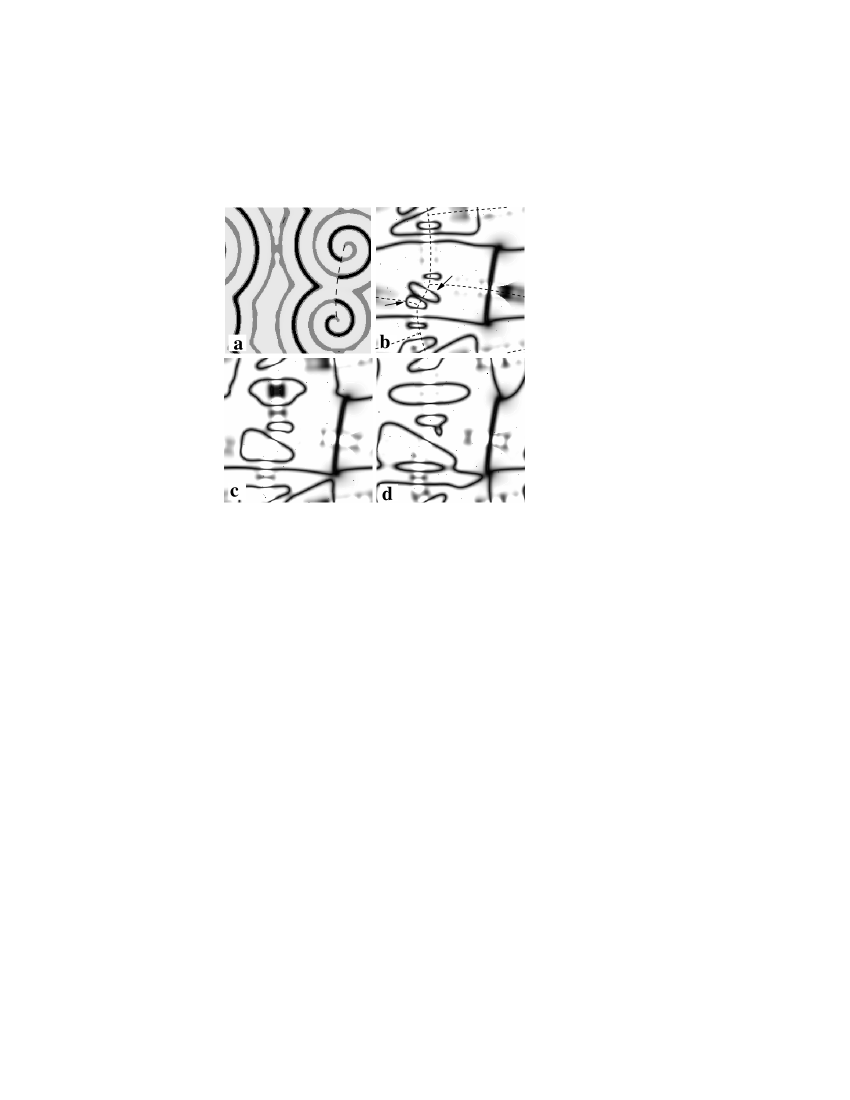
Beyond the Hopf bifurcation, the system supports a spiral solution and infinitely-many spatially-blocked configurations of spirals coexist with spatially inhomogeneous states without spirals. This multistability is preserved away from the Hopf bifurcation, even for values corresponding to chaotic regimes. The blocked configurations form irregular cellular structures, similar to those observed in the CGLE. Cells are centered on spiral cores and their polygonal boundaries are delimited by shock lines where spiral waves from two neighboring cells collide. Fig. 1(a) shows a snapshot of the field for a simple configuration with two spirals.
As increases beyond the Hopf point, the Rössler ODE system exhibits a period-doubling route to chaos followed by band-chaotic regimes intertwined with windows of periodic behavior. In spatially distributed media supporting spiral waves two period-doubling bifurcations take place at and . These values are larger than the corresponding values for the ODE, 2.83 and 3.86, respectively. These shifts in the bifurcation diagram arise from the concentration gradients created by the spiral waves and their values depend on the spiral wavelength. In spatially inhomogeneous media without spiral waves the spatial gradients are small and the shifts of the bifurcation points are not detectable. The period doublings in media with spiral waves are necessarily accompanied by the appearance of synchronization defect lines ( curves) whose existence is required to reconcile the doubling of the oscillation period and the period of rotation of the spiral wave [4, 5].
In the period-2 regime (), a single type of synchronization defect line exists. These curves are defined as the loci of those points in the medium where the two loops of the period-2 orbit exchange their positions in local phase space and the dynamics is effectively period-1. The period-2 oscillations on opposite sides of the curve are shifted relative to each other by (a half of the full period). A medium with period-4 dynamics may support two types of synchronization defect lines corresponding to the two different possible types of loop exchange for a period-4 orbit. Across curves, which inherit properties of the curves, the two period-2 bands of the period-4 orbits exchange, leading to a phase shift across them. The curves correspond to the exchange of loops within the two bands, a finer rearrangement of the local cycle. Along them, the dynamics is effectively period-2 and there is a phase shift as the curves are crossed.
Synchronization defect lines can be conveniently located by constructing scalar fields encoding the distance between loops of the period-4 orbit in local phase space. To this aim, we chose to take advantage of the regular succession of peaks in the local time series of , whose heights are in one-to-one correspondence with the various loops of the orbit. Calculating, at each point , four such consecutive concentration maxima and ordering them so that , one may construct the scalar fields and . In the period-4 case, and take on fixed non-zero values at points in the medium away from spiral cores and shock lines and vanish at points where the loop exchanges occur [10]. Indeed, decreases to zero on the curves while vanishes on both the and curves. In the following, we study the fate of the lines and use and both to determine their length and to visualize them. The field corresponding to Fig. 1(a) is shown in Fig. 1(b). The thick vertical line connecting the spiral cores is an curve, while the thinner lines are curves.
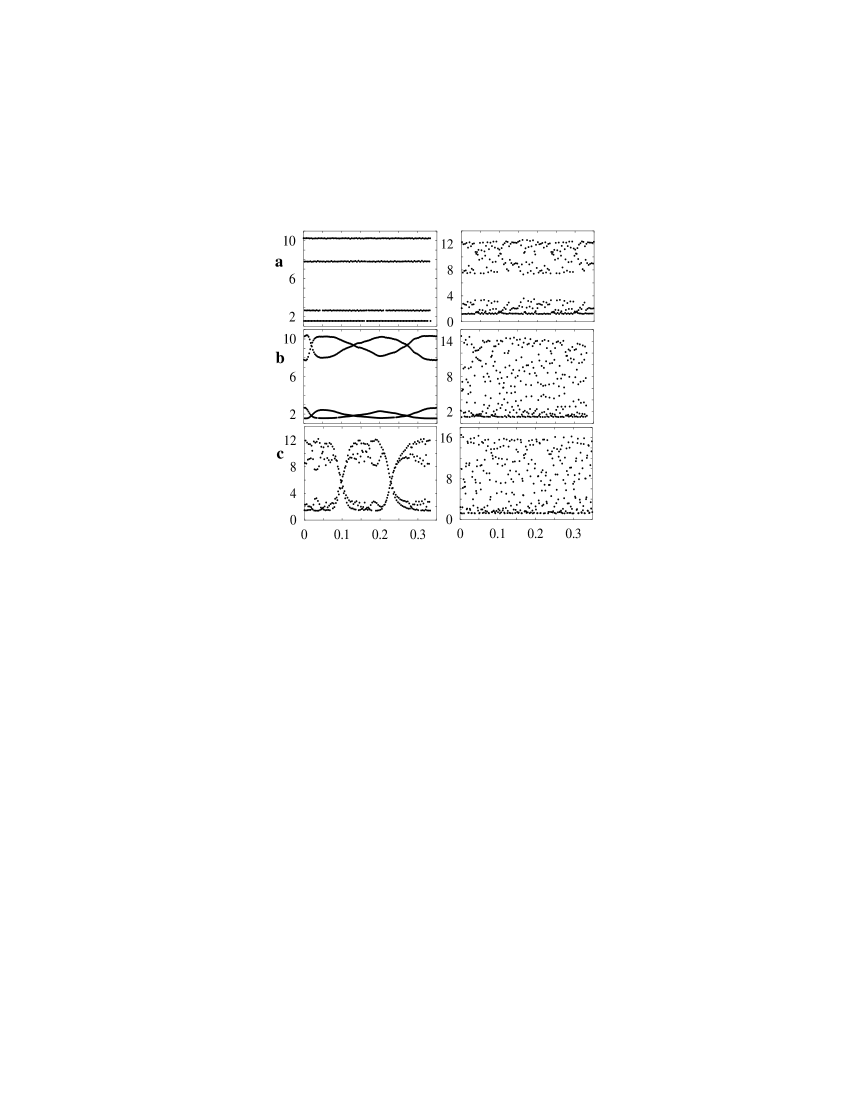
On the shock lines, where the phase gradient vanishes, the local dynamics is approximately that of the Rössler ODE, and is thus always more advanced along the bifurcation diagram. In particular, chaos first appears on the shock lines (for ). For , where most of the medium is still in the period-4 regime, two-banded chaos is seen on the shock lines (Fig. 2(a)). These localized chaotic regions give rise to fluctuations which may result in the creation of “bubbles” – domains delineated by circular curves (Fig. 1(b)). For , the bubbles are formed with a size smaller than a certain critical value and collapse shortly after their birth. As increases beyond , the bubble nuclei begin to proliferate, forming large domains whose growth is limited by collisions with spiral cores or other domains.
A typical life-cycle of a domain is illustrated in Fig. 1(b-d). The shock lines are nucleation sites of domains. Consider the two bubble-shaped nuclei indicated by arrows in panel (b) which were born in close proximity. In panel (c), they have coalesced, forming one rapidly-growing domain which then collides with its neighbor, leaving a shrinking internal domain (panel (d)). The contact of two lines always leads to their reconnection and a reduction of their total length. The contact of and lines leaves one line. This event is accompanied by a change of sign of the phase shift across the line.
The evolution of the size and shape of the line encircling a domain is controlled by the balance of two competing factors: propagation along phase gradient directed toward spiral cores which results in line growth, and the tendency of diffusion to eliminate curvature and reduce the length of defect lines. To investigate the interplay of these two factors, a series of simulations was carried out on a system without spiral waves, but with constant concentrations corresponding to those in the spiral core imposed along one pair of parallel boundaries. This effectively creates “spiral core” boundaries emitting trains of plane waves which collide in the center of the system to form a straight shock line. In this case, the nucleated domains have very simple finger-like shapes, normal to the shock line, and consist of two straight segments with approximately semi-circular caps (Fig. 3). The domain growth velocity normal to the core boundaries, , varies with the radius of the arc of the growing tip as where is the velocity of a straight line parallel to the core boundaries, and . The linear dependence of on shown in Fig. 3 confirms the effect of mean curvature on the velocity of line propagation. Since the width of small domains is approximately equal to , one can estimate the critical size that must be exceeded for domain proliferation. One finds , in good agreement with direct measurements from the observation of domains whose shape does not change with time.

The transition to -line-defect turbulence in media with spiral waves, which occurs around , changes the character of the local dynamics observed in the bulk of the medium. As the lines propagate, the associated loop exchanges result in an effective band-merging in the orbits of local trajectories so that they take the form of two-banded chaotic trajectories (Fig. 2(b)). Although the local trajectories retain their period-4 structure between two passages of lines, the long-time trajectory cannot be distinguished from that of two-banded chaos. Thus, the global transition of the medium to defect-line turbulence can be characterized locally as intermittent band-merging.
As the parameter increases further () the local dynamics undergoes prominent changes. It fails to exhibit a period-4 pattern in the intervals separating line defect passages, and consists instead of four-banded orbits whose bands grow in width with increasing and merge at . Together with this permanent band-merging, spontaneous nucleation of bubbles occurs in the bulk. These chaotic lines are the loci of medium points where the two chaotic bands of the local orbit shrink and a thick “period-2” orbit is formed. As increases, their width decreases, and for the lines cease to exist as well defined objects.
While the local dynamics changes continuously to four- and subsequently two-banded chaos, another transition, mediated by moving lines, takes place. At , the shock regions, where the local dynamics exhibits one-banded chaos, begin to spontaneously nucleate bubbles delineated by lines. As increases, the newly-born domains begin to proliferate. The qualitative features of this transition are similar to those of the -line turbulence transition: the dynamics of the lines encircling domains is controlled by the factors discussed above and, considering shape of the long-time local phase space trajectories, it can be associated with intermittent band-merging (Fig. 2(c)), leading to one-banded local chaotic orbits.
As the parameter increases even further, beyond , the local trajectories in the bulk of the medium exhibit complete band-merging to one-banded chaos. In this regime, no defect lines can be identified and further increase in does not result in any qualitative changes. However, spiral waves continue to exist, signalling the robustness of phase synchronization in this amplitude-turbulent regime. [11]

We now focus on the two onsets of synchronization defect line turbulence. The line density, , where is the surface area of the medium and the instantaneous total length of lines, can serve as an order parameter to characterize these transitions. Above each transition threshold, and as long as the corresponding defect lines continue to exist, the balance between line growth and destruction results in a statistically stationary average density , while fluctuates. Thus the time series of above the first threshold shown in Fig. 4(a) exhibits high-frequency, low-amplitude fluctuations attributed to the birth and death of nuclei in the shock regions, as well as large-amplitude oscillations with long correlation time. This suggests that the proliferation of domains and their destruction through coalescence occurs cooperatively. This is confirmed by the fact that, for both transitions, the order parameter goes continuously to zero as decreases toward the threshold. (In Fig. 4(d) the density does not vanish below threshold because the contribution from the stationary line shown in Fig. 1 has not been removed.) The data fall on curves with power-law forms, , the signature of continuous phase transitions. The critical values are found to be and , while the critical exponents are and . Finite-size effects usually accompany critical point phenomena as correlation lengths diverge near threshold. Here, the finite-size to consider is the typical size of the cells composing the spiral wave structure. Strictly speaking, is not an intensive quantity because line-defect motion is constrained to occur between the network of shocks (where they nucleate) and the spiral cores, and this area varies from one spiral configuration to another. However, the data in Fig. 4(b,d) show that depends weakly on the cell size.
A number of conclusions can be drawn from the simulation results. The two transitions exhibit significantly different scaling properties, a remarkable fact given that the mechanisms at play appear to be the same in both cases. This difference may arise from the fact that the line transition takes places when lines still exist in the medium.
The zero-spiral-density limit is singular since the transitions observed in the medium without spiral waves are different from those described above. In this case, the onset of defect-line nucleation occurs at the same critical values . However, in the absence of large-scale phase gradients, the entire medium behaves like the shock regions separating spiral wave cells, defect lines do not grow and the increase of arises essentially from the enhanced nucleation rate. This leads to a different form of the onset of line turbulence (cf. Fig. 4(c) for the behavior of ) characterized by different critical exponents (, ). These values are difficult to estimate because of fluctuations in the fields not associated with fully developed lines. The fact that and are significantly different from and supports the conclusion that the character of the transitions is different in the spiral and spiral-free systems.
To our knowledge, there is no equilibrium equivalent of these phase transitions, nor were their non-equilibrium analogs reported previously. The line-defect phase transitions may constitute a special class of non-equilibrium critical phenomena since, in this form of spatiotemporal chaos, it is the dynamics of one-dimensional synchronization defects that breaks the global temporal periodicity of the medium.
Finally, the observations of synchronization defect lines in a number of excitable systems [6, 7] demonstrate their independence of any particular reaction mechanism. Therefore, the phenomena presented in this Letter should be observable not only in chemical media exhibiting period-doubling but also in a much broader class of systems. For example, they may exist in the cardiac muscle where complex-excitable dynamics and spiral waves, necessary prerequisites for the emergence of synchronization defects, have been established experimentally [12].
REFERENCES
- [1] Y. Kuramoto, Chemical Oscillations, Waves, and Turbulence, (Springer-Verlag, Berlin, 1984).
- [2] P. S. Hagan, SIAM J. Appl. Math. 42, 762 (1982).
- [3] R. Klevecz, J. Pilliod, and J. Bolen, Chronobiology International 8, 6 (1991); L. Brunnet, H. Chaté, and P. Manneville, Physica D 78, 141 (1994).
- [4] A. Goryachev and R. Kapral, Phys. Rev. Lett. 76, 1619 (1996); Phys. Rev. E 54, 5469 (1996).
- [5] A. Goryachev, H. Chaté and R. Kapral, Phys. Rev. Lett. 80, 873 (1998).
- [6] A. Goryachev and R. Kapral, Int. J. Bif. and Chaos, in press.
- [7] M. Yoneyama, A. Fujii, and S. Maeda, J. Am. Chem. Soc. 117, 8188 (1995).
- [8] An explicit Euler scheme with spatial derivatives given by simple second-order finite differences was used to integrate the PDE. The time step (about 1/600 of the basic oscillation period), space step , and the scaled diffusion coefficient were the same for all calculations.
- [9] O. Rössler, Ann. N.Y. Acad. Sci. 316, 376 (1979).
- [10] Determining defect lines via the fields is possible because the dynamics of these curves is much slower than the overall oscillation of the medium.
- [11] M. Rosenblum, A. Pikovsky and J. Kurths, Phys. Rev. Lett. 76, 1804 (1996); G. Osipov, A. Pikovsky, M. Rosenblum and J. Kurths, Phys. Rev. E 55, 2353 (1997).
- [12] D. Chialvo, D. Michaels, and J. Jalife, Circ. Res., 66, 525 (1990); A. Pertsov, J. Davidenko, R. Salomonz, W. Baxter, and J. Jalife, Circ. Res., 72, 631 (1993).