[
Synchronous Behavior of Two Coupled Biological Neurons
Abstract
We report experimental studies of synchronization phenomena in a pair of biological neurons that interact through naturally occurring, electrical coupling. When these neurons generate irregular bursts of spikes, the natural coupling synchronizes slow oscillations of membrane potential, but not the fast spikes. By adding artificial electrical coupling we studied transitions between synchrony and asynchrony in both slow oscillations and fast spikes. We discuss the dynamics of bursting and synchronization in living neurons with distributed functional morphology.
pacs:
PACS number(s): 87.22.Jb, 05.45.+b, 87.22.-q]
The dynamics of many neural ensembles such as central pattern generators (CPGs) or thalamo-cortical circuits pose questions related to cooperative behavior of neurons. Individual neurons may show irregular behavior [1], while ensembles of different neurons can synchronize in order to process biological information [2] or to produce regular, rhythmical activity [3]. How do the irregular neurons synchronize? How do they inhibit noise and intrinsic fluctuations? What parameters of the ensemble are responsible for such synchronization and regularization? Answers to these and similar questions may be found through experiments that enable one to follow qualitatively the cooperative dynamics of neurons as intrinsic and synaptic parameters are varied. Despite their interest, these problems have not received extensive study. Results of such an experiment for a minimal ensemble of two coupled, living neurons are reported in this communication.
The experiment was carried out on two electrically coupled neurons (the pyloric dilators, PD) from the pyloric CPG of the lobster stomatogastric ganglion [3]. Individually, these neurons can generate spiking-bursting activity that is irregular and seemingly chaotic. This activity pattern can be altered by injecting DC current ( and ) into the neurons, see Fig. 1. In parallel to their natural coupling, we added artificial coupling by a dynamic current clamp device [4]. Varying these control parameters (offset current and artificial coupling), we found the following regimes of cooperative behavior.
Natural coupling produces state-dependent synchronization, see Fig. 2. When depolarized by positive DC current, both neurons fire a continuous pattern of synchronized spikes (Fig. 2d). With little or no applied current, the neurons fire spikes in irregular bursts: now the slow oscillations are well synchronized while spikes are not (Fig. 2a). Changing the magnitude and sign of electrical coupling restructures the cooperative dynamics. Increasing the strength of coupling produces complete synchronization of both irregular slow oscillations and fast spikes (see below). Compensating the natural coupling leads to the onset of independent irregular pulsations (Fig. 2b). With net negative coupling, the neurons burst in antiphase, in a regularized pattern (Fig. 2c).
Figure 1 summarizes the functional geometry of this pair [5]. Each PD cell is a motor neuron, consisting of a soma, a primary neurite and a neuropilar region, and an axon which conducts spikes to target muscles. Within this extended structure there is (1) frequency-dependent filtering of voltage signals; and (2) spatial localization of active membrane currents [5]. First, the neurites constitute a cable. When coupled to its partner, each neuron shows an input resistance and capacitance of order 5M and 5F, respectively [5]. Second, the fast sodium and potassium channels underlying threshold-dependent spike generation (action potentials: amplitude mV; duration msec) are concentrated in the membrane of the axon, whereas the sodium, calcium and potassium channels supporting slow voltage oscillations (10-30mV, 0.3-1.0sec) are located in the neuropil [5]. Cable properties affect the passive spread of voltage signals within the neuron. Slow voltage oscillations experience little attenuation in spreading from the neuropil to the axon, where they drive bursts of spikes. However, fast spike potentials suffer significant low-pass filtering as they spread from the axon to the neuropil and soma [5]. The neuropil is also the site of natural electrical coupling (non-rectifying and moderately weak: steady-state voltage attenuation ) [6].
In the studies of synchronization in the coupled PD neurons both cells were active under symmetrical DC current injection (). Long records of and were obtained, from which we show segments (Fig. 2). For different values of the parameter we see a regime of bursting-spiking (nA, Fig. 2a-c), and, at more depolarized levels, a region of pure spiking activity (nA, Fig. 2d).

Our results indicated that spiking and bursting–spiking regimes of activity arise from the autonomous dynamics of individual PD neurons. In the experiment (Fig. 3a, b) we recorded the membrane potential of one PD cell when its partner was deactivated by DC hyperpolarization to mV, effectively suppressing its neural activity. The DC current injected into was varied. At nA the activity consisted of aperiodic slow oscillations surmounted by spikes (bursting-spiking), see Fig. 3a. At nA, the neuron generated fast spikes alone, see Fig. 3b. Thus, the voltage-dependent spiking and bursting properties of a single PD resembled those of the active pair (although the values of are shifted relative to those of a symmetrical pair, due to the shunting action of the deactivated neuron) (Fig. 2a,d). Similar, voltage-dependent activity regimes were also seen after isolating a single PD neuron by photo-inactivating its partner.


The records presented in Fig. 2a clearly indicate the synchrony of bursts in the naturally coupled neurons. For more detailed analysis of synchronization of these aperiodic bursts we adopt the technique developed for the experimental studies of chaos synchronization in electronic circuits [10]. To study the synchronization of slow bursts we suppress the spikes in the recorded signals using low–pass filter with cut–off frequency 5Hz and analyze the ”slow trajectories” given by the filtered signals and . The projections on to the planes of variables () and () shown in Fig. 4 characterize the level of synchrony of bursts in the neurons and the complexity of the bursts dynamics, respectively. To quantify synchronization, we calculate the difference , and study the normalized standard deviation and normalized maximal deviation as a function of , see Fig. 5.


The dynamics of slow oscillations changed as the effective coupling conductance was altered by adding artificial coupling, . With natural coupling (nS) the slow oscillations stayed synchronized (Fig. 4a) despite very complex dynamics (Fig. 4b) (cf. Fig. 2a). Additional dissipative coupling (nS) increased the level of synchrony between the neurons, while compensation of natural coupling (nS) led to desynchronization (Fig. 5). The desynchronized, slow oscillations remained complex and aperiodic (Fig. 4c,d, see also Figs. 2b). Adding further, negative coupling conductance (nS: probably overcompensating the natural synapse) caused the neurons to become synchronized again, but in antiphase (Figs. 4e , 5). This regime of antiphase synchronization was characterized by the onset of more regular,“almost periodic” bursts (Fig. 4f).
Next we describe the synchronization of the fast, spike oscillations. The standard criterion for identical synchronization fails here because of small fluctuations in spike timing. Therefore, we applied a different analysis. For each membrane voltage we located the times of spike peaks, for and for , and calculated the intervals and . measures interspike intervals in , while tells us about the difference in spike timing in versus . If did not grow with time and , we concluded that the neurons spike synchronously. We also analyzed the level of synchronization by measuring the phase relation between spikes. In this analysis we plotted a histogram of the phase, , of the spike of within the interval formed by the neighboring pair of spikes in (designated and , respectively), using the function, . The results of these analyses are shown in Fig. 6.
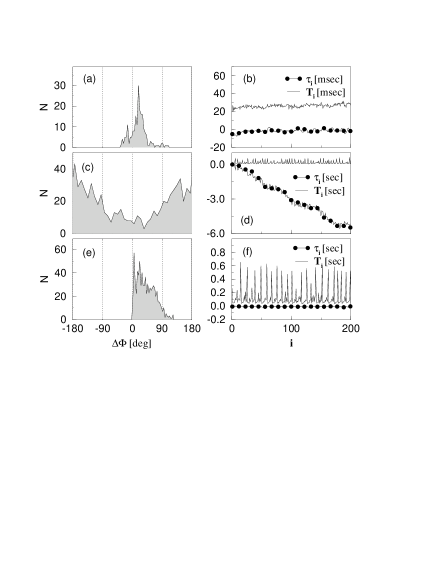
With natural coupling, spikes were synchronized during tonic firing. Figure 6a and b shows such a synchronous regime (nA and ) where all values of are within the interval , and the value of oscillates but remains smaller than , see Fig. 2d. In the spiking-bursting regime, natural coupling did not synchronize the spikes (unlike the slow oscillations) (Figs. 6c and d). In this condition (nA and : cf. Fig. 2a), the constant drift of indicated a difference in spike frequencies; nevertheless, the non-uniform distribution of indicated that the neurons were not far from the threshold for spike synchronization. Indeed, the spikes of bursting neurons became synchronized when artificial (positive) coupling was added (Figs. 6e and f: and nS).
Our observations indicate that the slow oscillations and fast spikes of these two neurons have different thresholds for the onset of synchronization. This can be understood in terms of the different sites of origin of the two types of voltage signal, the different mechanisms of synchronization, and the different conduction pathways and attenuation factors involved (cf. Fig. 1 and associated text). The slow voltage oscillations that underlie bursting activity arise as a result of voltage-dependent ion channel activity in the membrane of neuropilar processes. The summed voltage signal will suffer some attenuation as it spreads by local current flow in the leaky cable array of the neuropil. However, two factors favor its effective transmission between the neurons: the location of electrical coupling sites close to the site of slow wave generation, and the slow timecourse of the voltage signal itself. In combination, these should allow a relatively strong and continuous interaction between the irregular slow oscillators. This mechanism resembles the synchronization seen in dissipatively coupled chaotic electrical circuits [10]. In contrast, fast spike signals suffer strong attenuation as they spread between the spike initiation zone at the origin of the axon and the coupling sites in the neuropil. These factors argue for weak current flow between spike generators. If the spike generator of one neuron is close enough to its threshold, the transient current from the coupling pathway may drive it to phase-locked firing. In electrical circuits, this type of chaotic pulse synchronization is known as threshold synchronization [11]. With natural coupling, this threshold mechanism can synchronize spike activity in tonic firing but not in the bursting regime. When the neurons generate slow voltage oscillations, ion channel open in neuropilar processes, decreasing the membrane resistance: this shunts the spike-evoked currents as they flow in their coupling pathway, causing a failure in threshold synchronization.
As the strength of net coupling is decreased, the slow oscillations remain irregular with little change in waveform, but make a sharp transition from synchronous to asynchronous behavior, see Figs 4, 5. When the net coupling reaches an expected, negative conductance, the slow oscillations re-synchronize in antiphase and become regular. These bifurcations argue for a dynamical origin of the irregular neuronal activity. Based on these observations we have built a two-compartment model of the stomatogastric neuron. The model incorporate six active ionic currents distributed in soma-neuropil and axon, and takes into account slow, intercellular Ca++ dynamics. Two such model neurons, when electrically coupled, reproduce all five types of behavior found in our experiments and the transitions between the regimes are consistent with the observations reported here, see Ref. [12].
This work was supported by NIH grant NS09322 and NSF grant IBN-9122712 and U.S. Department of Energy grants DE-FG03-90ER14138 and DE-FG03-96ER14592.
REFERENCES
- [1] L. Glass, inThe Handbook of Brain Theory and Neural Networks, Ed. M. Arbib (MIT Press, Cambridge, MA), 186 (1995); M.I. Rabinovich and H.D.I. Abarbanel Neuroscience 87, 5 (1998).
- [2] C.M. Gray J. Comput. Neurosci. 1, 11 (1994); M. Meister Science 252, 939 (1991).
- [3] R. M. Harris-Warrick, et al, Dynamic Biological Networks: The Stomatogastric Nervous System, (MIT Press, Cambridge, MA), 1992.
- [4] A.A. Sharp, L.F. Abbott, and E. Marder, J. Neurophysiol. 67, 1691 (1993).
- [5] D. K. Hartline and K. Graubard In: Dynamic Biological Networks: The Stomatogastric Nervous System eds. R. M. Harris-Warrick et al., (1992) pp. 31 - 85; K. Graubard and D.K. Hartline,Brain Research 557, 241 (1991); D.H. Edwards, Jr. and B. Mulloney,J. Physiol. 348, 89 (1984).
- [6] Measurements of the magnitude of the natural coupling conductance is complicated by axial and shunting (leak) conductances that intervene between the sites of electrode insertion (somata) and electrical coupling (fine neurites). Estimates center around 100-200nS: cf. M. Gola and A. I. Selverston, J. Comp. Physiol. 145, 191 (1981); B.R. Johnson, J.H. Peck and R.M. Harris-Warrick, J. Comp. Physiol. 172 715 (1993).
- [7] The STG received separate superfusion with saline whose temperature variation was maintained within C during recording sessions (ranges between experiments, to C). See for details B. Mulloney and A. I. Selverston,J. Comp. Physiol. 91 , 1 (1974).
- [8] Details of the procedure for synaptic isolation are found in T. Bal, F. Nagy, and M. Moulins, J. Comp. Physiol. 163, 715 (1988); J.P. Miller and A.I. Selverston J. Neurophysiol. 48, 1378 (1982).
- [9] The artificial synapse was implemented by an analog circuit as in [4] or by a computer-based dynamic current clamp as in A.A. Sharp, M.B. O’Neil, L.F. Abbott, and E. Marder, J. Neurophysiol. 69, 992 (1993).
- [10] V.S. Afraimovich, N.N. Verichev and M.I. Rabinovich Radiophys. Quant. Electr. 29, 747 (1986); J.F. Heagy, L.M. Pecora and T.L. Carroll Phys. Rev. E 50, 1874 (1994); N.F. Rulkov et al, Int. J. Bif. and Chaos 2, 669 (1992)
- [11] N. F. Rulkov and A. R. Volkovskii Physics Letters A 179, 332 (1993); Carroll, T.L., Biological Cybernetics, 73, 553 (1995).
- [12] M.I. Rabinovich et al, Physica A, (1998) (to be published).