SNUTP 96-129
Chaos in the segments from Korean Traditional Singing and Western Singing
We investigate the time series of the segments from a Korean traditional song “Gwansanyungma” and a western song “La Mamma Morta” using chaotic analysis techniques. It is found that the phase portrait in the reconstructed state space of the time series of the segment from the Korean traditional song has a more complex structure in comparison with the segment from the western songs. The segment from the Korean traditional song has the correlation dimension 4.4 and two positive Lyapunov exponents which show that the dynamic related to the Korean traditional song is a high dimensional hyperchaotic process. On the other hand, the segment from the western song with only one positive Lyapunov exponent and the correlation dimension 2.5 exhibits low dimensional chaotic behavior.
1 Introduction
Until recently it has been thought that complicated phenomena result from complicated dynamical systems with many degrees of freedom and they have been usually considered as stochastic processes. But it turned out that even simple systems with few degrees of freedom can exhibit extremely irregular unpredictable behavior when the systems are described by nonlinear deterministic equations. The most typical example is chaos which shows extremely sensitive dependence on initial conditions.
Several authors have analyzed speech data using techniques for studying chaotic dynamics[1]. Despite the apparently complicated mechanism of vocal production, which involves various aspects such as physiological activities and nonlinear fluid mechanics, the concept of deterministic chaos implies the possibility that the complex irregularities may be generated by deterministic nonlinear dynamics with only a few state variables. It has been reported that human speech sounds exhibit bifurcations and chaos[2], for example, in fricative consonants[3], vowels[4], newborn infant cries[5], various phoneme types[6] and Korean traditional singing[7]. In this paper we analyze the irregularities and the dynamics in the time series of the segments from a Korean traditional song and a western song. In order to check our method of analysis a single note “Si” is also analysed. In section 2, our data acquisition from the Korean traditional song, the western song and the note “Si’ is explained. In section 3, the power spectra of the time series are given and in section 4, the phase portraits which give geometrical information included in the time series are constructed by the delay vector method. In section 5, the correlation dimension of the attractors in the reconstructed space are calculated to characterize properties of the attractor. In section 6, Lyapunov exponents are estimated. The above mentioned three songs are compared in sections three through six. In the last section brief discussion is given.
2 Data Acquisition
In each section, for the sake of comparison, segments of a Korean traditional song, segments of a western song and the note “Si” are analyzed at the same time. The song used as Korean traditional singing, “Gwansanyungma” is a SeoDo folk song which has been sung in the northwestern provinces of Korea. It includes various kinds of vocalization of SeoDo folk song, especially the peculiar vibration. The song we used was sung in 1994 by Pok-Nyǒ O who was born in P’yǒngyang in 1913 and was designated as one of the human cultural assets in 1971. Its length is about 220 seconds and its words and phonetic transcription using single-symbol ARPAbet are given in Table 1. As seen in Table 1, they are divided into 19 sections to identify which sections show chaotic behavior. We calculated the power spectrum for each section. After getting insight about the characteristics of each section from the power spectrum, we choose the 8th section for obtaining the phase portrait, correlation dimension and Lyapunov exponent because the 8th section showed the most broadband power spectrum and was thought to represent the characteristics of SeoDo folk song most properly. Actually only the latter part of the 8th section is used, whose length is about 1.6 seconds and its phoneme is described by the vibrating vowel /a/. As a western song,“La Mamma Morta” performed by Maria Callas is used. Especially the segments which don’t have background music are used to facilitate the analysis. Its length is about 1 second and the phoneme is also /a/. The single note “Si” of the “Do-re-mi song” in the movie ‘Sound of music’ is used to check our methods of analysis. Its length is about 0.5 second. The consonant /s/ is uttered only for a very short time, so the actually recorded and analysed sound is /i/.
All the data are recorded in the form of wave files with PCM (Pulse Code Modulation) mode using ‘Sound Blaster AWE32’ which is the trademark of Creative Technology Ltd. It is performed with sampling rate 22050 Hz and 16 bits except the single note “Si” with 44100 Hz owing to its short length. Programs to analyze the recorded wave files run on an IBM PC.
3 Power spectrum
The Fourier analysis of time series is useful for obtaining, among other things, the frequency components and the power distribution as a function of frequency. In general the power spectrum is a very good tool for the visualization of periodic and quasi-periodic phenomena, and their separation from irregular time evolutions which are characterized by broadband power spectra[8]. The broadband regions in power spectra can arise from stochastic or deterministic processes, but the decay in the spectral power at large is different for the two cases[9] [10]. However, that is not really a good indicator to identify chaotic time series. So we need to estimate correlation dimension and Lyapunov exponents,etc. We use the FFT to compute a power spectrum.
In the case of Korean traditional song it is obtained for each section divided in order to identify whether each section shows chaotic behavior or not. The sections with broad power spectrum are marked with “” in Table 1. Figure 1 shows the power spectrum obtained from the time series of the Korean traditional song, western song and a single note “Si”. In the case of Korean traditional song it is that of the most typical case with broad power spectrum(8th section). We can see the broadband regions in the power spectrum of the Korean traditional song which is a characteristics of chaotic systems. The power spectrum of the western song shows less broadband power in comparison with the Korean traditional song and we can see -function like peak in power spectrum of a single note “Si”. As the data to investigate phase portrait, correlation dimension and Lyapunov exponents for the Korean traditional song, we choose the 8th section which shows the most broadband power spectrum.
4 Phase portraits
Several variables are usually required to fully describe the state of a system. Thus, in order to construct a dynamical model for an experimental time series, we must first reconstruct a state space[11].
A simple way to create a state representation is to form vectors of the consecutive samples of the time series which are delay vectors . The delay vector, , at time is defined by:
| (1) |
where , are called the embedding dimension, delay time, respectively and stands for the time series. This choice of state representation is commonly known as delay vector method. Takens[12] proved that if is the dimension of a manifold containing the attractor, in order to yield a topological equivalent phase portrait, leaving the dynamical parameters invariant, it is sufficient to choose such that:
| (2) |
The choice of optimal delay time is an important and largely unresolved problem. Even though the choice of delay time is arbitrary for an infinite amount of noise-free data[12], in the case of real laboratory data a good choice of is essential for geometrical and numerical analysis of a phase portrait. As , the trajectory approaches the identity line. When is larger than the optimal value, the correlation between the data points is destroyed.
A commonly used rule of thumb is to set to be the time lag required for the autocorrelation function to become negative, or alternatively, the time lag required for the autocorrelation to decrease by a factor of (from its value at time lag ). Another approach, that of Fraser and Swinney[13] uses the “mutual information”, which measures a more general dependence of two variables. Schuster and Liebert[14] took the first minimum of the logarithm of the generalized correlation integral as a criterion for a proper choice of the delay time. In choosing the optimal delay time, our scheme is as follows: At first we obtain 3-dimensional projections of phase portraits with different delay times and then choose delay time at which value overfolding or the straight line do not appear in the 3-dimensional projections as an optimal delay time. Once we reconstruct a -dimensional space in this way, we can obtain a good representation of the attractor and also obtain an appropriate correlation dimension with this delay time. We also obtain the phase portraits for delay time at which value the autocorrelation decreases to of its initial value and the result is nearly the same as we use the delay time obtained with 3-dimensional projection.
Figures 2-4 show the 3-dimensional phase portraits of the segments from the Korean traditional song, the western song and the single note “Si” respectively. We can see that the phase portrait of the segments from the Korean traditional song wrinkles and occupies an extended region. This does not necessarily imply that the behavior is stochastic, but rather that the dimension of the strange attractor is too large to be determined by visual inspection of the attractor. For these attractors the dimension must be calculated quantitatively. The phase portrait of the segment from the western song also shows complicated and tangled structure. Comparing these two phase portraits we can infer that the attractor of the segment from the Korean traditional song will have a higher value of dimension than that of the segment from the western song because it has a more complex structure in comparison with the western song. The phase portrait of single note “Si” is supposed to represent a limit cycle but has thickness due to noises. It is essentially a periodic system and accords with the result of the power spectrum.
5 Correlation dimension
The dimension of a phase portrait is clearly the first level of knowledge necessary to characterize its properties and also gives us a lower bound on the number of essential variables needed to model the dynamics. We calculate the correlation dimension which is relatively easy to compute. It can be calculated by measuring the correlation integral, which represents the spatial correlation of the points on the attractor, defined by[15]
| (3) |
then one observes that as ,
| (4) |
giving the working definition of the correlation dimension, . But it is known that for limited data sets with high autocorrelation the correlation integral displays an anomalous shoulder which hinders good estimates of dimension[16]. It is because the distances between these pairs of points which are not well separated in time do not really reflect the geometrical properties of the attractor. So we use the modified correlation integral , which discards the pairs of points closer together than in time[17],
| (5) |
which gives the standard algorithm when . In this calculation the autocorrelation time is used as a value of .
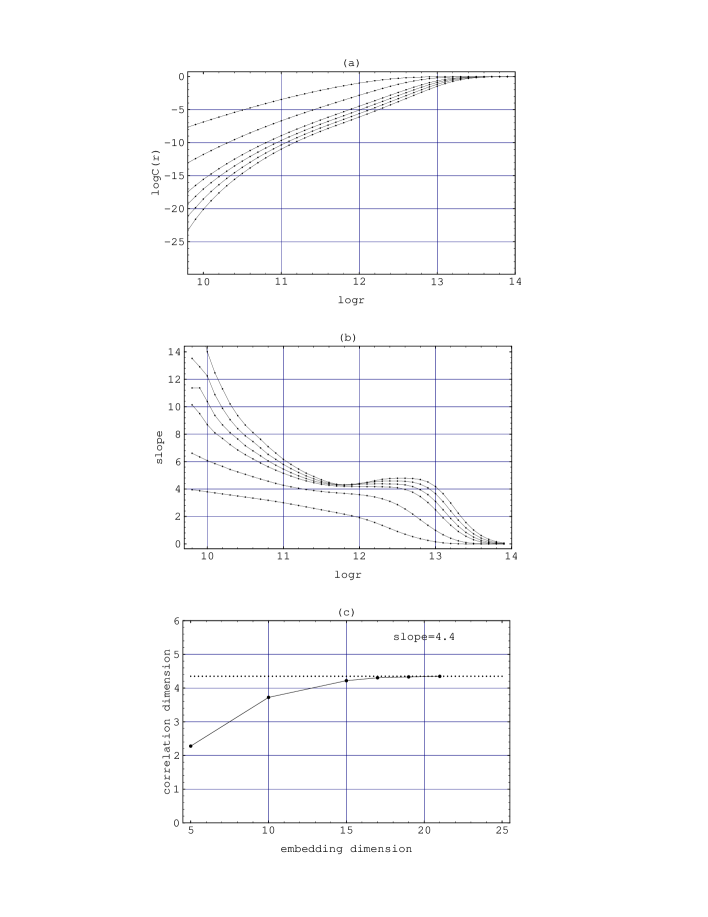
Plotting the value of versus on a log-log plot gives a slope for small . From this plotting of versus , one can distinguish low dimensional deterministic chaotic signals from stochastic noise. For the deterministic signal, if one increases the embedding dimension , the slope of versus at first also increases but settles at a value of and becomes independent of the embedding dimension. For random noise, the slope of versus increases indefinitely as the embedding dimension is increased.
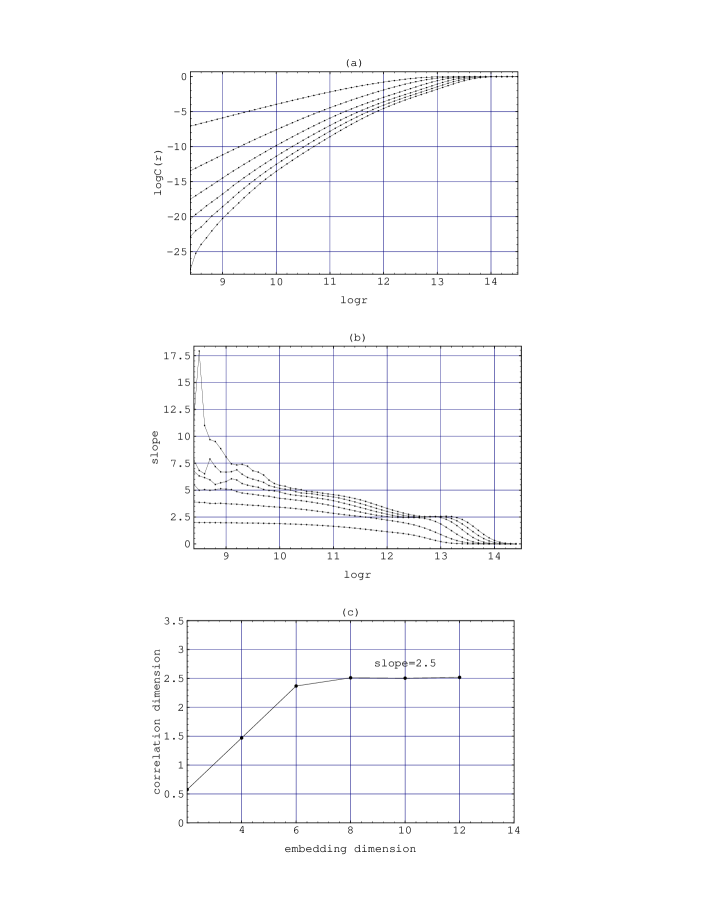
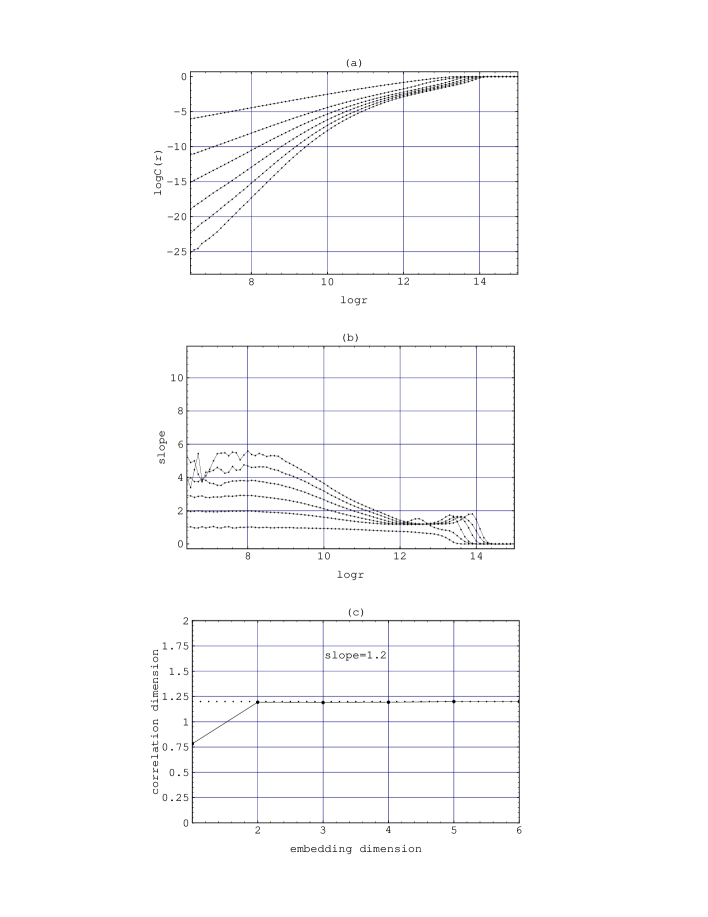
The correlation dimension is measured using data points for time series of the segment from the Korean traditional song. The slope of versus plot of the segment from the Korean traditional song is saturated at a value of about 4.4 independent of the embedding dimension, which we assume to be the correlation dimension of the attractor (Figure 5). The slope of versus plot of the segment from the western song measured using data points is saturated at a value of about 2.5 independent of the embedding dimension (Figure 6). The correlation dimension of the attractor obtained from a single note “Si” with data points is about 1.2 (Figure 7). It is thought that a noise causes the correlation dimension to be saturated at a higher value than the expected value 1.0. In these all cases we calculated the correlation dimensions for several reasonable values of delay time, which are obtained from phase portrait and autocorrelation. The correlation dimension itself was almost the same except that when delay time is such that the autocorrelation of time series decreases to of its initial value the correlation dimension is saturated at lower embedding dimension.
6 Lyapunov exponents
Lyapunov exponents are one of the most important quantities used to distinguish chaotic from nonchaotic behavior. When a dynamic is chaotic, positive Lyapunov exponents occur that quantify the rate of separation of neighboring (initial) states and give the time duration where predictions are possible. For such experimental works as our case, methods for computing the Lyapunov exponents of a given time series are of great importance. The different algorithms that have been proposed during the last decade for this purpose are all based on the reconstruction of the corresponding attractor by means of delay vector method with suitable embedding dimension. Most of the methods are based on approximations of the unknown flow governing the dynamics on the reconstructed attractor in embedding space. From the sequence of Jacobians of this flow at the state points along the reconstructed orbit, the Lyapunov exponents can be computed by standard methods[18][19]. The crucial point of this approach is the accuracy of the approximation of the Jacobian of the unknown flow. The most often used algorithms to achieve this goal are based on linear approximations. In this paper, we used Eckmann & Ruelle algorithm[19].
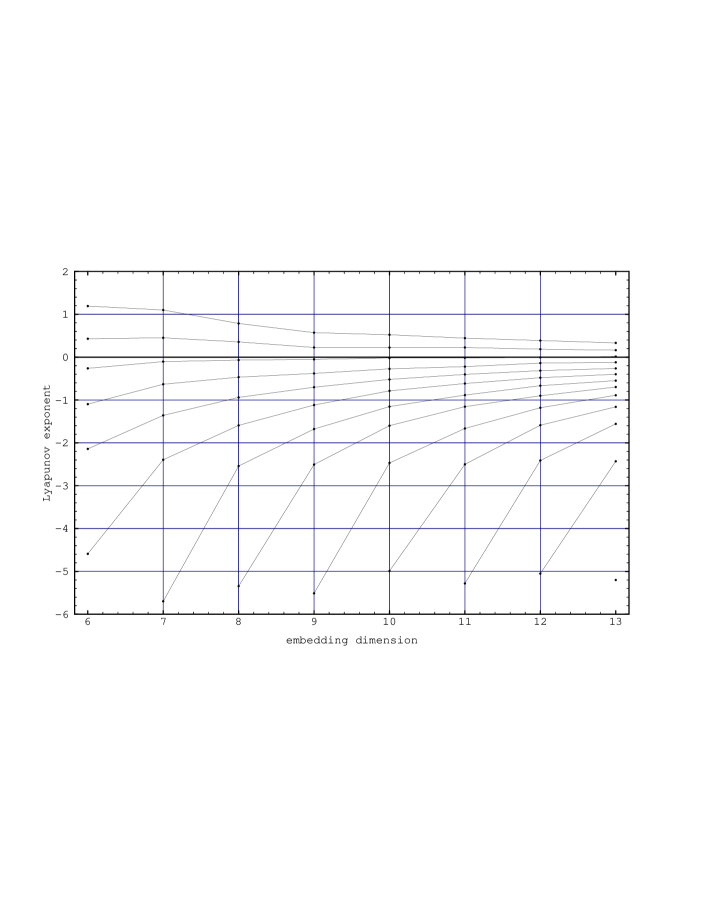
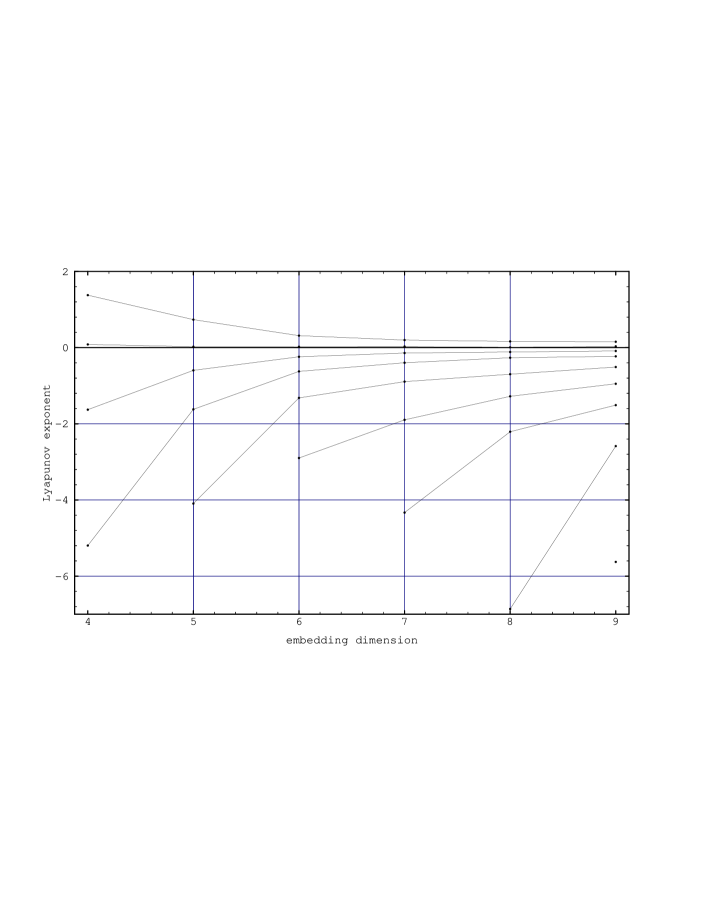
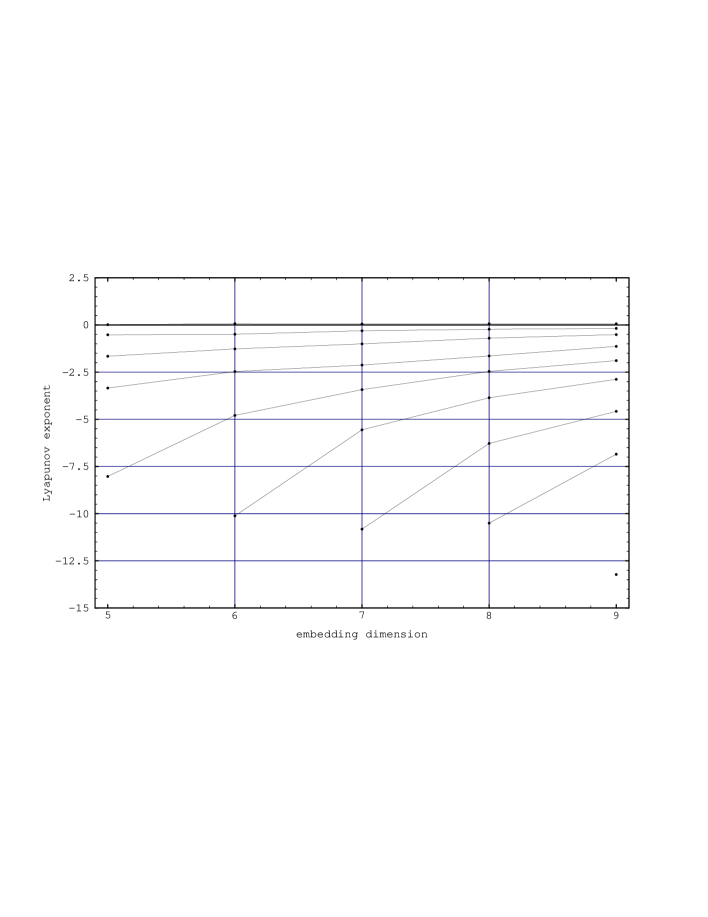
In the Eckmann Ruelle algorithm, it is very important to choose appropriate values of the embedding dimension and range . We choose the range, , which is about 3-5 of the horizontal extent of the analysed attractor[18]. The delay vector to calculate Lyapunov exponents is obtained by the same way for the same data as in the case of correlation dimension. We estimate the Lyapunov spectra at various embedding dimensions and then identify the true Lyapunov exponents and the spurious Lyapunov exponents on the point of view that true Lyapunov exponents do not vary much over a range of , while the spurious ones wander with [20]. We also calculate the Lyapunov exponents for the different parameters(delay time, range, e.t.c.) and the result is such that the sign of the largest Lyapunov exponents does not change.
Figures 8-10 show the Lyapunov exponents with increased using the time series of the segments from the Korean traditional song, the western song and “Si”. We obtain two positive Lyapunov exponents in time series of the segment from the Korean traditional song, which indicate that the attractor is a hyperchaotic attractor with two directions of expansion. It is known that it is possible to find hyperchaotic attractors with two or more positive Lyapunov exponents only in higher (at least four) dimensional systems[21], which accords with our result that the correlation dimension of the Korean traditional song is about 4.4. From the segment of the western song we obtain one positive Lyapunov exponent which means that the dynamic is a chaotic process. The Lyapunov dimension for the time series of segments from the Korean traditional song and western song is calculated by the Kaplan-Yorke formulae[22]. In the case of the segment from the Korean traditional song we obtain 4.5-5.3 as the Lyapunov dimension for the embedding dimension from 9 to 13, and 3.1-3.4 with the embedding dimension from 6 to 9 for the segment from the western song. The result turns out that the Lyapunov dimensions in these two cases are a little higher than the correlation dimensions, but it is known that the Lyapunov dimension forms an upper limit for the information dimension as far as higher-dimensional systems are concerned[23]. As we expect, Lyapunov exponents from the single note “Si” is , which exhibit characteristics of a limit cycle.
7 Discussion
In this paper, we examine the music signals from the Korean traditional song “Gwansanyungma”, the western song “La Mamma Morta” and the single note “Si” through power spectra, phase portraits, the correlation dimension and Lyapunov exponents. From the time series of the segments from the Korean traditional song, we obtain a broadband power spectrum and the phase portrait with a complex and wrinkled structure in the reconstructed phase space. From the result of estimating the correlation dimension and the Lyapunov exponents, we can conclude that the underlying dynamics of the segment from the Korean traditional song is a high dimensional () hyperchaotic system which has two directions diverging exponentially. The time series of the segment from the western song gives a power spectrum with a little broadband power and its phase portrait occupies an extended region. Measurement of correlation dimension of it revealed that its trajectory lies on an attractor with dimension about 2.5. The result that one of Lyapunov exponents of the segment from the western song is a positive value shows that it is a chaotic system of which nearby trajectories exponentially diverge on the average. The time series of the single note “Si” which is chosen to confirm our analysis methods shows that it is from a periodic system as we expect, that is, it has -function shaped power spectrum, a limit cycle blurred by noise in the reconstructed phase space, the correlation dimension of about 1.2 and the largest Lyapunov exponent zero.
In conclusion, we can observe hyperchaotic behavior in the segment from the Korean traditional song and chaotic property in the segment from the western song. It gives some hints for modelling certain aspects of the sound production of the vocal system, especially approaching the vocalization methods. Large dimensionality of the segment from the Korean traditional song in comparison with the segment from the western song means that its system is more complex and has more degrees of freedom. It is thought that it results from the peculiar vocalization of the Korean traditional song, especially vibrating techniques of SeoDo folk song.
We did not investigate the whole parts but only the segments from the Korean traditional song and the western song, which are thought to reflect adequately the characteristics of the Korean traditional song and the western song. Further study is needed to generalize above results by investigating more data sets and relate the method of vocalization with chaos more precisely.
ACKNOWLEDGMENTS
This work was supported in parts by the Center for Theoretical Physics, Seoul National University, and by the Basic Science Research Institute, Ministry of Education under Project No. BSRI-96-2418.
References
- [1] B. Townshend, In Nonlinear Modeling and Forecasting, edited by M. Casdagli and S. Euband (Addison-Wesley, Reading, MA, 1992), pp.433-453.
- [2] H. Herzel, Appl. Mech. Rev. 46, 399(1993).
- [3] S. S. Narayanan and A. A. Alwan, J. Acoust. Soc. Am. 97, 2511(1995).
- [4] I. Tokuda, R. Tokunaga and K. Aihara, International Journal of Bifurcation and chaos 6, 149(1996).
- [5] W. Mende, H. Herzel and K. Wermke, Phys. Lett. A 145, 418(1990).
- [6] A. Kumar and S. K. Mullick, J. Acoust. Soc. Am. 100, 615(1996).
- [7] M.-H. Lee and K.-S. Soh, Sae mulli(New Phys.) 36, 344(1996).
- [8] J. P. Eckmann, and D. Ruelle, Rev. Mod. Phys. 57, 617(1985).
- [9] H. S. Greenside, G. Ahlers, P. C. Hohenberg, and R. W. Walden, Physica 5D, 322(1982).
- [10] D. Sigeti and W. Horsthemke, Phys. Rev. A 35, 2276(1987).
- [11] D. S. Broomhead and G. P. King, Physica D 20, 217(1986).
- [12] F. Takens, In Dynamical Systems and Turbulence, edited by D. Rand and L. S. Young (Springer-Verlag, Berlin, 1981).
- [13] A. M. Fraser and H. L. Swinney, Phys. Rev. A 33, 1134(1986).
- [14] H. G. Schuster and W. Liebert, Phys. Lett. A 142, 107(1989).
- [15] P. Grassberger and I. Procaccia, Physica D 9, 189(1983).
- [16] J. Theiler, Phys. Rev. A 34, 2427(1986).
- [17] J.Theiler, Quantifying chaos:practical estimation of the correlation dimension, Ph.D. thesis,Caltech, 1988.
- [18] M. Sano and Y. Sawada, Phys. Rev. Lett. 55, 1082(1985).
- [19] J.P. Eckmann, S.O. Kamphorst, D. Ruelle, S. Ciliberto, Phys. Rev. A 34, 4971(1986).
- [20] Th.-M. Kruel, M. Eiswirth and F.W. Schneider, Physica D 63, 117(1993).
- [21] O. E. Rossler, Phys. Lett. A 71, 155(1979).
- [22] J. L. Kaplan and J. A. Yorke, Lecture Notes in Mathematics 730, 204(1987).
- [23] P. Grassberger and I. Procaccia, Physica D 13, 34(1984).
(The sections with broad power spectrum are marked with “”.)
| No | Words | Phonetic transcription | Time |
|---|---|---|---|
| 1 | ch’ugangi | /CUgaGi/ | 35 s |
| 2 | i | /i/ | 10.0 s |
| 3 | i | /i/ | 14.5 s |
| 4 () | chǒgma | /Jxma/ | 10 s |
| 5 () | ak | /ak/ | 9.0 s |
| 6 () | ǒryong | /xrycG/ | 6.0 s |
| 7 | naeng | /nEG/ | 12.5 s |
| 8 () | ha | /ha/ | 11.5 s |
| 9 () | ni | /ni/ | 8.5 s |
| 10 () | i | /i/ | 9.5 s |
| 11 () | hi | /hi/ | 7.5 s |
| 12 () | injae | /inJE/ | 3.0 s |
| 13 | aei | /Ei/ | 9.0 s |
| 14 () | i | /i/ | 9.5 s |
| 15 () | sǒ | /sx/ | 7.0 s |
| 16 | p’u | /pu/ | 13.0 s |
| 17 | u | /u/ | 8.0 s |
| 18 () | ung | /uG/ | 13.0 s |
| 19 | chungsǒnrurǔl | /JUGsxNrUrL/ | 15.0 s |
(“” means that the peculiar vibration of SeoDo folk song is used.)