Surface Structure and Catalytic Oxidation Oscillations
Abstract
A cellular automaton model is used to describe the dynamics of the catalytic oxidation of on a surface. The cellular automaton rules account for the structural phase transformations of the substrate, the reaction kinetics of the adsorbed phase and diffusion of adsorbed species. The model is used to explore the spatial structure that underlies the global oscillations observed in some parameter regimes. The spatiotemporal dynamics varies significantly within the oscillatory regime and depends on the harmonic or relaxational character of the global oscillations. Diffusion of adsorbed plays an important role in the synchronization of the patterns on the substrate and this effect is also studied.
I Introduction
The study of catalytic oxidation processes on surfaces is of considerable interest since the apparently simple kinetics of this reaction can give rise to different types of behavior as a result of competing surface processes, substrate phase transformations and global coupling effects. Extensive investigations have been carried out in the last decade including both experiment and theory[1, 2]. Experiments have demonstrated the existence of a variety of non-linear phenonena such as nucleation-induced front propagation, spiral wave dynamics, faceting structures and kinetic oscillations.[2]
In this article we re-examine some aspects of the global oscillations observed in the oxidation of on surfaces.[3, 4] By “global” we mean oscillations in concentrations of adsorbed species or substrate states averaged over the entire crystal surface or, in experiments, some macroscopic region of the surface. The principal features that give rise to such oscillations, which involve coupling between surface phase transformations and the oxidation kinetics, were elucidated in earlier studies [4, 5, 6, 7] and are as follows: The surface-catalysed oxidation occurs by a Langmuir-Hinshelwood mechanism [8]:
| (1) | |||||
| (2) | |||||
| (3) | |||||
| (4) |
where the indicates an empty adsorption site. The first three steps (1-3) constitute the Langmuir-Hinshelwood mechanism. The fourth step (4) is included to prevent poisoning of the surface by adsorbed oxygen, which is not observed in experiment. It involves the direct reaction of an adsorbed oxygen atom with from the gas phase to produce in the gas phase plus an empty surface site.
The actual mechanism of oxidation on involves a coupling between the reconstruction of the surface and the adsorption and reaction kinetics[1]. The structure of the topmost layer of clean differs from that in the bulk () and is reconstructed to form a structure.[9] When the coverage exceeds a critical value this reconstruction is lifted and the surface reverts to the form. In general the reaction rates may be different for the two surface phases and we have accounted for this possibility by appending the superscript or to the rate constants in the Langmuir-Hinshelwood mechanism. Phase transformations between these two surface forms are triggered by and, in turn, influence the characteristics of diffusion and reaction kinetics. It is the switch between two surface forms with high and low reactivities that is responsible for the existence of global kinetic oscillations.
Apart from these general observations on the origin of the kinetic oscillations, it is known that for [10]the spatial coupling of different parts of the surface is caused by the propagation of chemical fronts of oxidation across the crystal surface. [4, 5, 6, 7] The nature of the wave propagation processes depends on both the type of global oscillation and the diffusion coefficient of adsorbed , . We investigate the spatial structure that underlies the global oscillations.
The most extensive theoretical descriptions of wave propagation processes associated with oxidation on various surfaces have been based on reaction-diffusion equation descriptions of the spatiotemporal dynamics [11], but lattice-gas cellular automaton models [6, 7, 12] have also been employed in such studies. These lattice-gas automata are probabilistic cellular automata that employ a particle description of the dynamics and should be distinguished from other cellular automata that are designed to simulate reaction-diffusion equation dynamics.[13, 14, 15] While most of the phenomena of interest occur on sufficiently long space and time scales that a continuum description using reaction-diffusion equations is appropriate, the cellular automaton models have the advantage that they naturally incorporate fluctuations that are responsible for the nucleation events that play a role in the process and, as well, can be extended to smaller scales where continuum models are no longer appropriate. Cellular automaton models allow one to describe the system at a mesoscopic level which incorporates the essential mechanistic features of the reaction dynamics. Several such models for surface catalysed oxidation employing simple Langmuir-Hinshelwood kinetics have been developed in the past years[16, 17].
In this paper we use a cellular automaton model for catalytic oxidation of on which accounts for the coupling among the local reaction kinetics, substrate phase transformations and diffusion of adsorbed species. This model is described in Sec. II. In Sec. III the model is used to explore various aspects of the spatiotemporal dynamics in the regime of global oscillations and, in particular, to investigate the spatial structure that gives rise to these oscillations. Section IV contains the conclusions of this study.
II Cellular Automaton Model for Oxidation
From the description given above we see that any model of this surface catalysed reaction must account for the coupling among phase transformations, diffusion and reaction. The cellular automaton model we employ has features that are like those of the Monte Carlo models[16] in that asynchronous site updating rules are used, but there are also features in the model that are adopted from reactive lattice-gas automata [18] and, for the surface phase transformation process, rules similar to those of traditional cellular automata are used.[19] The dynamics is described by the following rules:
The cellular automaton dynamics is assumed to take place on a set of regular two-dimensional lattices . One lattice, , is used to represent the substrate in its various phases ( or ). The dynamics of the adsorbed and species take place on the lattice. Each node of can support only one particle, either or . The nodes of these two lattices have identical labels .
Adsorbed species at node on can react with molecules or atoms on neighboring sites where is some neighborhood of the node . Similarly, we let be the neighborhood of node on the substrate lattice which enters in the description of the surface reconstruction process. Also, we define to be the node plus its neighbors. In the present work we consider square lattices with a total of nodes and take to be the Moore neighborhood consisting of the eight nearest and next-nearest neighbors of the node .
The macroscopic rate constants defined in (1-4) are used to construct the microscopic reaction probabilities. We define an additional rate constant that gauges whether a phase transformation will be attempted. For each such reaction rate constant we define the corresponding probability where . Thus, in the automaton rule described below will specify the probability with which any reaction in steps (1-4) or phase transformation are carried out at a lattice node.
There are three elements in the cellular automaton rule corresponding to the physical processes described above: reaction (to simplify terminology we call adsorption and desorption “reactions”), phase transformation of the substrate and diffusion of adsorbed species. Each automaton time step consists of applications of the composition of the following operations:
A node is picked at random. For node a reaction , including phase transformation, is chosen randomly with probability .
Reaction
If one of the reaction steps (1-4) is
selected and the corresponding -th reaction is
sterically allowed, the reaction takes place.
In the case of reactions involving simultaneously two nodes (for example,
adsorption) the second neighboring lattice node is chosen
randomly from and the reaction is carried out
if it is sterically allowed. The reaction probabilities account for
the overcounting of identical pairs of nodes.
Phase transformation process
If the phase transformation step is selected then substrate
phase transformations occur by the following
mechanism[12]. The substrate can exist in two phases,
and . Consider the node
on and let be
the number of molecules at node plus its neighborhood.
Here if node is occupied by and
zero otherwise. If we let be the number of neighbors in
then is the
fractional coverage of the region consisting of the node and its
neighborhood .
-
domain formation mechanism:
if all nodes in are in the phase and in is covered by , then the node is changed to with a probability . -
domain growth mechanism:
if node on is in the phase and then node is changed to with a probability , where is the number of nodes in in the phase. Here is some lower fixed fractional coverage necessary for domain growth. -
domain formation mechanism:
if if all nodes in are in the phase and then node on is changed to with a probability . -
domain growth mechanism:
if node on is in phase and if , then node is changed to with a probability , where is the number of nodes in in the phase. Here is some fixed upper fractional coverage necessary for domain growth.
We have introduced a function () of the neighborhood occupancy, , , ), where if is in phase and zero otherwise. This function models the local structure and is responsible for the phase transformation process. It can be used in a phenomenological fashion to change the characteristics of this process. The form of depends on the microscopic details of the phase transformation process.[20]
Diffusion
No diffusion in the substrate is permitted. On
diffusion occurs through random jumps of the adsorbed species
at node to one of the empty nodes in .
Some flexibility is allowed in the number of diffusion steps compared
to reaction steps. One may pick additional nodes at random
and carry out diffusive jumps. In this way large diffusion coefficients
can be simulated by increasing the number of diffusion steps per
reaction step.
Similarly very small diffusion can be simulated by increasing the number
of reaction steps for single diffusion step. A convenient
variable to gauge the ratio of diffusion to reaction is
(number of diffusion steps)/(number of
reaction steps). In addition, the diffusion
rule can be modified to account for the fact that the diffusion rates
may be different
on the or phases. Thus, the probability of a
jump from node may depend on the substrate state at that
node.
III Spatial Structure and Global Oscillations
In order to study how reaction, diffusion and phase transformation can lead to global oscillatory behavior in oxidation on and to examine the underlying pattern formation that may accompany it, we have carried out a series of simulations of the automaton. In the results presented below we have taken , , , , , and . These values reflect the fact that the major rate constant differences between the and phases occur in the adsorption on the surface: the sticking probability on the phase is much smaller than that on the phase. We have used and as bifurcation parameters. In the implementation of the phase transformation step we suppose . The parameters that enter in the phase transformation steps are , , , . was varied by changing the value of the parameter defined in Sec. II. Typically diffusion is much larger than that of and for simplicity in this study we have taken and and investigated the spatial and temporal structure as a function of and the kinetic parameters.
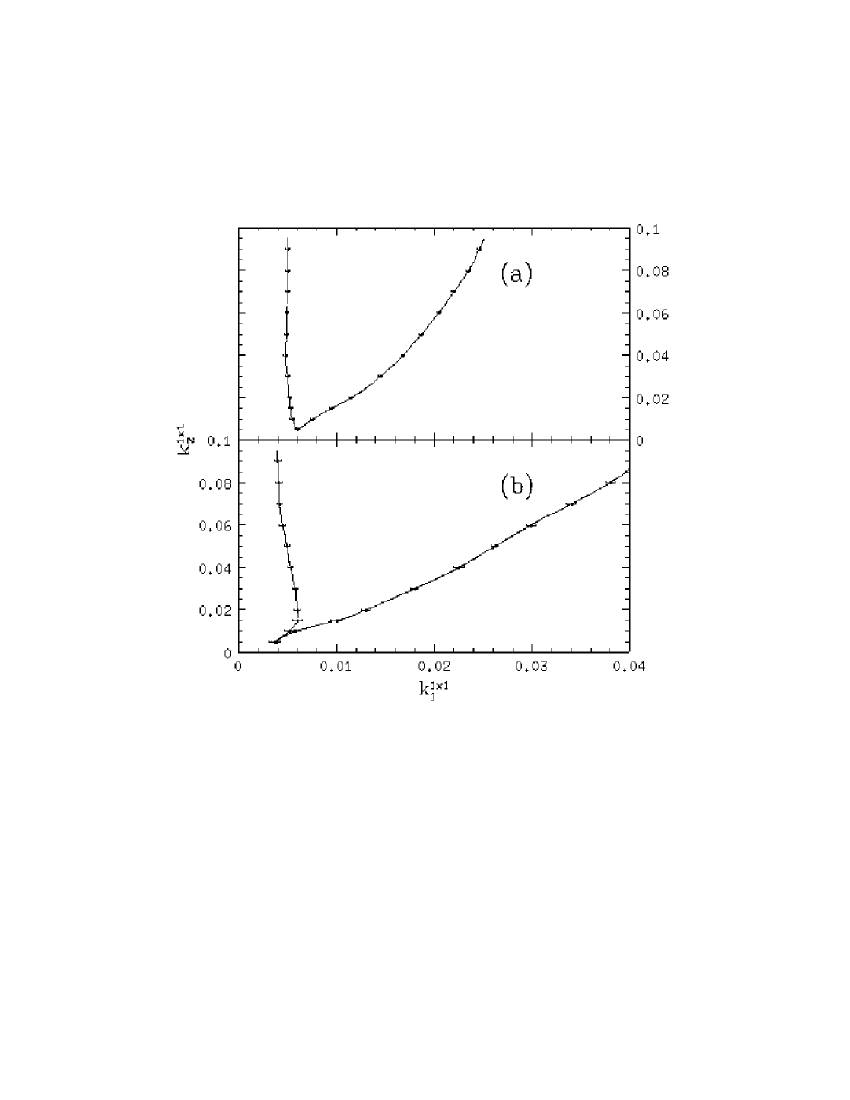
Earlier investigations[6, 7] have shown that global oscillations on are found in a cusp-shaped domain in the () parameter plane. In our model these partial pressures are incorporated in the and rate coefficients. We have confirmed that our model reproduces this structure in the () parameter plane and, furthermore, have examined how this bifurcation diagram [21] changes as varies. These results are presented in Fig. 1 which shows the region of oscillation for two values of the diffusion coefficient as gauged by ; (a) is a large value of with while (b) corresponds to a small value with . The major qualitative feature one observes is that the oscillatory region persists to higher () values when is small. An understanding of these “phase” diagrams requires an examination of the spatial structure that gives rise to the global dynamics. We now characterize the global oscillations and then discuss the underlying spatial structure.
A Global oscillations
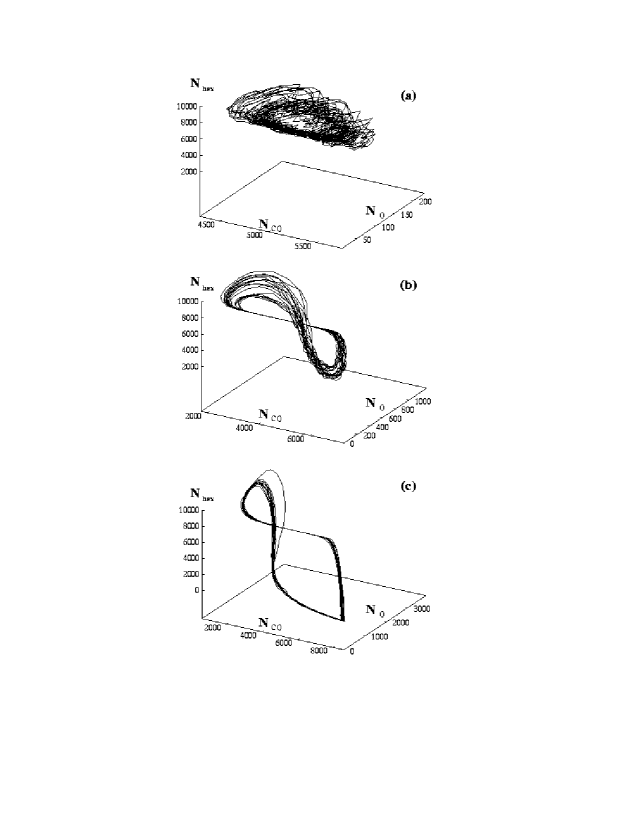
It is difficult to precisely classify the nature of the bifurcations that are responsible for oscillatory behavior since our cellular automaton model is a high-dimensional, particle-like model and we have no recourse to a simple description based on ordinary differential equations (ode). Nevertheless, some general features of the bifurcation structure are consistent with those for the global oscillations on described in Ref.[22] where a two-variable ode model that did not include the details of the spatial structure was studied. Figure 2 presents phase space plots of the total number of , molecules on the surface, and , respectively, and the total number of sites in the phase, . (Clearly, .) These three variables define the phase space () for spatially averaged dynamical variables. This figure shows the phase space trajectory for these globally averaged fields for fixed and varying , moving from low to high values of this parameter. The results suggest that the oscillations arise by a supercritical Hopf bifurcation on the leftmost boundary of the oscillatory region since the (noisy) global limit cycle is harmonic in character and its amplitude grows as one moves away from the boundary towards higher (cf. panels (a) and (b) in this figure). This noisy periodic attractor continues to grow in phase space size and evolves to the relaxation oscillation depicted in (c) close to the rightmost bifurcation boundary. In this parameter region there are distinctly identifiable slow and fast portions to the cycle. Note also that periodic attractor is far less noisy than in the harmonic regime. When the bifurcation boundary is crossed this large noisy global limit cycle suddenly crashes to a fixed point solution for the global concentration variables. Such a sudden collapse to a fixed point solution was found in ode models of oxidation on [22].
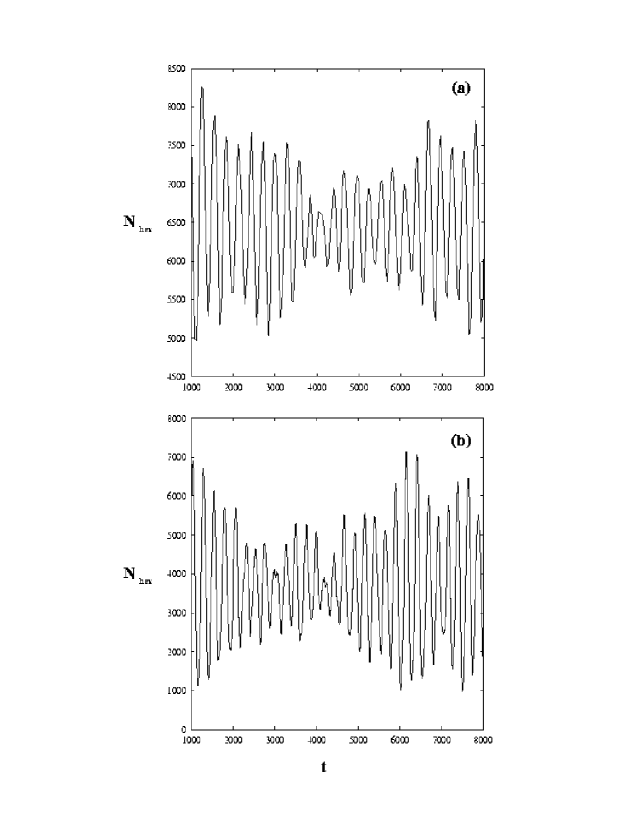
Figure 3 shows versus for a small value of () for two values of along a line in Fig. 1(b). These two values lie near the two bifurcation boundaries which showed harmonic and relaxation oscillations for large . The global oscillations are highly irregular and much less well resolved, regardless of the location within the oscillatory regime. We have chosen to plot only the time variation of a single variable rather than a phase plane plot since the irregular character of the oscillations leads to a complex phase space trajectory where the oscillatory structure is obscured. As a result the bifurcation boundaries shown in Fig. 1(b) are subject to large uncertainties.
B Spatial structure
We now consider the spatial structure that underlies these global oscillations. While it has been established that chemical waves propagating across the surface are responsible for the existence of the oscillations, we shall show that the character of these surface structures varies considerably depending on the region of parameter space within the oscillatory domain of the bifurcation diagram and the magnitude of .
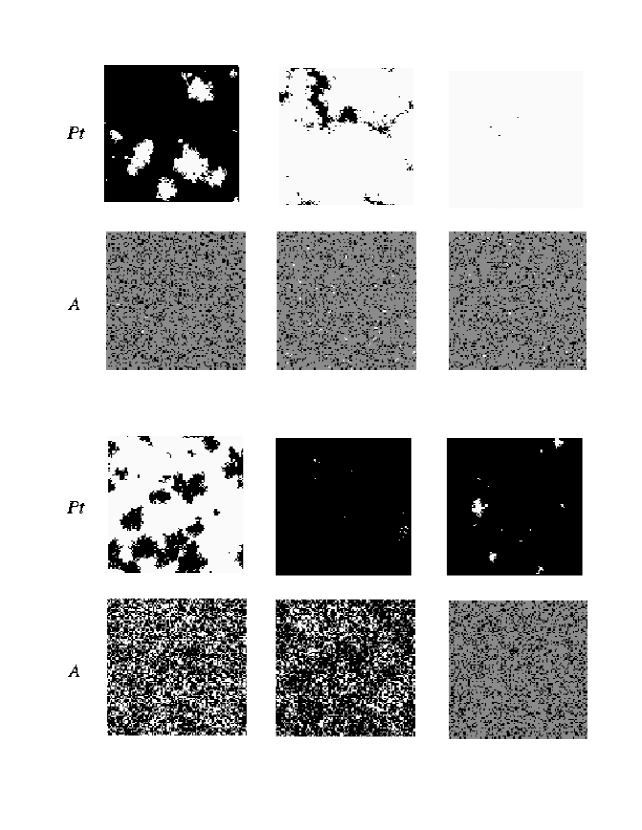
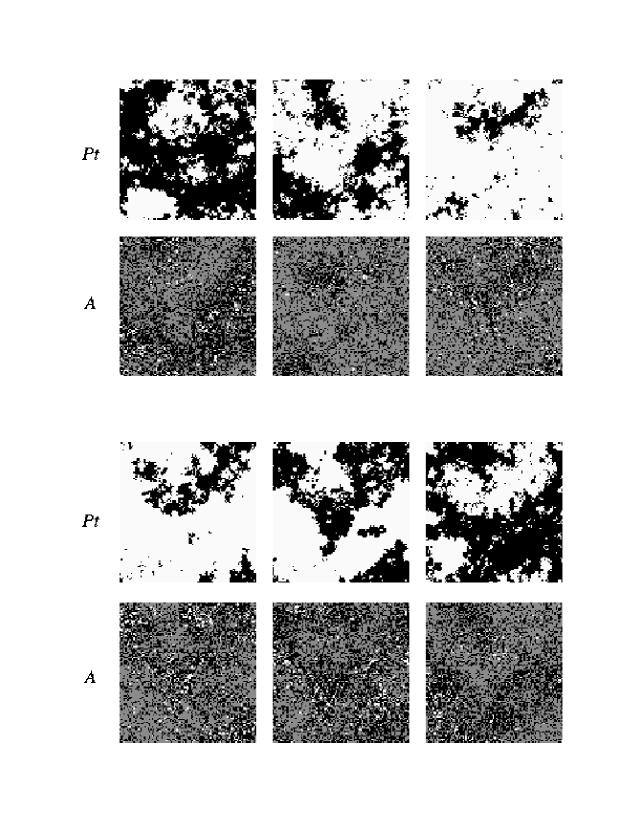
The most regular global oscillations are found for large in the oscillatory region of the bifurcation diagram corresponding to high where one observes relaxation oscillations. The spatial pattern formation that accompanies these oscillations is shown in Fig. 4 where the states of both the surface and the adsorbed phase are shown for a series of six times within one global oscillation period. The upper panels in each time group (labeled ) show the surface phases while the lower set of panels in each time group (labeled ) shows the state of the adsorbed phase. The surface exhibits well defined propagating fronts that correspond to conversion of the surface between the and phases. At the begining of the cycle shown (upper left) most of the surface is in the phase (black) and there are islands of the phase (white). Since the coverage is high the more stable surface state is the phase and the islands quickly grow and consume the phase until the entire surface is with a few very small islands barely discernible in the top right panel of the figure. With the surface in the phase, adsorption is high, is consumed and its coverage falls. The islands now grow and consume the phase until the surface reverts to a nearly complete structure with a few small islands. If one observes the spatiotemporal dynamics over many global oscillation periods one sees a constantly changing pattern of waves of phase transformation sweeping over the surface but the dynamics is sufficiently well synchronized that the cycling time between the “-rich” and “-rich” phases is nearly constant.
In the model the adsorbed atoms do not diffuse but does. Apart from some small scale fluctuations the adsorbed species are uniformly distributed and do not exhibit chemical waves (cf. panels in Fig. 4). In this case is sufficiently large () that diffusion is able to maintain homogeneity over the finite simulation domain. A rough estimate of the diffusion length is , where is the oscillation period. For the conditions of the simulation described above we have , and so that the ratio of the diffusion length to the system size is and one expects diffusion to homogenize the concentration gradients, as is indeed observed. The adsorbed species concentrations oscillate but there is almost no pattern formation in the adsorbed layer.
When is smaller () there are time episodes where the waves of phase transformation that sweep the surface are no longer synchronized. This desynchronization is evident in the plots of versus shown in Fig. 3 where one observes trajectory segments with large amplitude and others with small amplitude. In the time segments where the global concentrations have small amplitude the spatial structure is highly disorganized. Figure 5 shows the spatial structure during such a small-amplitude episode where one sees that the irregular time variation of the global trajectory arises from the irregular surface structure: while waves of phase transformation still sweep across the surface, the nucleation and growth events have a highly random character. The surface does not revert to a nearly pure or form since new nucleation and growth events occur before others are completed. For the system parameters in this case we have and which is much smaller than the system length, . In this circumstance diffusion will no longer be able to maintain spatial homogeneity in the concentration across the surface. This is evident in the lower panels () in Fig. 5 which show the local concentrations of the adsorbed species: there are now significant spatial variations in the adsorbed species concentrations.
Of course, the general structure of these results is to be anticipated on physical grounds. A fixed value of the diffusion coefficient and kinetic parameters implies a fixed diffusion length . As the system size increases it will be impossible for diffusion to maintain a synchronized dynamics across the entire surface and one should observe phase turbulence. [23] If the results for small diffusion are viewed on smaller length scales, small compared to the diffusion length, then synchronized dynamics will again be observed. The domain over which the global concentrations are computed in experiment is related to the area of the surface probed by the various measuring techniques. This point has been discussed in Refs. [6, 7]. Apart from these rather general observations it is interesting to recall that in the present model only diffuses and it is the substrate state that exhibits the most well defined surface structure. This structure is best organized when there is no spatial pattern in the adsorbed phase. In this sense the standard arguments leading to phase turbulence take a somewhat different character that makes the results presented here less obvious.
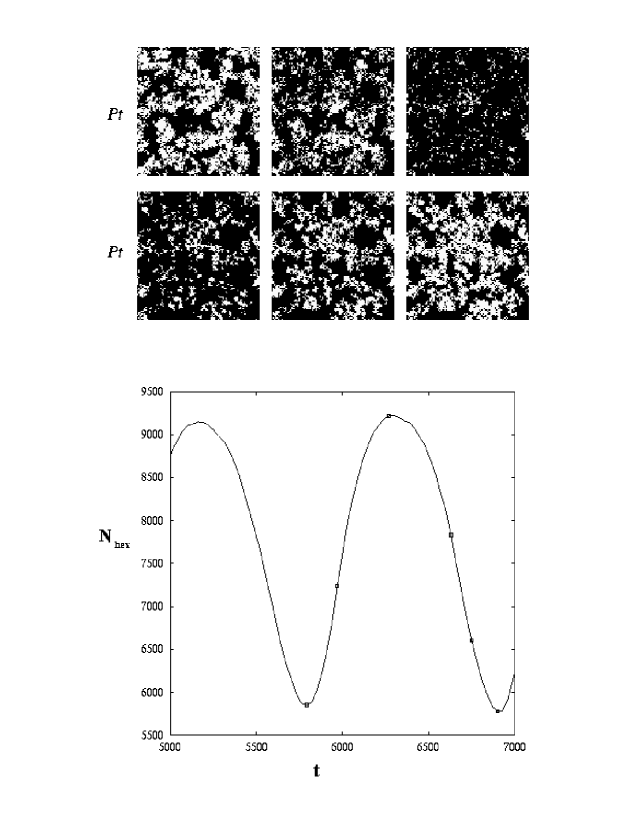
Next, we consider the behavior near the bifurcation boundary where the oscillations are harmonic in character and appear to arise from a Hopf bifurcation. Here the situation is quite different, even for the large diffusion case where the global oscillations are well defined. In view of the fact that the global oscillations grow in amplitude and are small just within the bifurcation boundary, we need to examine how it is possible for such small-amplitude oscillations to arise in the spatially distributed medium. This can be understood from a study of Fig. 6 which shows the state of the surface during one global oscillation period. The open squares on the curve showing versus in lower panel of this figure indicate the times in the global oscillation cycle corresponding to the surface structure in the upper panels. In contrast to the rapidly growing waves of phase transformation that sweep across the surface in the relaxation oscillation regime, here one observes that large portions of the surface remain in the phase throughout the global oscillation cycle. The growth of now largely occurs by repeated nucleation events which tend to “fill in ” the seas. The islands do, of course, grow and shrink to some extent but one does not observe the well-defined waves of phase transformation as in the global relaxation oscillation case. One sees that some islands persist throughout the global oscillation cycle and their shape changes slowly over several cycles. Consequently, a different spatial mechanism underlies these harmonic oscillations.
IV Conclusion
The automaton described in this paper incorporates the reactive processes in the adsorbed layer as well as phase transformations in the substrate. We have demonstrated that it is able to capture the essential of the features of catalytic oxidation oscillations on .
The main emphasis of this study was the exploration of the spatial structure that underlies the global oscillatory dynamics. The nature of the global oscillations was found to depend sensitively on the coupling between the substrate phase transformations and the dynamics of the species in the adsorbed layer. This is evident from the variations in the oscillatory structure that occur when the diffusion coefficient of adsorbed is varied. The oscillations are regular in character when is large, or irregular, and eventually destroyed, when is small. This behaviour is connected with the formation and synchronization of and islands on the substrate. In the case of large diffusion the and islands are large but the adsorbed layer is disordered. When diffusion is small the islands are smaller in size but exist in the substrate and adsorbed layers. The dynamics in these two layers are strongly synchronized in this case.
The form of the spatial structure in the surface also depends on the harmonic or relaxational character of the global oscillations, which can be tuned by varying , the partial pressure of . In the relaxation oscillation regime well defined waves of phase transformation sweep over the surface. One wave passes before new nucleation events begin another cycle the phase transformaion process. Consequently one sees very regular global oscillations. In the harmonic region, close to the bifurcation boundary, the global oscillations have small amplitude. As a result not all the surface is converted to the or phases. There are no well defined waves of phase transformation, instead certain islands remain locked in one surface phase over several global cycles and nucleation events fill the “seas” between the islands. A rich surface structure underlies the global temporal evolution.
This automaton is a promising tool for study more complex surface catalytic oxidation reactions. Both the adsorbed layer kinetics and the nature of the surface reconstruction can be modified from that considered here. In particular, detailed studies of pattern formation at the mesoscopic level[24, 25] should be possible using such a model and the influence of fluctuations and the possible breakdown of deterministic descriptions can be considered.
Acknowledgements.
The authors wish to thank professors G. Ertl and R. Imbihl for fruitful discussions. The research of R.K. was supported in part by a grant from the Natural Sciences and Engineering Research Council of Canada.REFERENCES
- [1] For reviews see, for instance, G. Ertl, Adv. Catalysis 37, 211 (1990); R. Imbihl, Prog. Surf. Sci. 44, 183 (1993).
- [2] M. Eiswirth and G. Ertl, in Chemical Waves and Patterns, eds. R. Kapral and K. Showalter, (Kluwer, Dordrecht, 1995), p. 447.
- [3] G. Ertl, P. R. Norton and J. Rüstig, Phys. Rev. Lett. 49, 177 (1982).
- [4] M. P. Cox, G. Ertl and R. Imbihl, Phys. rev. Lett. 54, 1725 (1985); R. Imbihl, M. P. Cox and G. Ertl, J. Chem. Phys. 84, 3519 (1986).
- [5] R. Imbihl, M.P. Cox, G. Ertl, H. Müller and W. Brenig, J. Chem. Phys. 83, 1587 (1985).
- [6] P. Möller, K. Wetzl, M. Eiswirth and G. Ertl. J. Chem. Phys. 85, 5328 (1986).
- [7] M. Eiswirth, P. Möller, K. Wetzl, R. Imbihl and G. Ert, J. Chem. Phys. 90, 510 (1989).
- [8] T. Engel and G. Ertl, Adv. Catal. 28, 1 (1979).
- [9] M. A. Van Hove, R. J. Koestner, P. C. Stair, J. P. Biberian, L. L. Kesmodel, I. Bartos and G. A. Somorjai, Surf. Sci. 103, 218 (1981).
- [10] The situation is different for where global coupling through the gas phase is believed to play a significant role (cf. Ref. [7]).
- [11] See, for instance, M. Bär, N. Gottschalk, M. Eiswirth and G. Ertl, J. Chem. Phys. 100, 1202 (1994); Ref. [2].
- [12] X.G. Wu and R. Kapral. Physica A 188, 284 (1992).
- [13] M. Markus and B. Hess, Nature, 347, 56 (1990); M. Markus and K. Stavidis, Phil. Trans. R. Soc. Lond. A 347, 601 (1994).
- [14] M. Gerhardt, H. Schuster and J. J. Tyson, Science, 247, 1563 (1990); Physica D 46, 392 (1990).
- [15] J. Weimar and J. P. Boon, Phys. Rev. E 49, 1749 (1994).
- [16] R. M. Ziff, E. Gulari, Y. Barshad, Phys. Rev. Lett. 56, 2553 (1986); F. Bagnoli, B. Sente, M. Dumond, R. Dagonnier, J. Chem. Phys. 94, 777 (1991).
- [17] H. P. Kaukonen, R. Nieminen, J. Chem. Phys. 97, 4380 (1989); E. L. Pechatnikov, M. Frankowicz, R. Danielak, Acta Phys. Polon. B25, 993 (1994).
- [18] J.-P. Boon, D. Dab, R. Kapral and A. Lawniczak, Physics. Reports, (1995).
- [19] J. Von Neumann, Theory of Self-Replicating Automata, ed. A. W. Birks, (University of Illinois, Urbana, 1966); Theory and Applications of Cellular Automata, ed. S. Wolfram, (World Scientific, Singapore, 1986); R. Kapral, J. Math. Chem. 6, 113 (1991).
- [20] Perhaps the simplest such model consists in assuming that phase transformation is proportional to the fractional occupancy of the neighborhood, in which case , but other forms cannot be excluded until all microscopic details of the phase transformation process are known. The form used in this study gives a stronger weighting to the local coverage and mimics some larger neighborhood rules. Both of these choices give well defined island structure and growth and qualitatively similar phase transformation dynamics. We have considered other forms as well, including with restrictions on and which lead to less well defined surface structures.
- [21] Such bifurcation diagrams do not have precisely defined bifurcation boundaries in view of the probabilistic character of the dynamics. While individual realizations may not always conform to the dynamics indicated by such a bifurcation diagram, in our case the overwhelming majority of realizations do yield the behavior shown in the figure.
- [22] K. Krisher, M. Eiswirth, G. Ertl, J. Chem. Phys. 96, 9161 (1992).
- [23] Y. Kuramoto, Chemical Oscillations, Waves and Turbulence, (Springer, Berlin, 1980).
- [24] S. Nettesheim, A. von Oertzen, H. H. Rottermund and G. Ertl, J. Chem. Phys. 98, 9977 (1993).
- [25] G. Veser, R. Imbihl, J. Chem. Phys. 100, 8483 (1994); ibid, J. Chem. Phys. 100, 8492 (1994).