email: bunker@ast.cam.ac.uk 22institutetext: Department of Astronomy, University of California at Berkeley,
601 Campbell Hall, Berkeley CA 94720, USA
The Deepest Spectrum of the Universe? Constraints on the Lyman Continuum Background at High Redshift
Abstract
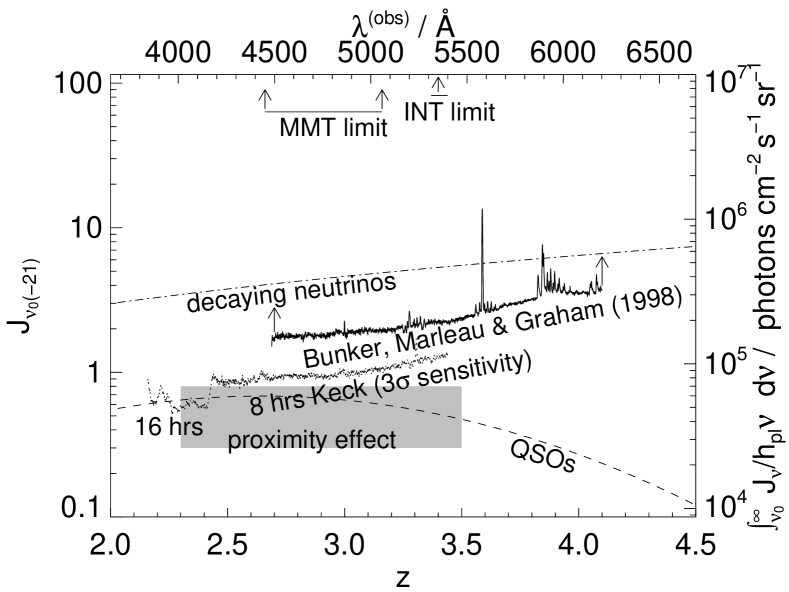
We describe an ongoing experiment to search for the meta-galactic Lyman-continuum background at . We are obtaining one of the deepest optical spectra ever, using LRIS/Keck-II to search for the fluorescent Ly- emission from optically thick H I clouds. The null results of our pilot study (Bunker, Marleau & Graham 1998) placed a upper bound on the mean intensity of the ionizing background of erg s-1 cm-2 Hz-1 sr-1 at . This constraint was more than two orders of magnitude more stringent than any previously published direct limit. Our results excluded the possibility that decaying relic neutrinos are responsible for the meta-galactic radiation field. We have recently greatly extended our search, obtaining a 16-hour spectrum which is sensitive to UV background fluxes erg s-1 cm-2 Hz-1 sr-1 ( at 3 , assuming the H I clouds are \arcsec in extent). We describe how the results of this study can be used to constrain the quasar luminosity function and the contribution of high-redshift star-forming galaxies to the ambient ionizing background.
1 Introduction
The meta-galactic ultraviolet (UV) background has a central astrophysical rôle. The absence of a Gunn-Peterson trough in the spectra of QSOs implies that the inter-galactic medium (IGM) must have been highly ionized by the UV background at even greater redshift. This Lyman continuum background is responsible for maintaining the Ly forest clouds in a highly-ionized state, and may also cause the sharp edges of H I disks in nearby spirals (Dove & Shull 1994). It is widely believed that the meta-galactic UV flux is the integrated light of QSOs, or hot massive stars in young galaxies, or both. However, this ionizing background has never been directly detected. We present here an overview of an ongoing observational program designed to achieve this goal.
2 Seeking the Ultraviolet Background
Hogan & Weymann (1987) proposed that long-slit spectroscopy of “blank sky” should reveal patches of fluorescent Ly emission, excited by the meta-galactic ionizing background, from the population of clouds whose absorption produces the Ly forest in QSO spectra. A measurement of the surface brightness of this fluorescent emission puts limits on the incident ionizing flux at high redshift. Gould & Weinberg (1996) present a treatment of the transport of Ly in clouds with cm-2. For optically thick clouds (, cm-2) the flux of Ly photons from recombination cascades is equal to 0.6 times the flux of incident ionizing photons; this fraction is robust and independent of cloud geometry. The Ly photons are absorbed and re-emitted until scattering from an atom with a velocity , at which point it can escape. A typical Ly cloud with a velocity dispersion of km s-1 (Kim et al. 1997) would have double-peaked fluorescent Ly line with a width of 240 km s-1. Hence, moderate resolution spectroscopy () of an optically thick cloud, known to exist from a QSO absorption system, gives a direct measurement of the energy in the ionizing background. Moreover, since there are a typically one or more Lyman-limit systems per sight-line at , the same long-slit exposure would also detect tens of serendipitous clouds making it possible to make a two-dimensional (2D) map of the Ly forest.
3 Our Survey
The calculations of Gould & Weinberg (1996) suggest that it should be possible to detect fluorescent Ly emission from optically thick Ly clouds at with a deep ( 10 hour) long-slit spectrogram on a 10-m telescope. Motivated by this, we have embarked on an extremely sensitive spectroscopic search with the Keck II Telescope. Our pilot study (detailed in Bunker, Marleau & Graham 1998) showed that it is possible to reach the required line fluxes with the Low Resolution Imaging Spectrograph (LRIS, Oke et al. 1995). Over the past year we have greatly extended our program, obtaining a total of 16 hours of integration time. This constitutes one of the deepest optical spectra ever obtained.
The data for our extended program was taken towards the quasar
DMS 2139.0-0405 (Hall et al. 1996) and a 1\arcsec-wide long-slit was
used with a blue-blazed grating of resolving power . Our observations sample the
wavelength range 3750–5500 Å, corresponding to Ly in the
redshift range . Our most recent 8 hours of data were
obtained using 4 parallel slits with a 10% bandwidth filter
( Å) to cover a much larger solid angle
while concentrating on those redshifts () where our
sensitivity to is greatest (see Fig. 2).
4 Data Analysis
The details of the data reduction are presented in Bunker, Marleau, & Graham (1998). Great care was taken in removing the spectrum of the night sky while preserving any cosmological signal (expected to be spatially-extended line emission of low surface brightness, with a velocity spread ). Rather than doing the sky-subtraction in the usual manner by fitting a polynomial to each column (which might subtract the extended emission we are looking for), we first rectified the sky lines using a distortion matrix. We then subtracted off a high signal-to-noise ratio (SNR) sky spectrum from each detector row, scaled to the slit illumination at that point along the slit. We search for extended Ly emission by smoothing along the spatial axis of the background-subtracted composite 2D spectrum (e.g., Figs. 1b & 1c) on various scale lengths between the size of the seeing disk () and the length of the slit (3\arcmin–7\arcmin). To amplify any signal present in our data, we calculate the 2D power spectrum. This may potentially reveal the combined signal for a population of clouds that are too faint to be detected individually (see the simulation in Fig. 1d). Finally, we use the SExtractor algorithm (Bertin & Arnouts 1996) to catalogue objects and we determine the completeness of our search method via artificial-clouds experiments.
(a) (b) (c) (d)

5 Our Limits on the UV Background
Our initial study (Bunker, Marleau & Graham 1998) based on a 1.5 hour LRIS Keck spectrum failed to find Ly fluorescence from optically-thick clouds. A lack of Ly emission constrains the UV flux. The upper limit on the ambient UV background at (where our constraints on from the pilot study are most stringent) is equivalent to a flux at the Lyman limit of erg s-1 cm-2 Hz-1 sr-1 (Fig. 2). This assumes optically-thick clouds with dimensions – the size of such systems derived from Mg II QSO absorber studies (Steidel & Dickinson 1995). This limit on is almost two orders of magnitude lower than any previous direct limit (Lowenthal et al. 1990; Martínez-González et al. 1995) but is still three times above the expected contribution of known QSOs for (Haardt & Madau 1996). This implies that the completeness of optical QSO catalogs is better than 30% and that the contribution to at from star-forming galaxies (Songaila et al. 1990) cannot exceed twice that from known QSOs. We calculate that the escape fraction of Lyman continuum photons from star-forming galaxies at these redshifts must therefore be less than 10–50% (depending on the dust obscuration of the rest-UV continuum for galaxies). Based on our extended program, our sensitivity thus far on the ambient UV background at probes down to a flux at the Lyman limit of erg s-1 cm-2 Hz-1 sr-1 (see Fig. 2).
6 Conclusion
A search with LRIS/Keck-II is used to constrain the fluorescent Ly emission at from the clouds which produce the higher-column-density component of the Ly forest. The null results of a pilot study by Bunker, Marleau & Graham (1998) provided the best upper limit yet on the ionizing UV background of erg s-1 cm-2 Hz-1 sr-1 (3 limit at ). We have now extended our integration time to 15 hours, attaining a 3 sensitivity of erg s-1 cm-2 Hz-1 sr-1 at – one of the deepest optical spectra ever obtained. We are currently conducting a power-spectrum analysis to detect the signature of the ionizing background at high redshift.
Acknowledgments
We thank the Max Planck Institute for Astronomy, particularly Hans Hippelein and Klaus Meisenheimber, for an enjoyable and informative meeting at Ringberg. We are grateful to everyone at the Keck observatory for their assistance with our program. AJB and FRM acknowledge support from the Cambridge Institute of Astronomy PPARC observational rolling grant, ref. no. PPA/G/O/1997/00793. AJB acknowledges a NICMOS postdoctoral fellowship while at Berkeley (grant NAG 5-3043). JRG is supported by the Packard Foundation.
References
- [1] be96Bertin& Arnouts (1996) Bertin, E., & Arnouts, S. 1996, A&AS, 117, 393
- [2] bu98Bunker, Marleau & Graham (1998) Bunker, A.J., Marleau, F.R., & Graham, J.R. 1998, AJ, 116, 2086
- [3] ch93Charlot & Fall (1993) Charlot, S., & Fall, S.M. 1993, ApJ, 415, 580
- [4] do94Dove & Shull (1994) Dove, J.B. & Shull, J.M. 1994, ApJ, 423, 196
- [5] es93Espey (1993) Espey, B.R. 1993, ApJLett, 411, 59
- [6] go96Gould & Weinberg (1996) Gould, A., & Weinberg, D.H. 1996, ApJ, 468, 462
- [7] ha96Haardt & Madau (1996) Haardt, F., & Madau, P. 1996, ApJ, 461, 20
- [8] hall96Hall et al. (1996) Hall, P.B, Osmer, P.S., Green, R.F., Porter, A.C., & Warren, S.J. 1996, ApJ, 462, 614
- [9] ho87Hogan & Weymann (1987) Hogan, C.J., & Weymann, R.J. 1987, MNRAS, 225, 1
- [10] ki97Kim et al. (1997) Kim, T.-S., Hu, E.M., Cowie, L.L., & Songaila, A. 1997, AJ, 114, 1
- [11] lo90Lowenthal et al. (1990) Lowenthal, J.D., Hogan, C.J., Leach, R.W., Schmidt, G.D., & Foltz, C.B. 1990, ApJ, 389, 1
- [12] ma95Martínez-González et al. (1995) Martínez-González, J.I., González-Serrano, L., Cayón, L., Sanz, J.L., & Martín-Mirons, J.M. 1995, A&A, 303, 379
- [13] ok95Oke et al. (1995) Oke, J.B., Cohen, J.G., Carr, M., Cromer, J., Dingizian, A., Harris, F.H., Labrecque, S., Lucinio, R., Schall, W., Epps H. & Miller, J. 1995, PASP, 107, 375
- [14] sc98Sciama (1998) Sciama, D.W. 1998, A&A, 335, 12
- [15] so90Songaila, Cowie & Lilly (1990) Songaila, A., Cowie, L.L. & Lilly, S.J. 1990, ApJ, 348, 371
- [16] st95Steidel & Dickinson (1995) Steidel, C.C., & Dickinson, M. 1995, in “Wide Field Spectroscopy of the Distant Universe”, p. 349, eds. Maddox, S.J. & Aragon-Salamenca, A.
- [17] sl95Stengler-Larrea et al. (1995) Stengler-Larrea, E., Boksenberg, A., Steidel, C.C., et al. 1995, ApJ, 444, 64